The Dependence of Star Formation History and Internal Structure on
Stellar Mass for Low-Redshift Galaxies
Guinevere Kauffmann1, Timothy M. Heckman2, Simon D.M. White1,
Stéphane Charlot1,3, Christy Tremonti2, Eric W. Peng2,
Mark Seibert2, Jon Brinkmann4, Robert C. Nichol5, Mark SubbaRao6,
Don York6
1Max-Planck Institut für Astrophysik, D-85748 Garching, Germany
2Department of Physics and Astronomy, Johns Hopkins University, Baltimore, MD 21218
3 Institut d’Astrophysique du CNRS, 98 bis Boulevard Arago, F-75014 Paris, France
4 Apache Point Observatory, P.O. Box 59, Sunspot, NM 88349
5 Department of Physics, Carnegie Mellon University, 5000 Forbes Ave, Pittsburgh,
PA 15232
6 Department of Astronomy, University of Chicago, 5640 South Ellis
Ave, Chicago, IL 60637
We study the relations between stellar mass, star formation history, size and internal structure for a complete sample of 122,808 galaxies drawn from the Sloan Digital Sky Survey. We show that low-redshift galaxies divide into two distinct families at a stellar mass of . Lower mass galaxies have young stellar populations, low surface mass densities, and the low concentrations typical of disks. Their star formation histories are more strongly correlated with surface mass density than with stellar mass. A significant fraction of the lowest mass galaxies in our sample have experienced recent starbursts. At given stellar mass, the sizes of low mass galaxies are log-normally distributed with dispersion , in excellent agreement with the idea that they form with little angular momentum loss through cooling and condensation in a gravitationally dominant dark matter halo. Their median stellar surface mass density scales with stellar mass as , suggesting that the stellar mass of a disk galaxy is proportional to the three halves power of its halo mass. All this suggests that the efficiency of the conversion of baryons into stars in low mass galaxies increases in proportion to halo mass, perhaps as a result of supernova feedback processes. At stellar masses above , there is a rapidly increasing fraction of galaxies with old stellar populations, high surface mass densities and the high concentrations typical of bulges. In this regime, the size distribution remains log-normal, but its dispersion decreases rapidly with increasing mass and the median stellar mass surface density is approximately constant. This suggests that the star formation efficiency decreases in the highest mass halos, and that little star formation occurs in massive galaxies after they have assembled.
Keywords: galaxies:formation,evolution; galaxies: stellar content
1 Introduction
Perhaps the most remarkable aspect of galaxies is their regularity – the fact that they can be classified into well-defined sequences. Hubble (1926) introduced the first scheme to categorize galaxies according to morphological type, and its basic concepts are still in use today. In its simplest form, three basic galaxy types are recognized: ellipticals, spirals and irregulars. These can be arranged in a linear sequence along which many properties vary coherently. The most striking trends are the variations in morphology (featureless ellipsoid to spiral disk to irregular appearance) and in colour and star formation activity. These trends were so striking that they formed the basis of Hubble’s original scheme. Elliptical galaxies have red colours, little gas and no ongoing star formation; irregulars have blue colours, large gas fractions and are actively forming stars. An up-to-date review of star formation along the Hubble sequence is given in Kennicutt (1998).
It should be remembered that Hubble introduced his galaxy classification scheme at a time when distance estimates were available for only a handful of galaxies. Hubble could not study the properties of galaxies as a function of parameters that measure their absolute scale: sizes, absolute magnitudes and masses. Today it is known that the distribution of Hubble types depends strongly on galaxy luminosity. The typical elliptical galaxy is a factor more luminous in the B-band than the typical irregular galaxy (Roberts & Haynes 1994). As a result, the faint end of the galaxy luminosity function is dominated by late-type galaxies with strong emission lines, the bright end by early-type galaxies with little star-formation (e.g. Loveday et al 1992; Marzke et al 1994; Lin et al 1996; Zucca et al 1997; Marzke et al 1998; Christlein 2000). These trends in star formation activity become even more pronounced when studied in the near-infrared. This has led to suggestions that the ratio of present to past-averaged star formation rate may depend primarily on stellar mass and only secondarily on morphological type (Boselli et al 2001; Balogh et al 2001).
There have been many studies of stellar populations and star formation histories that focus on galaxies of a particular Hubble type. The star formation rates in most irregular and dwarf galaxies in the Local Group do not appear to have varied smoothly with time, but instead have undergone large fluctuations or “bursts” (see Grebel 2000 for a recent review). There is evidence that the recent star formation histories of spirals depend on the surface brightness of their disks. Low surface brightness galaxies appear to have bluer colours and higher gas mass fractions than high surface brightness galaxies (e.g. de Blok, van der Hulst & Bothun 1995; de Blok, McGaugh & van der Hulst 1996; Bell & de Jong 2000). The situation for ellipticals is currently unclear. Although there is considerable evidence that the absorption line strengths of early-type galaxies vary systematically with their velocity dispersions, there is much debate as to whether this reflects trends in stellar age, in metallicity or in the relative abundance of different heavy elements (e.g. Trager et al 1998; Kuntschner et al 2001).
The Sloan Digital Sky Survey will obtain , and -band photometry, spectra and redshifts for at least 700,000 galaxies down to a limiting -band magnitude of 17.77. This is the most ambitious survey of the local galaxy population ever undertaken and motivates a critical re-evaluation of trends in the star formation histories of galaxies as a function of mass, size, internal structure and environment.
We have recently developed a new method to constrain the star formation history, and to estimate the dust attenuation and stellar mass of galaxies (Kauffmann et al 2002; hereafter Paper I). It is based on two stellar absorption line indices, the 4000 Å break strength and the Balmer absorption line index H. These indices allow us to constrain the mean stellar age of a galaxy and the fraction of its stellar mass formed in bursts over the past few Gyr. A comparison with broad band magnitudes then yields estimates of dust attenuation and of stellar mass. We have generated a large library of Monte Carlo realizations of different star formation histories, including starbursts of varying strength. We have used this library to generate likelihood distributions for parameters such as burst mass fraction, dust attenuation strength, stellar mass and stellar mass-to-light ratio for every galaxy in a complete sample of 122,808 objects drawn from the Sloan Digital Sky Survey.
Paper I introduced our method and used it to measure how the total stellar mass of the Universe is distributed over galaxies as a function of their stellar mass, size, concentration, colour and surface mass density. In this paper, we focus on the mass dependence of the star formation histories, sizes and structural parameters of galaxies. We study to what extent the recent star formation histories of galaxies of different stellar mass can be characterized as continuous or as burst-dominated. We also show how the distributions of structural parameters (size, surface mass density, concentration index) vary with stellar mass, and we demonstrate that variations in star formation history and in structural parameters are tightly coupled. Finally, we interpret our findings in the context of current theories of galaxy formation.
2 Review of the Observed and Derived Parameters of Galaxies
The sample of galaxies analyzed in this paper is drawn from the Sloan Digital Sky Survey (York et al 2000; Stoughton et al 2002). We have included all galaxies with spectroscopic observations in the Data Release One (DR1) and with Petrosian band magnitudes in the range after correction for foreground galactic extinction. Details about the spectroscopic target selection may be found in Strauss et al (2002). These data represent roughly 20% of the projected survey total and include a total of 122,808 galaxies.
The reader is referred to Paper I for more information about the sample and a detailed description of the methods used to derive parameters such as stellar mass and burst mass fraction. We also discuss the uncertainties in our methods in Paper I. Here we provide a brief summary of the quantities that are studied in this paper:
-
1.
Absolute magnitudes: All magnitudes quoted in this paper are Petrosian magnitudes. In order to convert from apparent to absolute magnitude, we assume a Friedman-Robertson-Walker cosmology with , and H0= 70 km s -1 Mpc-1. We have calculated the K-corrections for each galaxy using the routines in kcorrect v1_11 (Blanton et al. 2002). In order to minimize the errors in this procedure, we K-correct the magnitudes of all galaxies in our sample to More details about the SDSS photometric system may be found in Fukugita et al (1996) and Smith et al (2002). Information relating to the SDSS camera and photometric monitoring system can be found in Gunn et al (1998) and Hogg et al (2001). A technical paper describing the astrometry in the survey has recently been published by Pier et al (2002).
-
2.
Stellar spectral indices: We have adopted the narrow definition of the 4000 Å break introduced by Balogh et al (1999), which we denote Dn(4000). We also use the Balmer absorption index H as defined by Worthey & Ottaviani (1997) using a central bandpass bracketed by two continuum bandpasses. The evolution of the two indices have been calibrated using a new population synthesis code that incorporates high resolution stellar libraries (Bruzual & Charlot 2002). Our measurements of H are corrected for contamination due to nebular emission. As discussed in Paper I, the Dn(4000) index is an excellent age indicator for young ( Gyr, Dn(4000)) stellar populations, but for older stellar populations, the index depends quite strongly on metallicity. Strong Balmer absorption occurs in galaxies that experienced a burst of star formation 0.1-1 Gyr ago. Analyzed together, the two indices are a powerful probe of the recent star formation history of a galaxy. Because each is defined over a narrow wavelength interval, they are not sensitive to dust attenuation effects.
-
3.
Stellar masses: The stellar masses are derived assuming a universal initial mass function (IMF) in the parametrisation of Kroupa (2001). The typical 95% confidence range in our estimated stellar masses is 40 %.
-
4.
Burst mass fractions: We define the parameter as the fraction of the total stellar mass of a galaxy that formed in “burst” mode over the past 2 Gyr. In Paper I we showed that galaxies with continuous star formation histories occupy a very narrow locus in the H/Dn(4000) plane. Galaxies that experienced recent bursts have H values that are displaced from this locus. Because the typical observational error on the H index is large (1.4 Å ) in our sample, the median value of the likelihood distribution of is sensitive to the mix of star formation histories in our model library, which functions as a Bayesian prior for our analysis. As a result, we focus below on galaxies for which our analysis implies with high confidence (97.5% for our standard prior). The tests described in Paper I showed the resulting sample to be insensitive to the actual prior adopted.
-
5.
Galaxy sizes: We study the distribution functions of R50(), the radius enclosing 50% of the Petrosian -band luminosity of a galaxy. We note that the sizes output by the current SDSS photometric pipeline have not been corrected for seeing effects (Stoughton et al 2001).
-
6.
Concentration indices: In order to be consistent with previous work (Blanton et al 2001; Strateva et al 2001; Shimasaku et al 2001) we define the concentration index as the ratio , where R90 and R50 are the radii enclosing 90% and 50% of the Petrosian -band luminosity of the galaxy. It has been shown by Shimasaku et al (2001) and Strateva et al (2001) that for bright galaxies, there is a good correspondence between concentration parameter and ‘by-eye’ classification into Hubble type, with marking the boundary between early and late type galaxies.
-
7.
Surface brightnesses and surface mass densities: Following Blanton et al (2001), we define the half-light surface brightness to be the average -band surface brightness within the -band half-light radius R50 in magnitudes per square arcsecond. The main spectroscopic survey is complete down to a limiting half-light surface brightness mag arcsec-2. We define the surface mass density as , where is the Petrosian half-light radius in the -band (we choose a radius defined in the -band rather than -band, as this provides a better approximation to the radius enclosing half the total stellar mass).
In this paper, we will often use bivariate density distributions in the parameters and , defined such that is the number of galaxies per unit volume with in the interval and in the interval . Such bivariate distributions are calculated by weighting each galaxy in the sample by , where is the volume corresponding to the total redshift range over which the galaxy would pass our sample selection criteria. Because our sample is extremely large, errors due to large scale structure are expected to be small. In many cases we will be interested in trends in the distribution of the parameter as a function of the parameter (for example in the distribution of concentration or size as a function of stellar mass). In such cases, we make the trends more visible by plotting the conditional distribution of given , i.e. .
3 The Observed Correlations
3.1 The Dependence of Star Formation History on Stellar Mass
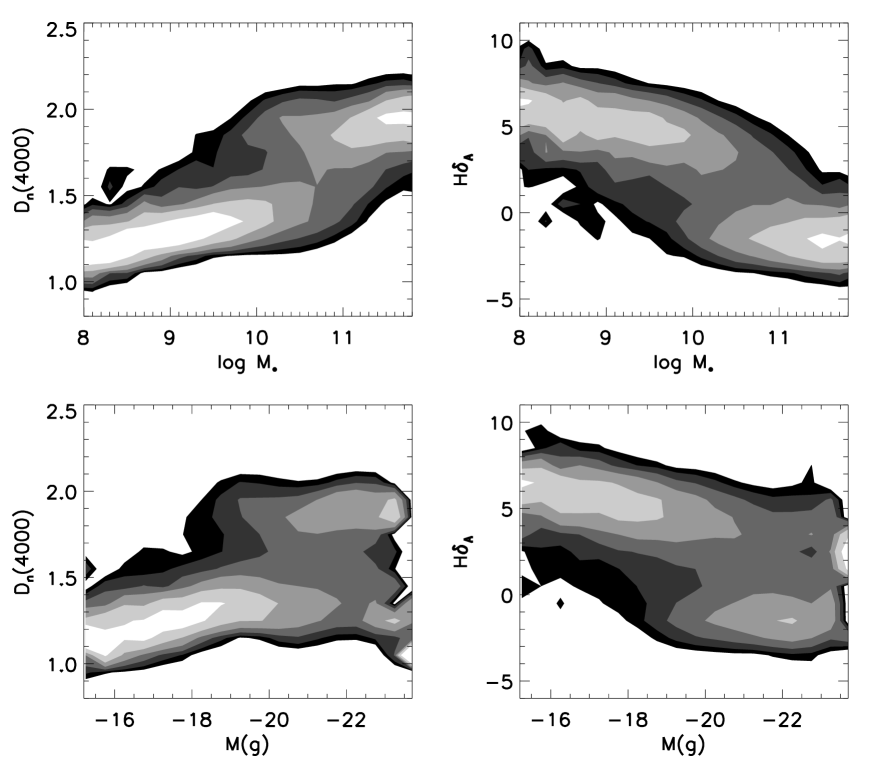
In Fig. 1, we present the conditional density distributions of our two stellar age indicators Dn(4000) and H as a function of stellar mass and as a function of -band absolute magnitude. The grey-scale indicates the fraction of galaxies in a given logarithmic mass (or magnitude) bin that fall into each age-indicator bin. The contours are separated by factors of 2 in population density.
It is clear that Dn(4000) and H depend strongly on both stellar mass and absolute magnitude. The main effect of transforming from luminosity to mass is to produce a more regular variation of the indices. Fig. 1 shows that low mass galaxies are ‘young’– they typically have low values of Dn(4000) and high values of H. At a mass of M⊙, a transition towards older stellar populations begins to take effect. Almost all of the most massive galaxies in our sample have high values of Dn(4000) and low values of H.
Fig. 2 shows “slices” through the Dn(4000)- distribution. Recall that the measurement error on the Dn(4000) index is small, typically around 0.04, or a few percent of the total range of values spanned by galaxies in our sample. Again, one sees a striking trend towards older stellar populations for galaxies with larger stellar masses. Both in Fig. 1 and in these plots one gets the impression of two separate and relatively well-defined populations. The relative weight of the ‘old’ population increases strongly at stellar masses above .
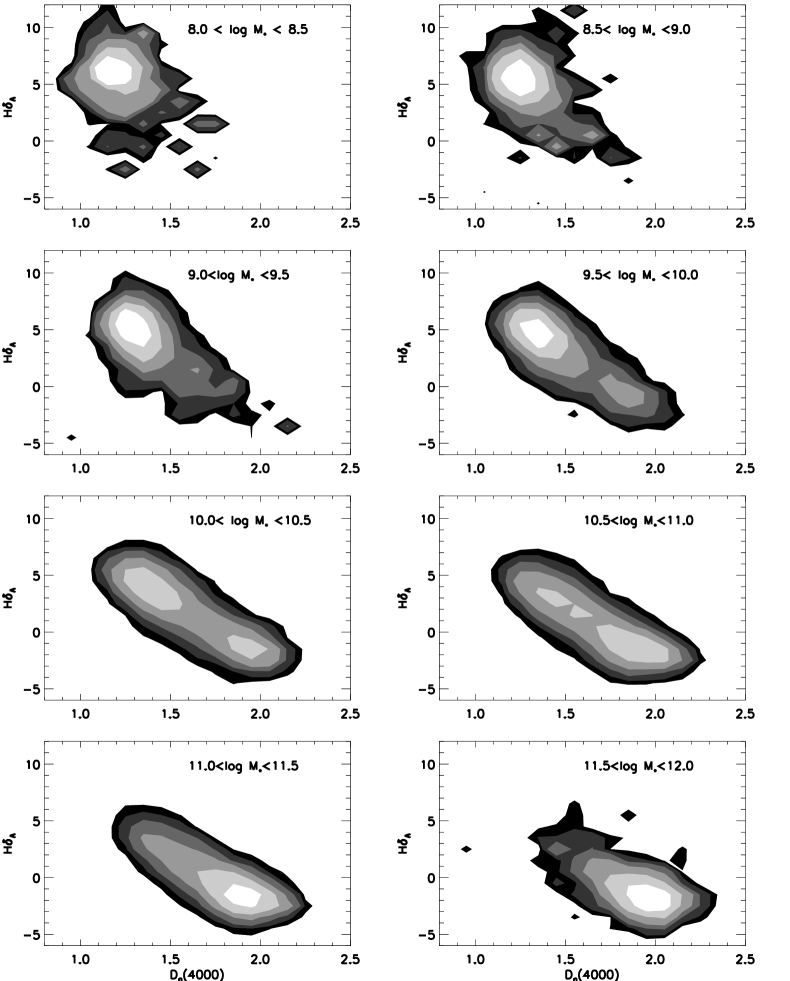
The bivariate density distribution of H and Dn(4000) is shown in Fig. 3 for galaxies in 8 ranges of stellar mass spanning four orders of magnitude from to . In these plots, the grey scale indicates the fraction of galaxies that fall into each bin of and D. It is striking how galaxies move diagonally across the H/Dn(4000) plane as their masses increase.
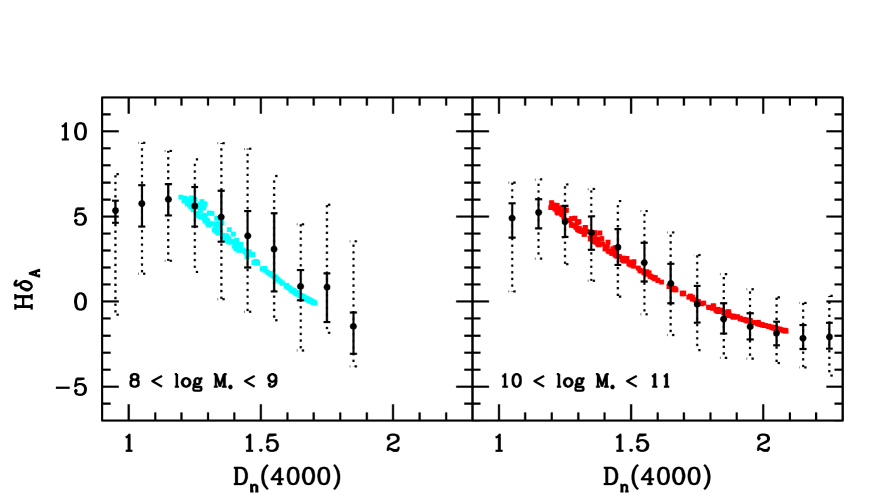
From Fig. 3, one can see clearly that low mass galaxies with (characteristic of stellar populations with mean ages of less than a few Gyr) have a larger scatter in H equivalent width than high mass galaxies with similar break strengths. This means that the fraction of low mass galaxies that have experienced recent bursts is higher than that for high mass galaxies, even when the two populations are compared at similar mean stellar age. We illustrate this in detail in Fig.4, where we plot the median value of H as a function of Dn(4000) for low mass and for high mass galaxies. The solid and dotted errorbars indicate the 25th to 75th and 5th to 95th percentile ranges of the distribution of H values. For comparison, we have overplotted 200 different model galaxies with continuous star formation histories. The models span a wide range in exponential timescale ( to 10 Gyr) and formation redshift ( to 0.2). The reader is referred to Paper I for more details about the models. Solar metallicity models are plotted in the right hand panel. In the left hand panel, we have plotted 20% solar models, which are more appropriate for galaxies with masses between and (Tremonti et al 2003) For massive galaxies , the data agree extremely well with the model predictions. The scatter in H at given Dn(4000) is consistent with that expected from observational errors. Note that although we plot the distribution of H down to very low Dn(4000) values, Fig. 2 shows that less than 5% of galaxies with stellar masses in the range have values Dn(4000) too low to be consistent with any of our continuous models. For low mass galaxies, this is no longer true. Fig. 2 shows that % of all galaxies have Dn(4000). As discussed in Paper I, many of these galaxies are likely to be experiencing a starburst at the present day. Fig. 4 shows that for low mass galaxies, the data are also displaced upwards relative to the predictions of the continuous models and the scatter is too large to be consistent with observational errors. As discussed in Paper I, galaxies with moderate values of Dn(4000) and very high values of H are likely to be in a post-starburst phase.
In Paper I, we introduced models in which galaxies formed stars in two different modes: i) a “continuous” mode , which we parametrized by an exponential law with timescale and starting time , and ii) a superposed “burst” mode. A burst was defined to be an episode of star formation lasting between and years in which a fraction of the total stellar mass of the galaxy was formed. In Paper I, we also introduced a method that allowed us to calculate the a posteriori likelihood distribution of for each galaxy in our sample, given its observed absorption line indices and the measurement errors on these indices. In Fig. 5, we plot the distribution of galaxies as a function of for 8 different mass ranges. The distribution of the median value of (which we denote ) for all galaxies in the given mass range is plotted as a solid histogram. We define a subsample of high-confidence bursty galaxies as those objects with , where is the lower 2.5 percentile point of the likelihood distribution of . The distribution of for this subsample is plotted as a dotted histogram in Fig. 5.
In our lowest mass range (), we find that half of all galaxies have . However, it is only for 10% of these objects that we can state with high (97.5%) confidence that a burst did occur in the recent past. The fraction of galaxies that have experienced recent bursts decreases very strongly with increasing stellar mass. This trend is apparent both in the fraction of galaxies with and in the fraction with . There are very few high confidence bursty galaxies in our high mass bins. Out of our entire sample of 120,000 galaxies, we only pick out around 500 galaxies with masses comparable to that of the Milky Way and with . For our full sample, the median value of the burst mass fraction correlates with stellar mass. The same is not true for the high confidence bursty galaxies – these systems have burst mass fractions that are independent of stellar mass. Note that our requirement that a burst be detected at high confidence will, by definition, bias this subsample towards high burst fractions. The trend in burst mass fraction for our full sample is in some sense expected, because it is well known that more massive galaxies have lower gas mass fractions and thus contain less fuel for star formation (e.g. Roberts & Haynes 1994; Boselli et al 2001; Bell & de Jong 2001). What about the influence of our adopted prior? The analysis in Paper I showed that decreasing the number of bursty galaxies in the model library resulted in lower estimated values of . Our standard prior assumes that the fraction of bursty galaxies is constant, in apparent contradiction with the results shown in Fig. 5. Our choice of prior would therefore tend to weaken, rather than strengthen, any true decrease in towards high masses. Paper I also demonstrated that the definition and inferred properties of our high confidence subset of bursty galaxies in insensitive to the adopted prior.
In Figs. 6 and 7 we compare the distributions of H emission line equivalent widths for galaxies with and for galaxies with . In Fig. 6, we have subdivided the two samples into different bins in Dn(4000) in order to take into account any systematic mean age difference between galaxies with and without recent bursts. For galaxies with low values of Dn(4000), there is a tendency for bursty galaxies to have stronger H emission than non-bursty galaxies with similar break strengths. These are galaxies whose present-day star formation rates are enhanced over other systems of similar mean stellar age (recall that the H emission is coming from stars less than years in age). For galaxies with high values of Dn(4000), the trend is reversed. These high Dn(4000) galaxies are presumably “post-starburst” systems that experienced a strong burst some time in the past, but have subsequently stopped forming any stars. In Fig. 7, we compare galaxies with and galaxies with in fixed bins of stellar mass. Low mass bursty galaxies are skewed to higher H equivalent widths, while high mass bursty galaxies exhibit a wider range in equivalent widths than their counterparts with . Because information about H was not used when selecting our sample of bursty galaxies, we regard these differences in emission line properties as evidence that our method does pick out a sample of galaxies with very strong variations in recent star formation history.
3.2 The Dependence of Structural Parameters on Stellar Mass
In Fig. 8, we present conditional density distributions for concentration index , -band half-light surface brightness , and surface mass density as functions of stellar mass and of -band absolute magnitude. Fig. 8 demonstrates that the structural parameters of galaxies correlate both with absolute magnitude and with stellar mass, but once again we find that the trends are smoother when plotted as a function of stellar mass.
The surface mass density exhibits a strikingly tight correlation with stellar mass. increases by nearly two orders of magnitude from kpc-2 for galaxies with to kpc-2 for the most massive galaxies with . In contrast, the -band surface brightness only increases by a factor of as increases by 8 magnitudes. There is a sharp change in slope in the relation at a stellar mass of . A transition at the same stellar mass is also seen in the relation. Interestingly, this is also the stellar mass at which galaxies switch from low D to high Dn(4000) in Fig. 1. It is important to note that virtually all galaxies in our sample with have mag arcsec-2. The main spectroscopic survey is complete to surface brightnesses a magnitude fainter than this, so our results should not be biased by surface brightness selection effects.
Fig. 9 presents the size distributions for galaxies in eight disjoint ranges of stellar mass. We plot the fraction of galaxies as a function of the natural logarithm of the half-light radius in the -band. These size distributions are extremely well described by a log-normal function
| (1) |
where is the median value of the size distribution and is the dispersion in . We have indicated the value of and for the lognormal fit in each panel in Fig. 8. The shape of the size distribution is largely independent of mass for galaxies with and is well fit by . The median size scales with stellar mass as . For stellar masses larger than , the shape of the size distribution is still lognormal, but the dispersion decreases. also increases more rapidly with mass () in this regime.
Figs. 10 and 11 show the distributions of concentration index and surface mass density for these same eight stellar mass ranges. The distribution of is nearly independent of stellar mass for galaxies with . The median value of for these systems is around 2.3. Only about 10% of low mass galaxies have , the value that marks the transition from late-type to early-type morphologies (Strateva et al 2001). At larger masses, the distribution shifts to progressively higher concentrations. In our highest mass bin 90% of galaxies have index values larger than 2.6. Fig. 11 shows that for galaxies with , the median surface mass density scales with stellar mass as . The distribution is fairly broad and its shape does not appear to depend very strongly on stellar mass. At values of larger than , the scaling of the median value of with stellar mass becomes much weaker. The shape of the distribution function skews and is eventually strongly peaked at values of around kpc-2.
We note that all structural parameters discussed in this section have been calculated within circular apertures. We have estimated the additional scatter in size resulting from variations in axis-ratio and find that this has very small () effect on the values of the dispersion that we estimate. Because of seeing effects, may be overestimated for galaxies with small angular sizes. We have split the galaxies in each stellar mass range into two equal samples according to redshift, and we have compared the size distribution of the nearby sample with that of the full sample. This is illustrated in two of the panels of Fig. 9. As can be seen, the effects appear to be quite small. In addition, we have checked the scalings using and find that our conclusions remain unchanged.
3.3 The Connection Between Star Formation History and Structural Parameters
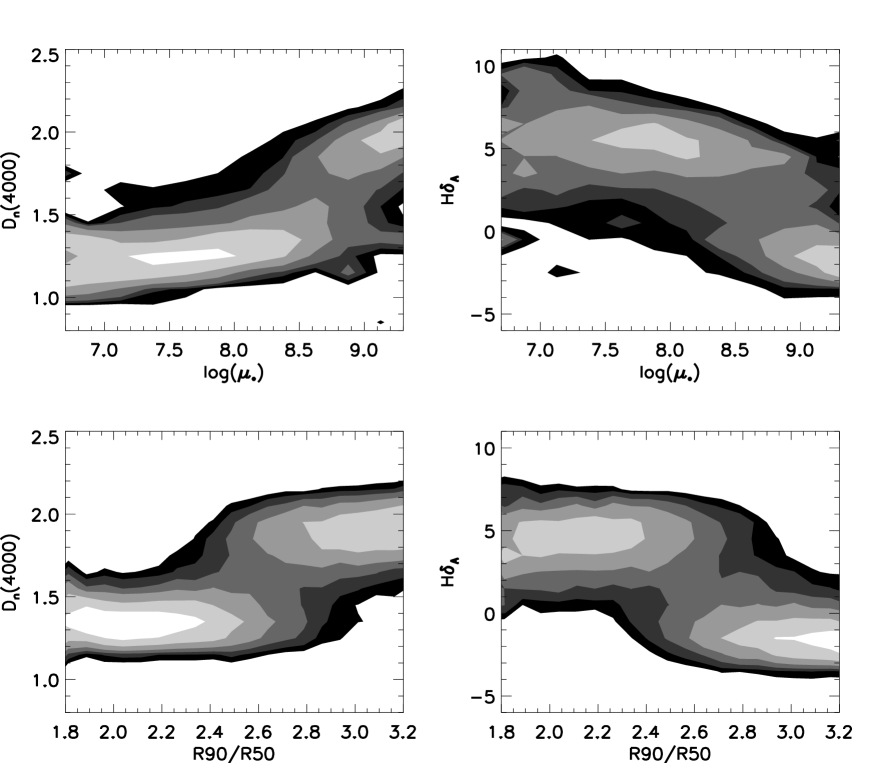
In the previous two subsections we showed that both the star formation histories and the structural parameters of galaxies depend strongly on stellar mass. It is therefore not surprising that the star formation histories of galaxies correlate with and . This is illustrated in Fig. 12 where we present the conditional density distributions of the two stellar absorption indices Dn(4000) and H as functions of surface mass density and of concentration. Galaxies with low surface density have low values of Dn(4000) and galaxies with high surface density have high values of Dn(4000), with a strong transition at kpc-2. There is also a striking transition in the values of Dn(4000) and H at values around 2.6. We note that this corresponds very well to the value of recommended by Strateva et al (2001) for optimum separation between early and late Hubble types, based on an analysis of a small sample of galaxies classified by eye.
We now ask whether it is possible to pinpoint the primary cause of variations in the star formation history of galaxies – do galaxies have low values of Dn(4000) and high values of H because their masses are small or because their surface mass densities are low? We attempt to address this question in Fig. 13 where we plot the fractions of galaxies with Dn(4000) and with H as a function of surface mass density in narrow ranges of stellar mass (left panels), and as a function of stellar mass in narrow ranges of surface mass density (right panels). We only plot these fractions for values of and where there are more than 100 galaxies per bin. Dn(4000)=1.55 and H=2 are chosen as natural places to divide the sample, because this is where clear transitions occur in the Dn(4000)/ and H/ plots in Fig. 12. (Note that the index is determined directly from the photometric data, independently of both stellar mass and surface mass density).
Fig. 13 shows that the two indices are more fundamentally related to than to . The fraction of galaxies with Dn(4000) or with H is largely independent of stellar mass at a given value of , although the most massive galaxies with clearly deviate in that they have larger values of Dn(4000) and smaller values of H at given . At given stellar mass, however, the fraction of galaxies with Dn(4000)1.55 or with H is a strongly increasing function of . These results are in qualitative agreement with those of Bell & de Jong (2000), who studied trends in the optical and infrared colours of a sample of nearby spiral galaxies and found that the colours most sensitive to star formation history correlate best with surface density. It also fits in well with numerous studies that have demonstrated a clear correlation between star formation rate and gas surface density for samples of spirals (e.g. Kennicutt 1983; Wong & Blitz 2002).
3.4 Summary
In the previous subsections, we demonstrated that there are strong correlations between the star formation histories, stellar masses and structural parameters of galaxies. Here we provide a summary of our results:
-
1.
Low mass galaxies have low values of Dn(4000) and high values of H, indicative of young stellar populations . High mass galaxies have high values of Dn(4000) and low values of H, indicative of old stellar populations. A sharp transition from young to old occurs at a stellar mass of around .
-
2.
Low mass galaxies have low surface mass densities and low concentrations. High mass galaxies have high surface mass densities and high concentrations. An abrupt change in the slopes of the and relations occurs at a stellar mass of .
-
3.
The size distribution function of galaxies less massive than is well characterized by a lognormal distribution with dispersion . Galaxies more massive than also have a lognormal size distribution, but the dispersion is smaller.
-
4.
Below the transition mass the median size of galaxies increases as . Above the transition mass the increase is more rapid, .
-
5.
Galaxies with low surface mass densities and low concentrations have Dn(4000) and H values indicative of young stellar populations. Galaxies with high surface mass densities and high concentrations have Dn(4000) and H values indicative of old stellar populations. The transition from young to old stellar populations occurs at kpc-2 and .
-
6.
The star formation histories of low mass galaxies, as traced by Dn(4000) and H , appear to be more fundamentally related to surface mass density than to stellar mass.
-
7.
The fraction of galaxies that have experienced recent starbursts decreases strongly with increasing stellar mass (and increasing surface mass density).
4 Interpretation and Discussion
Our analysis has demonstrated that there is a sharp transition in the physical properties of galaxies at a stellar mass of . Galaxies less massive than this have low surface mass densities, low concentration indices typical of disks and young stellar populations. More massive galaxies galaxies have high surface mass densities, high concentration indices typical of bulges, and predominantly old stellar populations.
The size distribution of disk galaxies is of particular interest, because it can be compared directly to simple theoretical models. In a classic paper in 1980, Fall & Efstathiou considered the formation of a disk by the condensation of gas in a gravitationally dominant dark matter halo. If the gas initially has the same specific angular momentum as the dark matter and conserves its angular momentum during its contraction, then the characteristic radius of the disk will scale as
| (2) |
where is the virial radius of the halo. The spin parameter is defined as
| (3) |
where is the total energy of the halo, is its total angular momentum and is its total mass (see Mo, Mao & White (1998) for a detailed analytic model).
N-body simulations show that in hierarchical clustering cosmologies, the distribution of for dark matter halos has lognormal form with parameters which depend very weakly on cosmology or on halo mass (Barnes & Efstathiou 1987; Warren et al 1992; Cole & Lacey 1996; Lemson & Kauffmann 1999) with typical values and . The fact that for low mass galaxies the shape and width of the size distributions in Fig. 9 agree so well with this simple theory is truly remarkable. We note that our results are in qualitative agreement with those of Syer, Mao & Mo (1999), who find that the distribution of spin parameter inferred from a sample of nearby disk galaxies is in excellent agreement with the predictions of cosmological simulations. On the other hand, our results appear to disagree with those of de Jong & Lacey (2000), who find that the distribution of disk sizes is narrower than predicted by simple models. We note that neither of these two studies addressed possible variations in the size distributions of disk galaxies as a function of luminosity or of mass.
It is not obvious how the stellar mass of a galaxy should scale with the mass of its dark matter halo. For simplicity, one might assume that a fixed fraction of the baryonic mass ends up in disk stars, in which case and (this assumes that baryons follow the dark matter, at least initially). From Fig. 9, we find that median size increases more slowly than predicted. This means that the stellar mass fraction must increase with halo mass.
We now derive the scaling between the stellar mass of a disk galaxy and the mass of its dark matter halo from the slope of the relation. If we adopt the assumptions of the simple model, we can write
| (4) |
where is the efficiency with which the disk has converted the available gas into stars. The Fall & Efstathiou arguments are only directly relevant to the formation of disk galaxies, while the conditional density distributions shown in Fig. 9 are derived using all galaxies in the sample. At stellar masses greater than , a large fraction of the galaxies are bulge-dominated systems. In order to clarify the scaling properties of our two principal classes of galaxy, we define two subsamples which eliminate most of the mixed systems: i) a sample of late-type galaxies with and (41312 galaxies); and ii) a sample of early-type galaxies with and (53119 galaxies). Fig. 12 demonstrates that these cuts divide young, disk-dominated systems from old, bulge-dominated systems surprisingly cleanly.
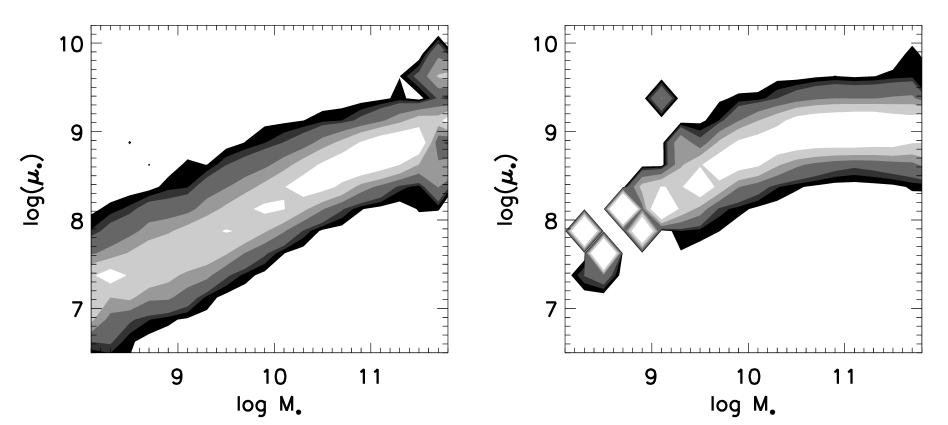
The relation of our late-type subsample is shown in the left panel of Fig. 14, while the right panel shows the corresponding relation for early-types. It is striking that the relation for the late-type subsample can be described quite well by a single power-law. The relation for early-type galaxies still appears to undergo a transition in slope. (Note that there are few late-type galaxies with stellar masses above and few early-types with below .) Fig. 14 also shows that early-type galaxies of given stellar mass have higher stellar surface densities than late-type galaxies of the same mass. This difference is largest for the lower mass objects and disappears for the most massive systems in our samples.
Fitting to the dominant part of the population of late-type galaxies (i.e. over the stellar mass range – ) , we find , so that and . The star formation efficiency for disk galaxies apparently increases with halo mass. Such an increase is expected in a model where supernova feedback controls the dynamics of the interstellar medium. (e.g. McKee & Ostriker 1977; Efstathiou 2000). In most feedback models, supernovae inhibit the formation of stars in low mass halos, leading to small values of (e.g. White & Frenk 1991; Kauffmann, White & Guiderdoni 1993; Cole et al 1994). However, because we do not have any information about the gas fractions of the galaxies in our sample, we cannot say whether the suppression of star formation occurs because gas is expelled from the galaxy and from its halo, as is often assumed in these models, or because the conversion of gas into stars is slowed in low mass systems. It is interesting that Tremonti et al (2003) find the gas phase metallicity of low mass galaxies to increase with stellar mass as (depending on which metallicity indicator they use), suggesting a similar dependence of overall star formation efficiency on stellar mass.
For early-type galaxies, we fit over the range and obtain . If we assume that for these galaxies, this would imply that , i.e. the the star formation efficiency for ellipticals decreases with halo mass. Clues as to why this is the case may come from recent Chandra and XMM observations, which show that cooling of gas to temperatures below 1 keV is suppressed at the centres of rich clusters, where the most massive ellipticals are located (e.g. Fabian et al 2001; Bohringer et al 2001). It seems very likely that the assembly of bulge-dominated galaxies involved chaotic processes such as mergers or inhomogenous, rapidly star-forming collapse, which, for most systems, must have completed well before the present day. Under these circumstances, it is not clear that our assumed scaling between galaxy radius and dark matter halo radius is valid. Even if the simple scaling laws were to apply, the halo sizes and surface densities relevant for early-type galaxies are likely to be defined at higher effective redshift than those relevant for late-type galaxies. This may explain why early-type galaxies in Figure 14 have higher surface densities than late-type galaxies of similar mass. The scatter in surface density (and size) is also smaller for early-type than for late-type galaxies, as is very evident in Figure 14 as well as in Figures 8 and 9.
We note that the Lyman Break Galaxies (LBGs) at high redshift can plausibly be identified with the progenitors of early-type galaxies. Pettini et al.(2001) have derived a mean effective dynamical mass of 1.3 within a mean half-light radius of 2.3 kpc for a sample of LBGs at . Shapley et al.(2001) and Papovich et al. (2001) have estimated the stellar massses of LBGs using their observed rest-frame ultraviolet and optical spectral energy distributions. These agree well with the dynamical mass estimates. Lyman Break Galaxies thus have characteristic surface mass densities of kpc-2, quite similar to those of present-day early-type galaxies. Moreover, if the star-formation associated with the Lyman Break Galaxies is integrated from from 2 to 6, one finds that they could have produced most of the stars in present-day early-type galaxies (Steidel et al. 1999; Thompson et al 2001).
In the framework of hierarchical models of galaxy formation, the shape of the size distributions of low mass galaxies is easy to understand, but the trend of younger mean stellar ages with decreasing stellar mass is puzzling, since lower mass dark matter halos typically form at earlier epochs. If all the gas cooled off and formed stars when these halos were assembled, lower mass galaxies would have older stellar populations (e.g. Kauffmann, White & Guiderdoni 1993). We have seen,however, that non-gravitational processes such as supernova feedback may play an important role in regulating the rate at which stars form in these systems. To explain the observations, these processes must slow the conversion of gas into stars so that low mass systems remain gas rich until the present day and have low overall efficiencies for turning gas into stars. We have seen that the star formation histories of low mass galaxies are correlated more strongly with surface density than with stellar mass. If feedback processes are able to prevent the gas in low suface density galaxies from dissipating to form dense molecular clouds, then their star formation timescales will be long.
Conversely, it may appear puzzling that star formation has terminated in the majority of high mass galaxies, because the hierarchical model claims that these systems were assembled relatively late. In order to explain the observations, star formation must have been both efficient and rapid in the progenitors of these systems, so that the final stages of their assembly involved rather little dissipation or star formation. In current models, galaxies that fall into groups and clusters are stripped of their reservoir of gas. As a result, their star formation rates decline and their colours redden (see for example Diaferio et al 2001). This is unlikely to explain why the majority of massive galaxies do not form stars at the present day, because many do not reside in rich groups and clusters. In such systems, gas must somehow be prevented from cooling and forming stars after the bulge has formed. Again, the suppressed cooling at the centres of observed galaxy clusters may offer a clue to the mechanism responsible for this.
Finally, it will be important to understand the physical origin of the characteristic mass scale that is so strikingly imprinted on the galaxy population. The structural properties and formation paths of dark matter halos vary smoothly with mass. The abrupt transition in the stellar ages, star formation histories and structure of galaxies that we find at can only be explained by star formation and/or feedback processes. We believe that this tension between simplified phenomenological models of galaxy evolution and the trends seen in the data will lead to new insight into the physical processes that regulate how galaxies form and evolve. We intend to address these issues in more detail in future work.
We thank David Weinberg for helpful discussions and comments. We also thank the anonymous referee for comments that helped improve the paper. S.C. thanks the Alexander von Humboldt Foundation, the Federal Ministry of Education and Research, and the Programme for Investment in the Future (ZIP) of the German Government for their support.
The Sloan Digital Sky Survey (SDSS) is a joint project of The University of Chicago, Fermilab, the Institute for Advanced Study, the Japan Participation Group, The Johns Hopkins University, Los Alamos National Laboratory, the Max-Planck-Institute for Astronomy (MPIA), the Max-Planck-Institute for Astrophysics (MPA), New Mexico State University, Princeton University, the United States Naval Observatory, and the University of Washington. Apache Point Observatory, site of the SDSS telescopes, is operated by the Astrophysical Research Consortium (ARC).
Funding for the project has been provided by the Alfred P. Sloan Foundation, the SDSS member institutions, the National Aeronautics and Space Administration, the National Science Foundation, the U.S. Department of Energy, the Japanese Monbukagakusho, and the Max Planck Society. The SDSS Web site is http://www.sdss.org/.


References
Balogh, M.L., Morris, S.L., Yee, H.K.C., Carlberg, R.G., Ellingson, E., 1999, ApJ, 527, 54
Balogh, M.L., Christlein, D., Zabludoff, A.I., Zaritsky, D., 2001, ApJ, 557, 117
Barnes, J., Efstathiou, G., 1987, ApJ, 319, 575
Bell, E.F, & de Jong, R.S., 2000, MNRAS, 312, 497
Bell, E.F., de Jong, R.S., 2001, ApJ, 550, 212
Blanton, M.R., Dalcanton, J., Eisenstein, D., Loveday, J., Strauss, M.A., SubbaRao, M., Weinberg, D.H., Andersen, J.E. et al., 2001, AJ, 121, 2358
Blanton, M.R., Brinkmann, J., Csabai, I., Doi, M., Eisenstein, D., Fukugita, M., Gunn, J.E., Hogg, D.W., Schlegel, D.J., 2002, AJ, submitted
Bohringer, H., Belsole, E., Kennea, J., Matsuhita, K., Molendi, S., Worrall, D.M., Mushotzsky, R.F., Ehle, M. et al., 2001, A&A, 365, L181
Boselli, A., Gavazzi, G., Donas, J., Scodeggio, M., 2001, AJ, 121, 753
Bruzual, A.G., Charlot, S., 1993, ApJ, 405, 538
Bruzual, A.G., Charlot, S., 2002, in preparation
Christlein, D., 2000, ApJ, 545, 145
Cole, S., Aragon-Salamanca, A., Frenk, C.S., Navarro, J.F., Zepf, S.E., 1994, MNRAS, 271, 781
Cole, S., Lacey, C., 1996, MNRAS, 281, 716
de Blok, W.J.G., van der Hulst, J.M., Bothun, G.D., 1995, MNRAS, 274, 235
de Blok, W.J.G., McGaugh, S.S., van der Hulst, J.M., 1996, MNRAS, 283, 18
de Jong, R.S., Lacey, C., 2000, ApJ, 545, 781
Diaferio, A., Kauffmann, G., Balogh, M.L., White, S.D.M., Schade, D., Ellingson, E., 2001, MNRAS, 328, 726
Efstathiou, G., 2000, MNRAS, 317, 697
Fabian, A.C., Mushotzsky, R.F., Nulsen, P.E.J., Peterson, J.R., 2001, MNRAS, 321, L20
Fall, S.M., Efstathiou, G., 1980, MNRAS, 193, 189
Fukugita, M., Ichikawa, T., Gunn, J.E., Doi, M., Shimasaku, K., Schneider, D.P., 1996, AJ, 111, 1748
Grebel, E.K., 2000, Proc. 33rd ESLAB Symposium, ESA SP-445, eds.F.Favata, A.A.Kaas & Wilson (Noordwijk:ESA), 87-98 (astro-ph/0005296)
Gunn, J.E., Carr, M., Rockosi, C., Sekiguchi, M., Berry, K., Elms, B., de Haas, E., Ivezic, Z. et al, 1998, AJ, 116, 3040
Hogg, D.W., Finkbeiner, D.P., Schlegel, D.J., Gunn, J.E., 2001, AJ, 122, 2129
Hubble, E.P., 1926, ApJ, 64, 321
Kauffmann, G., White, S.D.M., Guiderdoni, B., 1993, MNRAS, 264, 201
Kauffmann, G., Heckman, T.M., White, S.D.M., Charlot, S., Tremonti, C., Peng, E.W., Seibert, M., Bernardi, M. et al. 2002, MNRAS, submitted (Paper I)
Kennicutt, R.C., 1983, ApJ, 272, 54
Kennicutt, R.C., 1998, ARA&A, 36, 189
Kroupa, P., 2001, MNRAS, 322, 231
Kuntschner, H., Lucey, J.R., Smith, R.J., Hudson, M.J., Davies, R.L., 2001, MNRAS, 323, 615
Lemson, G., Kauffmann, G., 1999, MNRAS, 302, 111
Lin, H., Kirshner, R.P., Shectman, S.A., Landy, S.D., Oemler, A., Tucker, D.L., Schechter, P.L., 1996, ApJ, 464, 60
Loveday, J., Peterson, B.A., Efstathiou, G., Maddox, S.J., 1992, ApJ, 390,338
Marzke, R.O., Geller, M.J., Huchra, J.P., Corwin, H.G., 1994, AJ, 108, 437
Marzke, R.O., Da Costa, L.N., Pellegrini, P.S., Willmer, C.N.A., Geller, M.J., 1998, ApJ, 503,617
McKee, C.F., Ostriker, J.P., 1977, ApJ, 218, 148
Mo, H.J., Mao, S., White, S.D.M., 1998, MNRAS, 295, 319
Papovich, C., Dickinson, M., Ferguson, H.C., 2001. ApJ, 559, 620
Pettini, M., Shapley, A.E., Steidel, C.C., Cuby, J.G., Dickinson, M., Moorwood, A.F.M., Adelberger, K.L., Giavalisco., M., 2001, ApJ, 554, 981
Pier, J.R. et al., 2002, AJ, submitted
Roberts, M.S. & Haynes, M.P., 1994, ARA&A, 32, 115
Shapley, A.E., Steidel, C.C., Adelberger, K.L., Dickinson, M., Giavalisco., M., Pettini, M., 2001, ApJ, 562, 95
Shimasaku, K., Fukugita, M., Doi, M., Hamabe, M., Ichikawa, T., Okamura, S., Sekiguchi, M., Yasuda, N. et al, 2001, AJ, 122, 1238
Smith, J.A., Tucker, D.L., Kent, S., Richmond, M.W., Fukugita, M., Ichikawa, T., Ichikawa, S.I.,Jorgensen, A.M. et al. 2002, AJ, in press
Steidel, C.C., Adelberger, K.L., Giavalisco, M., Dicksinson, M., Pettini, M., 1999, ApJ, 519, 1
Stoughton, C., Lupton, R.H., Bernardi, M., Blanton, M.R., Burles, S., Castander, F.J., Connolly, A.J., Eisenstein, D.J. et al., 2002, AJ, 123, 485
Strauss, M.A., Weinberg, D.H., Lupton, R.H., Narayanan, V.K., Annis, J., Bernardi, M., Blanton, M., Burles, S. et al, 2002, AJ, submitted
Strateva, I., Ivezic, Z., Knapp, G.R., Narayanan, V.K., Strauss, M.A., Gunn, J.E., Lupton, R.H., Schelger, D. et al, 2001, AJ, 122, 1861
Syer, D., Mao, S., Mo, H.J., 1999, MNRAS, 305, 357
Thompson, R.I., Weymann, R.J., Storrie-Lombardi, L.J., 2001, ApJ, 546, 694
Trager, S.C., Worthey, G., Faber, S.M., Burstein, D., Gonzalez, J.J., 1998, ApJS, 116, 1
Tremonti, C.A. et al., 2003, in preparation
Warren, M.S., Quinn, P.J., Salmon, J.K., Zurek, W.H., 1992, ApJ, 399, 405
White, S.D.M., Frenk, C.S., 1991, ApJ, 379, 52
Wong, T., Blitz, L., 2002, ApJ, 569, 157
Worthey, G., Ottaviani, D.L., 1997, ApJS, 111, 377
York D.G., Adelman J., Anderson J.E., Anderson S.F., Annis J., Bahcall N.A., Bakken J.A., Barkhouser R. et al., 2000, AJ, 120, 1579
Zucca, E., Zamorani, G., Vettolani, G., Cappi, A., Merighi, R., Mignoli, M., Stirpe, G.M., MacGillivray, H. et al., 1997, A&A, 326, 477