The faint end of the galaxy luminosity function
Abstract
We present and discuss optical measurements of the faint end of the galaxy luminosity function down to in five different local environments of varying galaxy density and morphological content. The environments we studied, in order of decreasing galaxy density, are the Virgo Cluster, the NGC 1407 Group, the Coma I Group, the Leo Group and the NGC 1023 Group. Our results come from a deep wide-angle survey with the NAOJ Subaru 8 m Telescope on Mauna Kea and are sensitive down to very faint surface-brightness levels. Galaxies were identified as group or cluster members on the basis of their surface brightness and morphology. The faintest galaxies in our sample have . There were thousands of fainter galaxies but we cannot distinguish cluster members from background galaxies at these faint limits so do not attempt to determine a luminosity function fainter than .
In all cases, there are far fewer dwarfs than the numbers of low mass halos anticipated by cold dark matter theory. The mean logarithmic slope of the luminosity function between and is , far shallower than the cold dark matter mass function slope of . We would therefore need to be missing about 90 per cent of the dwarfs at the faint end of our sample in all the environments we study to achieve consistency with CDM theory. It is unlikely that such large numbers of dwarfs are missed because (i) the data is deep enough that we are sensitive to very low surface brightness galaxies, and (ii) the seeing is good enough that we can have some confidence in our ability to distinguish high surface brightness dwarfs from background galaxies brighter than . One caveat is that we miss compact members taken to be background galaxies, but such objects (like M32) are thought to be rare.
keywords:
galaxies: photometry – galaxies: clusters: individual: Virgo – galaxies: clusters: individual: NGC 1407 Group – galaxies: clusters: individual: Leo Group – galaxies: clusters: individual: Coma I Group – galaxies: clusters: individual: NGC 1023 Group – galaxies: luminosity function – galaxies: mass function1 Introduction
The galaxy luminosity function (LF) defined as the number density of galaxies per unit luminosity , is a useful description of the galaxy content of any particular environment because it can be straightforward to measure. It is closely related to the galaxy mass function, one of the most important parameters in galaxy formation models.
The galaxy LF has been determined accurately down to absolute red magnitudes (approximate absolute blue magnitudes ) in a wide variety of environments ranging from rich clusters (Lugger 1986; Oegerle & Hoessel 1989; Secker 1996; Lobo et al. 1997; Smith, Driver & Phillipps 1997; Trentham 1998 and references therein; Boyce et al. 2001) to the field (Lin et al. 1996; Ellis et al. 1996; Cowie et al. 1996; Blanton et al. 2001; Cole et al. 2001).
Fainter than , the LF is only known in a handful of environments. Three observational problems are relevant. Firstly, spectroscopic redshifts are difficult to obtain for all but the very nearest low-luminosity (dwarf) galaxies since they have low surface brightnesses (see e.g. Kambas et al. 2000), which means that it is difficult to establish their distances and hence luminosities. Secondly, low-luminosity galaxies are rare in any magnitude-limited sample relative to more luminous background galaxies so that even when we can determine distances to low-luminosity galaxies, say by deep spectroscopy (e.g. Cowie et al. 1996), Poisson counting errors are large. Thirdly, very rich clusters of galaxies like the Coma Cluster, where there are enough galaxies that Poisson statistics are manageable, are too distant for absolute magnitudes to be reached and for individual galaxies to be unambiguously identified as cluster, not background, galaxies. These problems are gradually being overcome with the advent of wide-field mosaic CCDs on large telescopes. Luminosity functions have been measured in the nearby dense elliptical-rich Virgo (Sandage, Binggeli & Tammann 1985; Phillipps et al. 1998; Trentham & Hodgkin 2002) and diffuse spiral-rich Ursa Major (Trentham, Tully & Verheijen 2001a, hereafter TTV) clusters, at distances of Mpc. Low-luminosity cluster members were identified on the basis of their low surface brightnesses and morphologies in these studies (see Flint et al. 2001b). The other place with a well-established and complete LF that probes this faint is the Local Group (van den Bergh 1992, 2000), where galaxies resolve into individual stars and distances can be determined from color-magnitude diagrams. Most of these studies suggest luminosity functions with logarithmic faint-end slopes .
|
-
∗
These are the designations given in the Nearby Galaxies Catalog (Tully 1988: hereafter NBG catalog).
Cold dark matter (CDM) theory, which has been so successful at predicting many properties of galaxies and their large-scale distribution (e.g. Jenkins et al. 1998; Fontana et al. 1999; Katz, Hernquist & Weinberg 1999; Kauffmann et al, 1999) leads to the expectation that there should be many low mass halos (Klypin et al. 1999). Small systems form earlier and as time evolves, collapse occurs at progressively larger scales. Small halos merge into larger units, but many low mass halos survive. The percentage of mass remaining in small systems is not large but there still should be many dwarfs for each giant galaxy, far more than are observed in the Local Group given the masses of M31 and the Milky Way (Klypin et al. 1999; Moore et al. 1999).
The logarithmic slope of the low-mass end of the CDM mass function is close to , an expectation that can be derived analytically from a CDM fluctuation spectrum (Press & Schechter 1974) and is confirmed by N-body studies cited above. Although the jury is still out, we submit that this anticipated mass function is steeper than the observed luminosity function in any environment. If the CDM theory is correct, then the formation of stars in low-mass dark halos is subject to disruption. There could be local feedback effects (Dekel & Silk 1986; Efstathiou 2000) or cosmological effects like the reionization of the Universe inhibiting the collapse of gas into small halos (Klypin et al. 1999; Bullock, Kravtsov & Weinberg 2000, Tully et al. 2002). The result could be very different dark halo and galaxy mass functions, as found in the simulations of Chiu, Gnedin & Ostriker (2001).
A more subtle variation of luminosity function (LF) with environment has been noticed by various authors (Zabludoff & Mulchaey 2000; Christlein 2000; Balogh et al. 2001; Tully et al. 2002). The LF might be slightly steeper in environments with higher galaxy density. However in all cases, including the densest clusters, the LF appears to be far shallower than the mass function predicted from CDM theory. Tully et al. (2002) argue how reionization of the Universe, inhibiting the collapse of gas into small halos, can simultaneously explain the discrepacy with CDM theory and this environmental dependence.
At present, very few regions have been explored to faint levels , so the assertions made in the last three paragraphs are based on somewhat limited information. We now complement our earlier observations of the Ursa Major Cluster with observations of five other environments having various galaxy density. Environments with a substantial range of crossing-times (an indicator of the galaxy density) are studied; the most extreme examples are the Virgo Cluster (which has a crossing time far shorter than a Hubble time) and the NGC 1023 Group (which has a crossing time of half a Hubble time). With the Suprime-Cam mosaic camera on the NAOJ Subaru 8 m Telescope, low surface brightness galaxies can be reliably detected as faint as over a sq. deg. field with our 12 min integrations.
2 Sample
From the previous section, it would seem useful to study environments with as wide a range of galaxy densities (or dynamical crossing times) as possible. The sample clusters are listed in Table 1. In increasing order of dynamical time, these are
Virgo Cluster: The Virgo Cluster is an elliptical-rich cluster of galaxies at a distance of 17 Mpc. Its velocity dispersion is high ( km s-1) and its crossing time is less than one-tenth of a Hubble time, meaning that its galaxies have undergone many galaxy-galaxy interactions. It has a substantial population of low-luminosity dwarf spheroidal, or dwarf elliptical, galaxies (Sandage et al. 1985; see also further studies by Impey, Bothun & Malin 1988, Phillipps et al. 1998, and Trentham & Hodgkin 2002).
Projection issues. Histograms of measured velocities in the direction of the Virgo Cluster are given in the top pair of panels in Figure 1. The galaxy distribution in a patch in supergalactic coordinates on a side is shown in Figure 2.
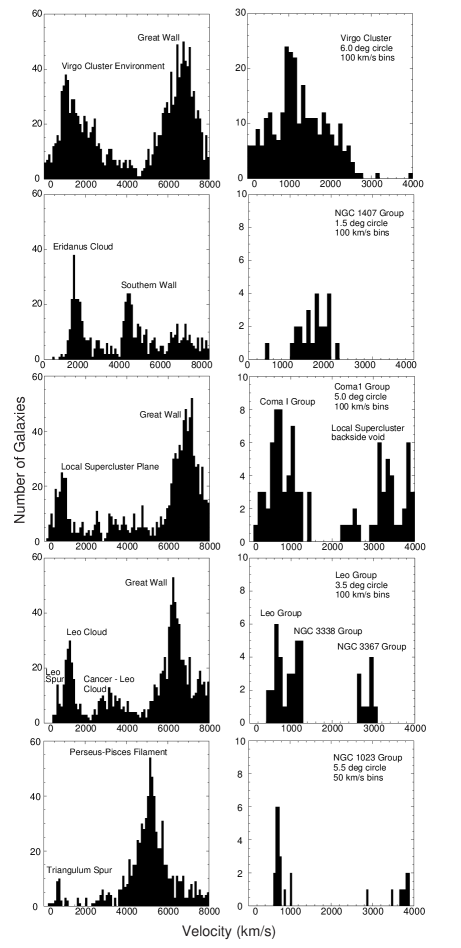

For the purposes of this experiment, the Virgo Cluster survey region should be reasonably clean. There is little doubt that there are local galaxies external to the cluster but seen in projection against the cluster. Projected galaxies within the Local Supercluster cannot be distinguished by velocity since legitimate members of the cluster have velocities in the range km s-1 (the negative velocity cases are not included in Fig. 1). Most prominently, there is the Virgo W Cluster (11-24 in the Nearby Galaxies [NBG] catalog of Tully 1988), most of the open symbols in the lower left corner of Fig. 2. This cluster with km s-1 is at roughly twice the Virgo Cluster distance. Almost surely, some galaxies indicated by filled symbols but near the Virgo W direction are associated with this more distant structure. Likewise, there are other small groups such as Virgo W′ (de Vaucouleurs 1961; 11-5 in the NBG catalog) and Virgo M (Ftaclas, Fanelli, & Struble 1984; 13+12 in the NBG catalog) that are within of M87 but suspected to be times more distant than the cluster. Most of the suspected contaminants lie below the straight line segments at and in Fig. 2.
Beyond the confines of the Local Supercluster, the contamination concerns in the Virgo region are minimal. Space is quite empty of galaxies in this direction for km s-1. The Great Wall is seen at km s-1 but it is seen from the distribution of crosses in Fig. 2 that galaxies in this velocity range tend to lie below the and line segments. The region of the present survey with the Subaru Telescope lies above these lines, within the small centrally located rectangle. In the following discussion, in addition to the new Subaru material, we will make use of the ‘VCC’ sample of Binggeli et al. (1995), but only that part of the VCC sample that lies within the solid irregular boundary defined in Fig. 2.
The density of dwarfs in the Virgo survey region is much higher than in any of the other areas observed in the present program. There is some chance of contamination from projected structures in the Local Supercluster but (a) no specific structure has been suspected in the direction of the Subaru fields and (b) contamination would surely contribute only a tiny fraction of the unusually large numbers of dwarfs seen in this part of the sky.
NGC 1407 Group: This group is a modest knot of E/S0 galaxies suspected to have a large value (Gould, 1993; (Quintana, Fouqué & Way 1994; Tully & Shaya 1999). It contains only two galaxies, with NGC 1407 the brightest. The rest of its members are lower-luminosity early-type galaxies with a group velocity dispersion of 385 km s-1. The second-ranked galaxy, NGC 1400, is blueshifted with respect to the group by 1066 km s-1. The group has a high mass-to-light ratio M⊙/L⊙ where Mpc is the assumed distance. The characteristic group crossing time is more than an order of magnitude less than the age of the Universe so that the group may be considered virialized.
Projection issues. The NGC 1407 Group presents the cleanest case within the present sample. Histograms of velocities in the vicinity are seen in Figure 1 and the projected distribution of galaxies in a square region in supergalactic coordinates is shown in Figure 3. There is a large void behind the NGC 1407 Group extending to the so-called Southern Wall at 4000 km s-1. The only real concern is the separation of the group from the Eridanus Cloud, the filament which contains the group. Other components of this larger scale structure would be at roughly the same distance. There could be dispute over the exact boundary of the NGC 1407 Group but the luminosity function to be constructed will pertain to a small area near the centre of the group and removed from known structures outside the group.

Coma I Group: The Coma I Group is composed of galaxies of mixed morphology. There is a core dominated by E/S0/Sa systems and a more extended region with a substantial admixture of later types. The demarcation between these regimes is not well defined and no precise specification of the group will be attempted here. Nonetheless, the presence of a compact nest of early type galaxies with a moderately large velocity dispersion of km s-1 clearly indicates the existence of an evolved structure.
Projection issues. The familiar velocity histograms are shown in Figure 1 and Figure 4 is a map of the projected galaxies in a square region in supergalactic coordinates. The background to the Coma I Group is relatively clean. There are only minor filaments beyond km s-1 until the Great Wall at km s-1. The problem in the case of this group is the foreground and the complex immediate vicinity. This group roughly projects onto the zero velocity shell of the Virgo Cluster infall region. Galaxies over a considerable range of distances could have similar velocities near km s-1. Estimates of distances in the region have shown large scatter (compare Jacoby et al. 1996, Turner et al. 1998, Tonry et al. 2001). Filaments that emanate from the Virgo Cluster diverge in this region toward the Ursa Major Cluster and toward our local filament. There are galaxies associated with the foreground 14-7 (Canes Venatici I) Group closely adjacent the Coma I Group and probably several galaxies are directly projected, judging from their resolution into stars. Some of the dwarf candidates found in this survey could be foreground of Coma I. Velocity information would not suffice to confirm group membership. Observations that resolve stellar populations are required.

Leo Group: At a distance of only 11 Mpc, the Leo Group is the closest high density E/S0 knot. There are only 3 galaxies in the group. Compared with the two groups above, it has a far lower velocity dispersion of km s-1 and lower mass-to-light ratio. Current indications (Flint, Bolte & Mendes de Oliveira 2001a) are that it does not possess large numbers of low-luminosity galaxies.
Projection issues. The usual velocity histograms are given in Figure 1 and a map of the area in Figure 5. In the intermediate background, km s-1 extending to the Great Wall, the situation is clean in this region. There is modest potential confusion from a filament at 3000 km s-1 which contains a group around NGC 3367 (32-4 in the NBG catalog) directly in the line-of-sight of the Leo Group.

The biggest problem in this case results from the fact that the Leo Group, like the Coma I Group, lies near the zero velocity infall shell centred on the Virgo Cluster. Galaxies over an extended distance range have similar velocities. Two filaments converge in velocity space in the vicinity of the Leo Group, though they are separated in distance. A group around NGC 3338 (21-5 in the NBG catalog) overlaps the Leo Group on the sky but is thought to be almost twice as far away. In the terminology of the NBG catalog, this background group is part of the Leo Cloud while our Leo Group is part of a structure called the Leo Spur. There is a detailed description of this region in the appendix in Tully (1987).
NGC 1023 Group: The NGC 1023 Group is a well-formed group of spirals, with one S0 galaxy. The group is tighter than most spiral groups, which is why we select it for observing convenience, but the dispersion in velocities is an extremely low 52 km s-1 so the crossing time is long. This group, like the Local Group and the Ursa Major Cluster, is probably not virialized.
Projection issues. Figures 1 and 6 provide the usual histograms of velocities and map of projected positions of galaxies within 8000 km s-1. This case is relatively clean. There is a big empty region at km s-1 foreground of the Perseus-Pisces filament. The background filament avoids the specific region surveyed here. The velocity dispersion of the NGC 1023 Group is very low which makes velocity a good discriminant of membership. It is suspected that two galaxies at km s-1 are slightly to the background (though part of the same Triangulum Spur). One of these lies in the Subaru survey field. The NGC 1023 Group dominates over the minor structure at km s-1 so contamination is expected to be insignificant.

3 Observations and data reduction
Images were taken in fields that covered the rectangular regions in Figures 2 to 6 and seen more clearly in figures in Section 6. Observations were made in the -band filter on the night of 23 January 2001 (UT) with the 8.2 m NAOJ Subaru Telescope on Mauna Kea. The median seeing was 0.8 arcseconds FWHM. We used the Suprime–Cam mosaic camera, a mosaic of nine operational 4K 2K CCDs (scale 0.2 arcsec pix-1) (for more details see http://subarutelescope.org/). The total area surveyed is presented in Table 1.
Each field was imaged for 360 seconds. Subsequent exposures were progressively shifted by slightly less than one half–field diameter. Hence, most parts of the sky along the major and minor axes were imaged twice. With this strategy, the projection of camera gaps or flaws shifts between exposures so that almost all parts of the sky were imaged at least once. A few parts were imaged three times, and a few parts, at the extremeties of the survey areas, only once. For objects at the extremeties, there was therefore the danger that in that single exposure they fell in a gap or on a damaged part of a CCD. This happened once to our knowledge, with the galaxy VCC 681 in the Virgo Cluster, but in terms of the overall survey area, the amount of area lost this way is less than 1% and is negligible.
All images were bias-subtracted (the dark current was negligible) and flat-fielded using twilight sky flats. Instrumental magnitudes were computed from observations of standard stars, and the photometry was again converted to the Cousins magnitude system of Landolt (1992). Conditions were judged to be photometric from consistency in the zero-points derived from exposures of different standard stars and from consistency between the magnitudes of stars in adjacent half-fields. The uncertainty in the photometric zero-points were about 2%; these are not a significant source of error in the final magnitudes that we quote.
4 Sample selection
Our general strategy for selecting dwarf galaxy candidate members for these groups is outlined in TTV. The basic idea is that dwarf galaxies have low surface-brightness (e.g. Binggeli 1994) and consequently larger sizes and less concentrated light profiles than background galaxies of the same apparent magnitude. So we compile a sample of galaxies in each group with low surface brightness. We then assess the plausibility of each galaxy being a member based on various considerations. For each group we eventually then have a sample of galaxies, each with a rating that reflects our assessment of the likelihood that it is a member. The following steps summarize our analysis (see TTV for more details):
|
|
|
|
|
|
1) For galaxies in our images, we define an inner concentration parameter based on aperture magnitudes:
and an outer concentration parameter:
Both the ICP and OCP are more negative for lower surface-brightness galaxies, and are close to zero for stars since the seeing was always much less than 2.2 arcsec (the seeing was always good enough that its effect on the concentration parameters for all of the galaxies that we consider here was negligible). These concentration parameters characterize the light distribution on physical scales between about 0.1 kpc and 1 kpc. A sample of galaxies is now constructed having ,
and
or and
These conditions were chosen so that all the local dwarf galaxies in Figure 1 of Binggeli (1994) would be selected if they were placed in the groups we study. Galaxies having concentration parameters this negative are rare in offset background fields (see Fig. 2 of TTV). The reason why we do not use the OCP to select the faintest galaxies is that many small background galaxies have companions and consequently very negative measured OCPs. If we included these then our sample would then become unmanageably large, dominated by these objects.
2) We then inspected each object in the catalogue and removed (i) grand-design luminous spirals with very negative concentration parameters due to star formation in spiral arms at large distance from the galaxy centre, (ii) merging galaxies with no well-defined centre that consequently had very negative concentration parameters whereas the individual components did not, (iii) objects with very negative concentration parameters due to a companion star or galaxy projected close to it in the sky, (iv) extremely flat smooth edge-on galaxies which are likely to be background, and (v) low surface-brightness material that seems to be debris or ejecta associated with a nearby giant galaxy. Many objects could easily be excluded on these grounds. A few objects are less straightforward to exclude as background objects since they may show some of these signatures at a low level; these are the objects that we categorize “2” or “3” later in this section and discuss individually in Section 4.
3) Of the objects remaining in our list at this stage, we were somewhat more confident about the membership possibilities of some than others. We therefore introduce the following subjective rating scheme, based on our own assessment. Candidates are characterized “0” to “4”, where “0”: membership confirmed from optical spectroscopic or HI data; “1”: probable member, but no spectroscopic or HI detection in the literature; “2”: possibly a member, but conceivably background; “3”: probably background, but conceivably a member; “4”: almost certainly background given the properties of the background fields studied in TTV. Our judgments are based primarily on the ICP and OCP values, the morphological criteria (i) through (v) listed above, and where in the group or cluster the galaxy is located (we were more reluctant to assign ratings of “1” to galaxies if they lay in regions of overlap with other structures in the sky).
Our methods of identifying members a priori bias us towards selecting a particular kind of galaxy – normal dwarf galaxies. By far most local dwarfs are normal dwarf spheroidals or dwarf irregulars (Binggeli 1994), so we expect these methods to be on the whole successful. There are, however, two kinds of objects that we would miss: (i) extreme low surface-brightness galaxies, with central surface-brightnesses below 28 mag arcsec-2. No such galaxies are known in the Local Group or anywhere else (but they would be very difficult to find if they exist) (ii) galaxies with smooth de Vaucouleurs light profiles but moderate to high surface brightness. In the distance range of our groups, objects of this class with are identified by wide field redshift surveys. Elliptical galaxies that lie along the fundamental plane at fainter magnitudes have high central surface brightnesses (Kormendy & Djorgovski 1989), whence would not be found by our procedures. Small, high surface brightness galaxies that disperse from the fundamental plane are known to exist, such as one in our Ursa Major Survey: the emission-line galaxy Markarian 1460 (Trentham, Tully & Verheijen 2001b). This galaxy failed to satisfy the ICP and OCP limit specifications very substantially, but is a known cluster member based on optical spectroscopy (Pustilnik et al. 1999) and on an HI detection (Verheijen et al. 2000). These high surface-brightness low-luminosity galaxies are likely to be rare, however. The only one in the Local Group out of the 35 or so galaxies with is M32.
5 Photometry
We computed total apparent magnitudes for galaxies in our sample as follows. First, we measured the aperture magnitude within some large radius. This radius was different for each galaxy and was chosen as a compromise between the distance at which the galaxy falls below the sky and the distance to the nearest adjacent object. Second, we corrected this aperture magnitude for contamination by background galaxies and foreground stars that fell within it. Third, we fitted an exponential profile (see the discussion in Section 5 of Tully et al. 1996) over some radius range where the light of the galaxy was not contaminated by neigbouring objects or by star-forming knots within the galaxy. Fourth, we converted from aperture to total magnitudes by integrating the light profiles resulting from this fit from our original aperture radius to infinity. These aperture corrections were rarely more than 0.5 magnitudes.
This method worked well for the majority of the galaxies in our sample. It did not work well in the following cases:
(1) luminous galaxies with saturated cores. For these we used literature data (Poulain 1988 for the two most luminous Virgo ellipticals NGC 4406 and NGC 4374; the compilation of Prugniel & Heraudeau 1998 for all the others) to derive the total magnitudes. Where no -band literature were available we assume negligible colour gradient and set , where is a 2-dimensional region of the galaxy that is not saturated in our images and for which literature data exists in filter .
(2) small galaxies (typically the faintest ones in our sample rated “3”), where the exponential fit in (iii) above is poor. For these we assume is equal to the aperture magnitude within some large radius.
(3) galaxies in the presence of a strongly varying sky background, say because they are in the halo of a very luminous galaxy like NGC 4406. The reason the method fails here is that the fitting procedure is very sensitive to the details of sky subtraction. Our method here was also to use (large) aperture magnitudes, where we made an estimate of the underlying sky from the profile of the luminous galaxy.
(4) galaxies with very close companions, where we can never measure meaningful aperture magnitudes in a circular aperture at all due to contamination from the companion. In these cases we identified a symmetry axis and measured an aperture magnitude using a rectangular aperture placed on the opposite side of the symmetry axis from the companion and then divided the result by the fraction of the area of the object contained within this aperture to get the total flux.
For luminous galaxies of Hubble Type Sa–m, we made additional inclination-dependent corrections to to take into account light lost to dust obscuration, adopting the prescription of Tully et al. (1998).
We then converted apparent magnitudes to absolute magnitude using the equation
where is the distance to the group or cluster (see Table 1 – in all cases these were determined from surface-brightness fluctuations; Tonry et al. 2001) and is the Galactic extinction (which we obtained from the maps of Schlegel, Finkbeiner & Davis 1998).
6 Results
6.1 Virgo
Galaxies found in the Subaru Suprime-Cam survey that are probably/possibly members of the Virgo Cluster are identified in Table 2. There we list: ID: The galaxy identification number in our catalogue Name: The galaxy name, if catalogued previously, taken from the NASA/IPAC Extragalactic Database. The VCC numbers represent Virgo Cluster Catalog (Binggeli, Sandage & Tammann 1985) entries. The VPC numbers represent Virgo Photometric Catalog (Young & Currie 1998) entries. Type: The galaxy type, as inferred from the morphology in our images. For the brightest galaxies, which were saturated in our images, we used the VCC listings. The notation is: E = elliptical; S0 = lenticular; Sa-m = spiral of increasing late type; dE = dwarf elliptical (alternatively called dwarf spheroidal); dE,N = nucleated dwarf elliptical; dI = dwarf irregular; “VLSB” indicates the presence of a halo with very low surface brightness : heliocentric velocity. Rating: Our assessment of membership probability 0–3, defined as in Section 4. : Total R apparent magnitude (J2000): Right Ascension (J2000): Declination R(6): -band magnitude in an aperture of radius 6 arcseconds. This could not be measured for saturated galaxies. ICP: Inner concentration parameter, defined as in Section 4. Not measured for saturated galaxies or if no adequate coverage of galaxies within 6 arcseconds of the edge or a chip defect. OCP: Inner concentration parameter, defined as in Section 4. Not measured for saturated galaxies or if no adequate coverage of galaxies within 12 arcseconds of the edge or a chip defect. If a galaxy had a close companion its measured OCP value tends to be very negative. MR: Absolute -band magnitude.
Most of the low-luminosity galaxies in the sample are dwarf spheroidal, or dwarf elliptical galaxies. Many of these are nucleated. At the lowest luminosities we study (), the fraction of dwarf galaxies that are dwarf irregulars might be higher, although most of these faint galaxies were rated “3” and are suspected background galaxies.
We only found one galaxy rated 0–2 with , whereas 10 such galaxies were found with . The possibility is raised of a very steep turnover in the Virgo Cluster LF at . More likely, however, this absence of ratings at the faintest magnitudes is due to a combination of selection effects. Figure 7 provides a series of images of simulated and observed galaxies only slightly brighter than our faintness limit. The dynamic range in central surface brightness over which we would identify Virgo dwarfs and rate them “1” or “2” is small at these faint magnitudes. High surface-brightness dwarfs we would rate “3” or even “4” (such objects are indistinguishable from background galaxies, which are far more common). Dwarfs with low central surface brightnesses (fainter than 28 mag arcsec-2) will not be detected at all. We therefore only rate dwarfs with central surface brightnesses very close to 27 mag arcsec-2 as “1” or “2”.
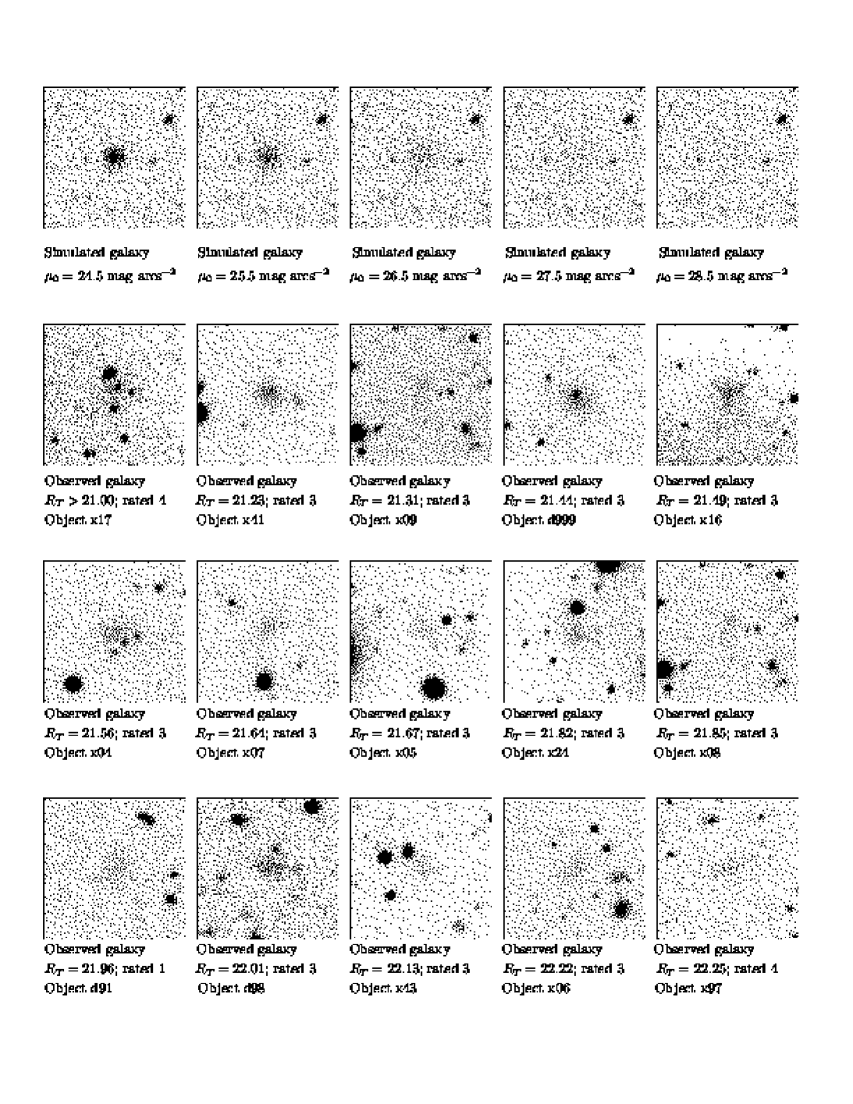
An enlarged view of the survey area in the Virgo Cluster is presented in Figure 8. Our observing strategy described in Section 3 was designed to cover a contiguous area of the sky and areas in the gaps between the CCDs in one exposure were normally imaged in a different exposure. The only places in the sky where this is not true are at the east and west extremities of the easternmost and westernmost fields we studied. One galaxy which might be a member (VCC 681; Binggeli et al. 1985) was missed this way even though its position on the sky is within the survey area in Fig. 8. A small number of lower luminosity galaxies might also have been lost.

The Virgo Cluster luminosity function is presented in Figure 9. It is based on an amalgam of two datasets. The faint end is derived from the observations described in this paper, but the current sample is only substantial at . The bright end of the luminosity function was well established by Sandage, Binggeli, & Tammann (1985) based on the material of the VCC. However two problems had to be confronted before the two datasets could be directly compared: first, the VCC photometry is in band while our photometry is at , and second, while the VCC covers most of the cluster our field covers only a modest fraction.
While obviously it would be best if observations were all in the same passband, the interband transformation we will propose should be adequate for present purposes, appreciating that data is binned in the relatively crude intervals of one to two magnitudes. The transformation draws on a sample of 350 galaxies with and photometry (Tully & Pierce 2000 supplemented with additional unpublished data). The correlation between colour and type is shown in Figure 10. The linear fit superposed on the data is described by the equation
| (1) |
where is the usual numeric type with a twist: stands for types S0/a through the spiral types to Im but is S0 and is E. The relation is used to transform VCC magnitudes into magnitudes.

The second problem of linkage between luminosity functions acquired in distinct fields is a recurrent problem that arises both in attempts to connect bright end and faint end samples and with comparisons between different groups. We will describe our not fully satisfactory solution. It is seen in the Virgo Cluster (Fig. 2), and will be seen in the other groups, that the Subaru survey fields are restricted to the central, presumably densest, part of the cluster. We need to account for the radial gradient in the distribution of galaxies since the bright end luminosity function averages over the entire cluster which is less dense in the mean than the central region.
Our solution is to normalize the luminosity function to the surface density of luminous galaxies (). The relative surface density of the bright and faint samples are matched at 200 kpc from the centre of the cluster. We take the following steps.
1) The projected centre of the cluster must be defined. In the case of the Virgo Cluster, there are several sub-groupings in the projected distribution of galaxies but among these there is a dominant one in the central region. The distribution of galaxies is best seen with the VCC sample. The cluster centre was taken by eye to be at , . In the case of the Virgo Cluster, the choice of centre is not a sensitive parameter because the central density gradient is shallow.
2) The projected density of luminous galaxies () with respect to the cluster centre is plotted as seen in Figure 11. This magnitude limit is chosen because the bright end samples for all the groups and clusters studied in this paper are complete to this limit, a consideration when we come to intercompare environments. A least squares fit is made to the density gradient. This fit allows one to read off the projected density at 200 kpc from the cluster centre. The conversion from angular to metric distance assumes the distance to the cluster given in Table 1.

3) The projected density of dwarfs () found in the Subaru survey field is superimposed on the radial density plot. A fit to the dwarf sample is forced to have the same slope found for the bright (‘giant’) sample; ie, the only free parameter is the zero point. Hence we establish an offset between the ‘giant’ and ‘dwarf’ samples.
4) In all the other 4 groups studied here, we require the dwarf-to-giant offset established in the above manner to link the separately constructed bright and faint ends of the luminosity functions. This procedure will be described with the discussion of these groups. In the case of the Virgo Cluster, fortunately, there is a significant overlap in magnitude domain between the complete VCC sample and the new Subaru observations. In this special case, the bright and faint samples could be matched in the overlap domain . As a consequence, among the groups in this study, the full luminosity function over all magnitudes is most robustly established for the Virgo Cluster.
The bright end Virgo Cluster sample risks a problem of contamination at the most negative values of . It was pointed out in section 2 that the background Virgo W, W′, and M groups are projected onto the cluster. For purposes of building the bright end luminosity function in the Virgo Cluster we only considered galaxies within the irregular outline enclosed by the radius circle seen in Fig. 2. The straight line segments at negative were chosen to excise the areas known to contain contaminants within the velocity range of the cluster. The steplike boundaries at more positive are the boundaries of the VCC survey. The included area is roughly 50% of the area within the outline. We assume that the luminosity function provided by this half of the cluster is representative of the whole. The density normalization is unaffected by the restriction to half the cluster. The fit of the dwarf and giant samples to a common normalization is unaffected because the fit only depends on a relative scaling in the overlap domain.
The curvature in the full Virgo luminosity function seen in Fig. 9 is deemed to be real, whether or not candidates rated ‘3’ are considered. A power-law provides a poor fit over any appreciable magnitude range so a standard Schechter function fit (Schechter 1976) with a faint end slope parameter does not provide a satisfactory description. We find a significantly less steep faint-end slope than Phillipps et al. (1988). Their value of is not consistent with our data. The Phillipps et al. (1998) sample may be contamination by background galaxies. Our data extend significantly deeper in surface brightness and integrated magnitude so we should see any candidates that they see.
The solid curve superimposed on the Virgo Cluster data in Fig. 9 is seen to provide a reasonable fit. Based on the ensemble of luminosity function data at our disposition, we perceived that while a Schechter function provides a poor representation of the data, a variant does a good job. We need an expression that allows for inflection at mid luminosities and flattening toward fainter magnitudes. We have chosen an expression of the following form:
| (2) | |||||
The second term on the right hand side resembles the Schechter function except that the exponential cutoff parameter, , is descriptive of the fractional population of dwarfs rather than the entire population. The two other parameters of this term are , which describes the faint end slope, and , which provides a normalization. The contribution by giant galaxies is described by the first term on the right hand side, a gaussian with a characteristic peak magnitude, , a dispersion, , and a normalization, . Hence there are 6 free parameters rather than the 3 of the Schechter formalism so it is not surprising that we get a good fit. The bright end gaussian is characterized by peak magnitude and dispersion mag. The faint end Schechter function is characterized by and . Normalizations are given in Table 1 along with the reduced of the fit.
This splitting of the luminosity function into a Gaussian part for giant galaxies and a Schechter formulation for dwarf galaxies has been performed previously by Ferguson & Sandage (1991). Their methodology is somewhat different from ours – they classify galaxies as giants or dwarfs based on their morphology and then fit functions to the LF of each rather than fit a composite function to the total LF – yet they obtain similar results: for the dwarfs they found and , converting to our distance scale and to the filter using equation (1). The value of derived from these fits is very unstable to parameter coupling with (). Nevertheless we can still infer from the similarity in the two values of that our LF and the photographic LF of Virgo used by Ferguson & Sandage (1991) are not wildly different. We are not uncovering vast numbers of dwarfs they were missing despite the very substantial extra depth in surface brightness provided by the Subaru observations.

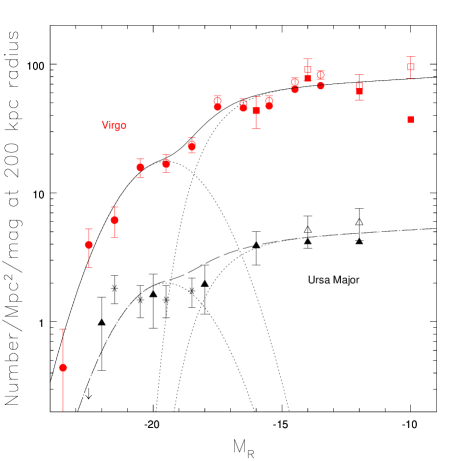
The data from the survey of the Ursa Major Cluster by TTV is also plotted in Fig. 9. The bright end of the luminosity function is derived from a cluster sample complete in areal coverage at (Tully et al. 1996). The extension to the faint end is provided by the random coverage of 13% of the cluster by TTV. The absolute scale is set by the radial distribution of the bright sample from the cluster centre (which is very flat in this case so not sensitive to the choice of the centre). A surface density of 8 galaxies Mpc-2 is found at a radius of 200 kpc. The relative normalization of the TTV sample is obtained by least squares matching of the complete and TTV samples at .
The Ursa Major samples are much smaller than those pertaining to Virgo. If we allow ourselves the 6 degrees of freedom provided by our 2 component analytic luminosity function we can get an excellent fit. However, use of this large number of degrees of freedom is not warranted by the quality of the data. Instead, in the interests of intercomparing the luminosity functions for different groups, we set 4 of the parameters to be the same as found in the Virgo Cluster fit: , , , . Only the normalizations provided by and are allowed as free parameters. The best fit is shown in Fig. 9 and seen to be satisfactory. Normalizations and of the fit are recorded in Table 1. The Ursa Major luminosity function has a much reduced dwarf component in comparison with the Virgo case.
A useful parameter to describe the overall shape of the LF is the dwarf-to-giant ratio, which we define as . The details of the calculation of this ratio require (a) the adjustment for the limited areal coverage of the Subaru survey fields that is incorporated in the radial density plots (Fig. 11 and succeeding figures of this sort), and (b) the offset of the dwarfs from the giants in the radial density plots. In the plots that are shown, all dwarfs with and membership ratings are included. Our dwarf-to-giant parameter incorporates the lower magnitude limit that is within the completion limits of all the groups and we consider only membership ratings .
In the case of the Virgo Cluster we derive . The Ursa Major Cluster is a special case because there is no well defined centre but on the other hand a much larger fraction of the cluster was observed to faint limits (with CFHT rather than Subaru Telescope). Though not determined in quite the same way, we found in Ursa Major. These values of are included in Table 1.
The agreement between the current data and the wide-field sample of Trentham & Hodgkin (2002) at the faint end is encouraging. It appears that the (far less-deep) INT data is not heavily incomplete at low luminosities because many low surface-brightness galaxies exist that are missing from the sample. The indication is that the INT Virgo Cluster LF, with its small Poisson errors, is an accurate representation of the LF in evolved environments down to .
From Table 2, it appears that the vast majority of galaxies brighter than are members of the VCC. It is therefore not surprising that at magnitudes brighter than we find a LF that is flat or gradually rising, a similar result to that found by Sandage et al (1985).
6.2 NGC 1407 Group
The NGC 1407 Group sample is listed in Table 3. Designations “FS90” refer to the compilation of Ferguson & Sandage (1990). Galaxies d20 and d74 fell on a diffraction spike of a bright star in the only images in which they existed so we are unable to provide and values of the concentration parameters for these. The distribution of the sample on the sky is seen in Figure 12.
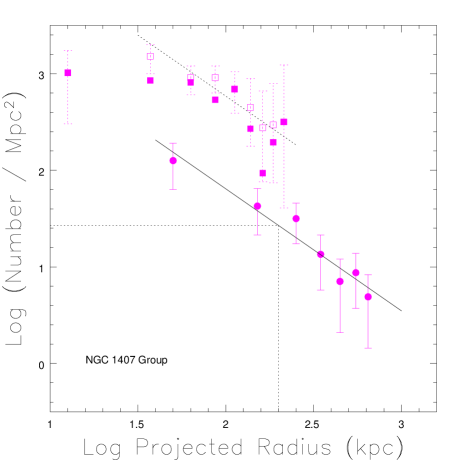
The group centre is taken from the centroid of the dwarfs to be at , . The radial distributions of full bright end and dwarf faint end samples is seen in Figure 13. The fall off with radius is much steeper in this small group than in either Virgo or Ursa Major. The projected density of galaxies with at 200 kpc is 27 galaxies Mpc-2.
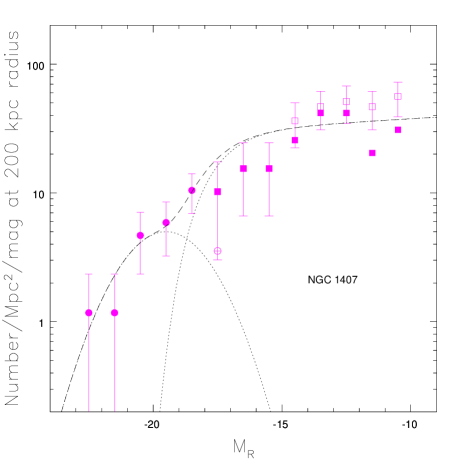
The luminosity function is presented in Figure 14. Again, it is the composite of separate bright end and faint end constructions. The bright end is derived from literature magnitudes (inhomogeneous sources) transformed to band through equation (1) and is complete only for . This data is not the best but the bins are large. The faint end is derived from the Subaru data of this study. Because of the limited field coverage, the faint sample is restricted to . Hence there is no overlap between the bright and faint end samples. The normalization is achieved through the offset between dwarf and giant samples seen in Fig. 13. This normalization is not secure, particularly since the dwarfs might be clustered in sub-regions within the group. The dynamical time in the NGC 1407 Group is a small fraction of the Hubble time so the problem might be minimal in this case.
While the relative vertical normalizations of the bright and faint samples are somewhat uncertain, the faint end sample can be considered alone. It is seen to become quite flat at , the details depending on the status of the candidates rated ‘3’. As with the Ursa Major Cluster, an excellent fit could be found with the two component analytic luminosity function with all 6 parameters free, but already an acceptable fit can be found with only the two normalization parameters left free, all other parameters being set equal to the Virgo Cluster values. This latter fit is shown in Fig. 14. At the faint end, the fit is constrained by the average of the rating and samples. Normalizations are given in Table 1.
The d/g ratio for galaxies rated 0–2. The NGC 1407 Group, like the Virgo Cluster, is a dynamically evolved region. Both have giant galaxy populations composed mainly of elliptical galaxies. Both have dwarf galaxy populations that are predominanly dE and dE,N galaxies.
6.3 Coma I

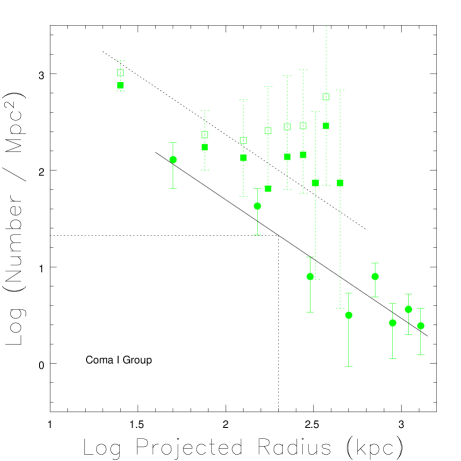
The Coma I Group sample is listed in Table 4 and the projection on the sky shown in Figure 15. The radial distribution around the centroid of the dwarfs at , is seen in Figure 16. The normalization given at a radius of 200 kpc is reasonably established at 21 giants Mpc-2. However the radial distribution of the dwarfs is not so well behaved. Perhaps there is sub-clumping of the dwarfs but the coverage provided by the Subaru fields is insufficient to evaluate this possibility.
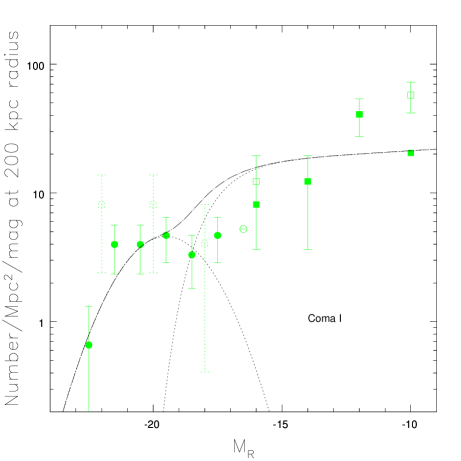
The luminosity function is presented in Figure 17. The bright end is established by a sample drawn from the entire cluster and complete for , with the proviso that the magnitudes come from the transform from band. The luminosity function is quite flat from to then drops precipitously (similar in this respect to the Ursa Major Cluster). The faint end is poorly defined with only 16 galaxies in the interval . There is no magnitude overlap between the bright and faint samples so the relative normalization comes from the scaling achieved through Fig. 16. In this Coma I case, the scaling is more poorly defined than it was with the NGC 1407 Group. Only the two amplitude normalization parameters to the analytic fit are left free. The best fit is represented by the curves in Fig. 17.
The d/g ratio for the Coma I Group is . for galaxies rated 0–2.
6.4 Leo

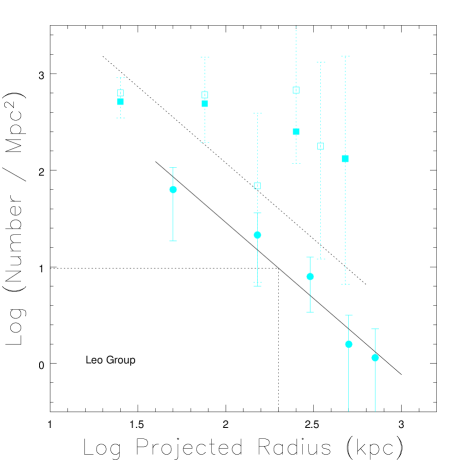
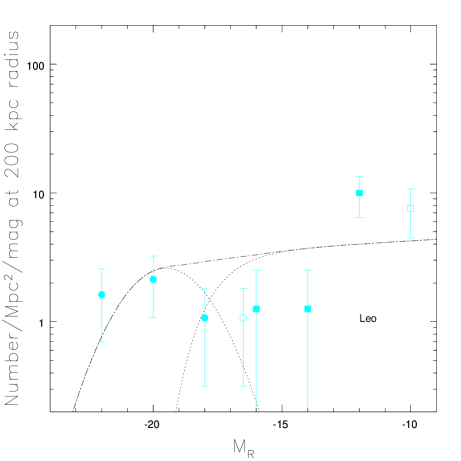
The Leo Group sample is listed in Table 5 and the galaxy distribution on the sky is seen in Figure 18. Again the “FS90” designations refer to the compilation of Ferguson & Sandage (1990). Our survey reaches fainter absolute magnitudes in this group than in the other environments since it is closer. The group centroid is taken to be at , but it is poorly defined. In this one instance, the Subaru survey field is significantly offset since the group centroid is taken to be near one end of the rectangular survey region. The radial gradiant from this centroid is seen in Figure 19. The gradient in luminous galaxies () is acceptable defined, with the density at 200 kpc equal to 10 giants Mpc-2. However the dwarf offset is poorly defined. There is a knot of dwarfs around NGC 3371/3379 and a suggestion of sub-clumping around NGC 3377 which could bring the radial gradient analysis into question.
The luminosity function is presented in Figure 20 and it is especially flat in this case. Whether anything should be made of this claim can be questioned because the normalization between bright and faint samples is especially tenuous in this case. The bright end sample is comfortably complete above but conversion was required from to magnitudes and there are only 9 galaxies in the bright end sample. In the faint end sample derived from the Subaru survey fields there are only 10 systems with . There is a hint that these few dwarfs are clumped near the bright galaxies. In sum, the normalization between bright and faint samples is quite unreliable. An analytic luminosity function fit has been made to the data by optimizing the two amplitude parameters. The fit is superimposed on the data in Fig. 20.
The d/g ratio for the Leo Group is for galaxies rated 0–2.
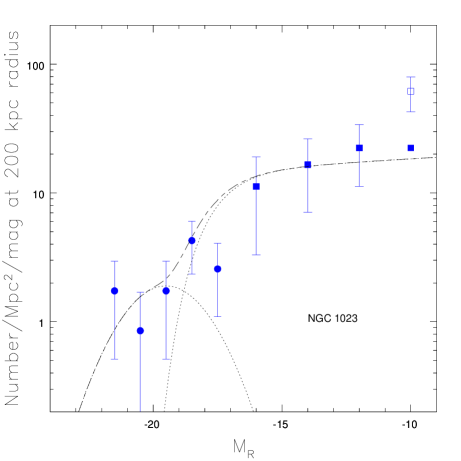
6.5 NGC 1023 Group
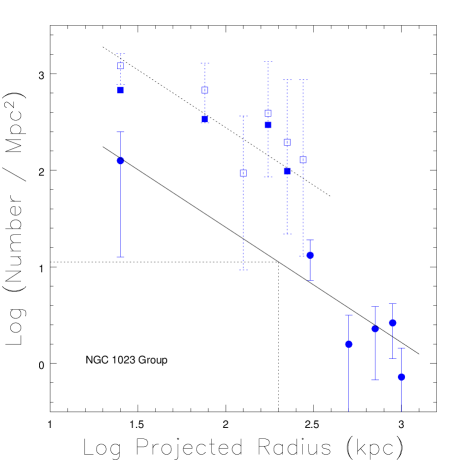
The NGC 1023 Group sample is listed in Table 6 and shown as projected on the sky in Figure 21. Several of the dwarfs are irregulars that have been detected in HI. The group centroid is defined by the distribution of dwarfs to be at , . The radial distributions of giant and dwarf samples from this centre are seen in Figure 22. The density of giants at 200 kpc is 11 per Mpc-2. The luminosity function is presented in Figure 23. Again there is no overlap between the bright end sample, complete for the group at ( magnitudes translated from band observations), and the faint end sample derived from the current observations. The relative normalization is based on the offset between samples seen in Fig. 22. This offset might appear to be reasonably well defined but the dwarfs are in close proximity to NGC 1023 and this region may be a special place in the group. If dwarfs are overrepresented due to clumping around this one galaxy then the faint sample normalization is too high. At any rate, the usual two parameter optimization of the analytic formalism leads to the fit shown by the curves in Fig. 23.
The d/g ratio is particularly uncertain in the case of the NGC 1023 Group because the denominator is small and the numerator may be inflated if the dwarfs are strongly clumped around NGC 1023. For the record, we find

7 Discussion
The analytic luminosity function fits for the five groups that we study here and for the Ursa Major Cluster studied by TTV are presented together in Figure 24. To review, it was only in the case of the Virgo Cluster that all 6 parameters of the analytic function were fit as free variables. Those fitted parameters describe the properties of the luminous galaxies by a characteristic magnitude and dispersion in magnitude and a density amplitude, and describe the properties of the faint galaxies by a bright end cutoff, a faint end slope, and a density amplitude. For all the other groups, we keep 4 of the parameters at the same Virgo values and only allow the giant and dwarf density amplitudes ( and respectively) to vary. Except in the best cases (particularly the Virgo Cluster), these analytic fits are not well constrained. However, in all cases the fits provide an adequate description of the luminosity functions given the quality of the data. We should emphasize the aspects of the fits shown in Fig. 24 that are more and less reliably known.
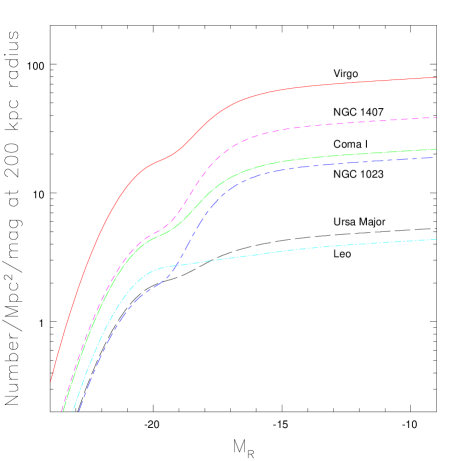
The relative bright end amplitudes are reliably known. The order of magnitude differences in galaxy surface densities are certainly real. Still reliably known, though somewhat less so, are the faint end amplitudes relative to each other. However these faint end amplitudes pertain to the small areas actually surveyed in our study. What is most poorly established is the linkage between the bright and faint end functions. There is the distinct possibility that low mass galaxies are clumped in a way not reflected by the distribution of bright galaxies. For example, the dwarf galaxies may be clumped around the few major systems with large bulges. Our Subaru survey fields were chosen to lie near the centers of the groups so they tend to include the dominant galaxies. The dwarf-to-giant populations in these restricted locales may be overrepresentative of the groups as a whole. The only satisfactory way to resolve this conundrum is to extend a survey with the sensitivity of the present observations in spatial coverage to blanket entire groups. Such a survey will allow the construction of luminosity functions over the entire accessible magnitude range with a homogeneous data set. It should then become evident if the dwarfs are sub-clustered.
At this point it would be unwise to make much of the apparent differences in the dwarf-to-giant normalizations because of the uncertainties that have been discussed. The comparison between the Virgo and Ursa Major clusters seen in Fig. 9 provides the best established hint of a difference (fewer dwarfs per giant in Ursa Major) but even there the evidence is not compelling.
The gross properties of the faint end luminosity functions can reasonably be intercompared across the groups. The groups are near enough that dwarfs as faint as can be detected in all cases. In the details, the statistics per magnitude bin are poor but that statement contains implied information. If there were dwarf galaxies present in the numbers that follow the CDM mass spectrum then the statistics would not be poor. There would be orders of magnitude more candidates.
The faint end normalizations characterized by the parameter can be used to construct a composite luminosity function that makes use of the data accumulated across the six groups. This composite is shown in Figure 25. Only the data from our Subaru and CFHT surveys are included. This faint end component of the data shown in the previous luminosity function figures for the separate groups is combined here by a vertical re-normalization to a common . Then the data is averaged in 2 magnitude bins with weights given by the number of candidates per bin in each group. Error bars reflect the weighted rms dispersions per bin. The luminosity function for candidates with membership probability ratings is represented by filled symbols and the equivalent information for candidates rated is represented by open symbols.

By the faintest bin, a substantial gap has developed between the closed and open symbols in Fig. 25. By the faintest bin, most of the candidates are rated ‘3’, possible members / probable background. Frankly we are not confident in suggesting these objects are ‘probable background’. These candidates cluster less about big galaxies than the objects rated but they cluster to some degree. The implication to us is that a not insignificant fraction of these objects rated 3 are in the groups and a not insignificant fraction are background. The straight line fit seen in Fig. 25 is to the open symbols. This fit describes the situation if the conservative assumption is adopted that all the candidates rated are in the groups in question. If only the candidates rated are group members then the luminosity function rolls over at .
Whether there is a break in the luminosity function at a faint magnitude can only be resolved by observations that clarify the membership status of the faintest candidates. Whether the separate groups have faint end luminosity functions consistent with a universal function or, rather, there are environmental dependencies can only be resolved by observations covering more area on the sky. However the present results do inform us that the faint end of the galaxy luminosity function is not anywhere near as steep as the theoretical CDM mass spectrum of . The fit seen in Fig. 25 has the slope . The slope error is a formal uncertainty consistent with the error bars. Systematic uncertainties associated with membership assignments are larger. However, to reconcile our observations with the slope of the CDM spectrum it would be required that we are missing over 90% of the fainter dwarfs.
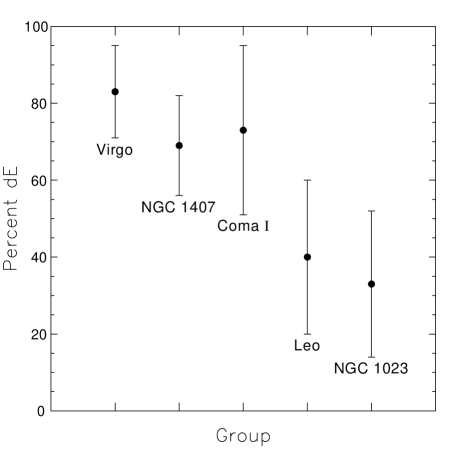
We finish by noting some properties of the dwarfs found in the 5 separate groups studied here. Evidently there is a larger percentage of dwarf ellipticals and relatively fewer dwarf irregulars in the environments inferred to be more dynamically evolved. Figure 26 shows the percentage of dE in each of the groups, ordered from high to low velocity dispersion. It is to be appreciated that there can be considerable ambiguity in the morphological typing in some cases but for present purposes each candidate was forced into either a dE or dI pigeonhole. There do seem to be significant environmental differences.
Among the dE systems, a substantial number have nucleations such that they get classified dE,N. In the magnitude range , fully of dE in the Virgo Cluster have nucleations. In the other 4 groups combined, of dE in the same magnitude interval are nucleated. The statistics are poor but there is no apparent trend in the percentage nucleation in the 4 smaller groups. The difference between the Virgo Cluster and the other 4 groups in this matter of dE nucleation has a significance of .
Acknowledgements
This work is based on data collected at the Subaru Telescope, which is operated by the National Astronomical Observatories of Japan. This research has made use of the NASA/IPAC Extragalactic Database (NED) which is operated by the Jet Propulsion Laboratory, Caltech, under agreement with the National Aeronautics and Space Association. Helpful discussions with Rachel Somerville and Mark Wilkinson are gratefully acknowledged.
References
- [bl] Balogh M., Christlein D., Zabludoff A., Zaritsky D., 2001, ApJ, 557, 117
- [bl] Binggeli B., 1994, in Meylan G., Prugneil P., ed., ESO Conference and Workshop Proceedings No. 49: Dwarf Galaxies. European Space Observatory, Munich, p. 13
- [bl] Binggeli B., Sandage A., Tammann G. A., 1985, AJ, 90, 1681
- [bl] Binggeli B., Sandage A., Tarenghi M., 1984, AJ, 89, 64
- [bl] Blanton M. R. et al., 2001, AJ, 121, 2358
- [bl] Boyce P. J., Phillipps S., Jones J. B., Driver S. P., Smith R. M., Couch W. J., 2001, MNRAS, 328, 277
- [bl] Bullock J. S., Kravstov A. V., Weinberg D. H., 2000, ApJ, 539, 517
- [bl] Chiu W. A., Gnedin N. Y., Ostriker J. P., 2001, ApJ, 563, 21
- [bl] Christlein D., 2000, ApJ, 545, 145
- [bl] Cole S. et al., 2001, MNRAS, 326, 255
- [bl] Cowie L. L., Songaila A., Hu E. M., Cohen J. G., 1996, AJ, 112, 839
- [bl] Dekel, A, Silk, J. 1986, ApJ, 303, 39
- [bl] de Vaucouleurs, G. 1961, ApJS, 6, 218
- [bl] Efstathiou G., 2000, MNRAS, 317, 697
- [bl] Ellis R. S., Colless M., Broadhurst T., Heyl J., Glazebrook K., 1996, MNRAS, 280, 235
- [bl] Ferguson H. C., Sandage A., 1990, AJ, 100, 1
- [bl] Ferguson H. C., Sandage A., 1991, AJ, 101, 765
- [bl] Flint K., Bolte M., Mendes de Oliveira C., 2001a, in de Boer K. S., Dettmar R.-J., Klein U., eds, Dwarf Galaxies and their environment. Shaker Verlag, Aachen, p. 209
- [bl] Flint K., Metevier A. J., Bolte M., Mendes de Oliveira C., 2001b, ApJS, 134, 53
- [bl] Fontana A., Menci N., D’Odorico S., Giallongo E., Poli F., Cristiani S., Moorwood A., Saracco P., 1999, MNRAS, 310, 27
- [bl] Ftaclas C., Fanelli M.N., Struble M.F., 1984, ApJ, 282, 19
- [bl] Gould A. 1993, ApJ, 403, 37
- [bl] Impey C., Bothun G., Malin D., 1988, ApJ, 330, 634
- [bl] Jacoby G.H., Ciardullo R., Harris W.E., 1996, ApJ, 462, 1
- [bl] Jenkins A. et al., 1998, ApJ, 499, 20
- [bl] Kambas A., Davies J. I., Smith R. M., Bianchi S., Haynes J. A., 2000, AJ, 120, 1316
- [bl] Katz N., Hernquist L., Weinberg D. H., 1999, ApJ, 523, 463
- [bl] Kauffmann G., Colberg J. M., Diaferio A., White S. D. M., 1999, MNRAS, 303, 188
- [bl] Klypin A., Kravtsov A., Valenzuela O., Prada F., 1999, ApJ, 522, 82
- [bl] Kormendy J., Djorgovski S., 1989, ARAA, 27, 235
- [bl] Landolt A. U., 1992, AJ, 104, 340
- [bl] Lin H., Kirshner R. P., Shectman S. A., Landy S. D., Oemler A., Tucker D. L., Schechter P. L., 1996, ApJ, 464, 60
- [bl] Lobo C., Biviano A., Durret F., Gerbal D., Le Fèvre O., Mazure A., Slezak E., 1997, A&A, 317, 385
- [bl] Lugger P., 1986, ApJ, 303, 535
- [bl] Moore, B., Ghigna, S., Governato, F., Lake, G., Quinn, T., Stadel, J., & Tozzi, P. 1999, ApJ, 524, L19
- [bl] Oegerle W. R., Hoessel J. G., 1989, AJ, 98, 1523
- [bl] Phillipps S., Parker Q. A., Schwartzenberg J. M., Jones J. B., 1998, ApJ, 493, L59
- [bl] Prugniel P., Heraudeau P., 1998, A&AS, 128, 299
- [bl] Poulain P., 1988, A&AS, 72, 215
- [bl] Press W. H., Schechter P., 1974, ApJ, 187, 425
- [bl] Pustilnik S., Engles D., Ugryumov V., Lipovetsky V. A., Hagen H. J., Kniazev A. Y., Izotov Y. I., Richter G., 1999, A&AS, 137, 299
- [bl] Quintana H., Fouqué P., Way M. J., 1994, A&A, 283, 722
- [bl] Sandage A., Binggeli B., Tammann G. A., 1985, AJ, 90, 1759
- [bl] Schechter, P.L. 1976, ApJ, 203, 297
- [bl] Schlegel D. J., Finkbeiner D. P., Davis M., 1998, ApJ, 500, 525
- [bl] Secker J., 1996, PASP, 108, 550
- [bl] Smith R. M., Driver S. P., Phillipps S., 1997, MNRAS, 287, 415
- [bl] Tonry J. L., Dressler A., Blakeslee J. P., Ajhar E. A., Fletcher A. B., Luppino G. A., Metzger M. R., Moore C. B., 2001, ApJ, 546, 681
- [bl] Trentham N., 1998, in Thuan T.X., Balkowski C., Cayatte V., Tran Thanh Van J., ed., Dwarf Galaxies and Cosmology. Editions Frontières, Gyf-sur-Yvette, p. 11
- [bl] Trentham N., Hodgkin S., 2002, MNRAS, in press (astro-ph/02202437)
- [bl] Trentham N., Tully R. B., Verheijen M. A. W., 2001a, MNRAS, 325, 385 (TTV)
- [bl] Trentham N., Tully R. B., Verheijen M. A. W., 2001b, MNRAS, 325, 1275
- [bl] Tully R. B., 1987, ApJ, 321, 280
- [bl] Tully R. B., 1988, Nearby Galaxies Catalog, Cambridge University Press (NBG catalog)
- [bl] Tully R. B., Pierce M. J., 2000, ApJ, 533, 744
- [bl] Tully R. B., Pierce M. J., Huang J.-S., Saunders W., Verheijen N. A. W., Witchalls P. L., 1998, AJ. 115, 2264
- [bl] Tully R. B., Somerville R. S., Trentham N., Verheijen M. A. W., 2002, ApJ, in press (astro-ph/0107538)
- [bl] Tully R. B., Shaya E. J., 1999 in Banday A. J., Sheth R. K., da Costa L. N., eds, Evolution of large scale structure: from recombination to Garching. ESO, Munich, p. 296
- [bl] Tully R. B., Verheijen M. A. W., Pierce M. J., Huang J. -S., Wainscoat R. J., 1996, AJ, 112, 2471
- [bl] Turner A. et al., 1998, ApJ, 505, 207
- [bl] van den Bergh S., 1992, A&A, 264, 75
- [bl] van den Bergh S., 2000, PASP, 112, 529
- [bl] Verheijen M., Trentham N., Tully B., Zwaan M., 2000, in Kraan-Korteweg R. C., Henning P. A., Andernach H., eds, Mapping the Hidden Universe: The Universe Behind the Milky Way - The Universe in HI. ASP, San Francisco, p. 263
- [bl] Young C. K., Currie M. J., 1998, A&AS, 127, 367
- [bl] Zabludoff A. I., Mulchaey J. S., 2000, ApJ, 539, 136