On mode trapping in pulsating DA white dwarf stars
Abstract
The present work is designed to explore the effects of the time-dependent element diffusion on the mode trapping properties of DA white dwarf models with various thickness of the hydrogen envelope. Our predictions are compared with the standard assumption of diffusive equilibrium in the trace element approximation. We find that element diffusion markedly weakens the presence of mode trapping originated in the outer layers of the models, even for the case of thin hydrogen envelopes.
keywords:
stars: evolution - stars: interiors - stars: white dwarfs - stars: oscillations1 Introduction
ZZ Ceti or DAV stars are variable white dwarf (WD) stars with hydrogen-rich envelopes (DA WDs) that become unstable against non-radial (gravity)-modes when they move across the effective temperature () range 12500 K 10700 K. Apart from the fact that these cool WDs pulsate, they are completely normal DA WDs. ZZ Ceti stars exhibit light curves having periodicities in the range of periods s, with low amplitudes ( magnitudes). Because the effects of geometric cancellation on the stellar disk make brightness variations diminish for progressively higher values of the harmonic degree (), all of the observed periods in ZZ Ceti stars correspond to 3 (Dziembowski 1977), being most of them dipolar (= 1) modes. The classical mechanism of overstability acting in the outer layers of hydrogen has been usually invoked as responsible for -modes in ZZ Ceti stars (Dolez & Vauclair 1981; Winget et al. 1982). More recently, Brickhill (1991) and Goldreich & Wu (1999) have proposed the “convective driving mechanism” as being the cause of onset of pulsations in such stars.
The existence of the DAV instability strip111Other hotter instability strips corresponding to degenerate pulsators are those of the DBVs and the DOVs (and PNNVs) stars, which correspond to the ranges 24000 K 22000 K and 170000 K 80000 K, respectively. provides astronomers with an unique opportunity to peer into the internal structure of WDs, which otherwise would remain hidden from observers. In this regard, powerful tools have been developed in recent years taking advantage both of important advances in the observational techniques (Whole Earth Telescope; see Nather et al. 1990) and the WD modeling. As a result, valuable constraints on fundamental quantities such as stellar mass, chemical composition of the core and helium and hydrogen envelope masses have been assessed for several DA WDs (see, e.g. Pfeiffer et al. 1996; Bradley 1998, 2001; Benvenuto et al. 2002).
In spite of the notable success reached in asteroseismological studies of ZZ Ceti stars, some problems in this field remain yet unsolved. One of these problems is to find the reason of why only some modes, amongst all the available ones as predicted by theoretical studies, are observed in real stars. In this regard, notable examples are some DAVs with very few independent periodicities in their intrinsic luminosity variations: G226-29 shows only one period (109.3 s; Kepler, Robinson & Nather 1983); R548 exhibits two periods (213 and 274 s; Stover et al. 1980); G117-B15A and GD 154 pulsate in three periods of 215.2, 271 and 304.4 s (Kepler et al. 1982), and 402.6 s, 1088.6 s and 1186.5 s (Pfeiffer et al. 1996), respectively. Alarmingly, tens of excited eigenmodes are predicted by current non-adiabatic pulsation calculations for DA WD models having structural characteristics corresponding to the above-mentioned stars. In this connection, it has been long suspected that some efficient mechanism of mode filtering must be working in such stars. By means of this mechanism, only some few modes would reach large enough amplitudes for them to be preferentially detected in the light curves.
In a pioneer work, Winget, Van Horn & Hansen (1981) showed that there are certain modes that are “trapped” in the outer hydrogen envelope of stratified WDs. These authors found that a mode is trapped when the local wavelength (or an integer number of it) of its radial eigenfunction nearly matches the thickness of the hydrogen envelope. Such a mode suffers from an efficient reflection at the density change across the hydrogen-helium chemical transition. The mode is thus forced to oscillate with appreciable amplitude only in the low-density region between the stellar surface and that interface. As a result, the amplitude of the trapped mode is notably reduced below the chemical transition region222This picture becomes more complex when transition regions other than the hydrogen-helium interface are present in the interior of star. However, their mode trapping capability is markedly weaker than that of the hydrogen-helium transition (see Brassard et al. 1992ab and Bradley 1996).. Consequently, trapped modes are characterized by low oscillation kinetic energies () and therefore large linear growth rates. In particular, trapped modes with periods close to the thermal time-scale at the base of the driving region would have the largest amplitudes and they would be the preferentially observed ones (Bradley & Winget 1994). This scenario, which has had great acceptance in the WD pulsation community, may help explain in a natural way the scarcity of eigenperiods in the light curves of some ZZ Ceti stars.
Observationally, signatures of mode trapping have been found for various DAVs on the basis of the measured period ratios between the dominant modes, in agreement with the predictions of adiabatic numerical calculations (see Bradley & Winget 1991, Brassard et al. 1992a). However, recent studies cast some doubts on the validity of the mode trapping hypothesis. In particular, seismological fits to the pulsating WD G117-B15A (Bradley 1998, Benvenuto et al. 2002) indicate that the observed period of 215.2 s, which has the larger amplitude in the Fourier spectrum, does not correspond to the trapped mode predicted by the best fitting WD model.
A key ingredient entering the mode trapping studies concerns the modeling of the chemical transition zones. In this regard, we note that in the vast majority of DA WD pulsation studies (Tassoul, Fontaine & Winget 1990; Brassard et al. 1991, 1992ab; Bradley & Winget 1991; Bradley 1996, 1998, 2001), the modeling of the hydrogen-helium interface (the most relevant one in DA white dwarf pulsations) is performed assuming that the abundance profiles in the transition regions are specified by the condition of diffusive equilibrium333On the opposite point of view, in the study of Winget, van Horn & Hansen (1981) the chemical interfaces are treated as true discontinuities., and in most cases the trace element approximation is employed (see Tassoul et al. 1990). An improvement to this situation is the work of Córsico et al. (2001) who have carried out an adiabatic pulsational analysis of DA WD evolutionary models computed in a self-consistent way with the predictions of time-dependent element diffusion, nuclear burning, and the history of the WD (Althaus et al. 2002). As a result of this study, the authors found that, at least for massive hydrogen envelopes and for long periods, the effects of mode trapping in DA WDs are strongly diminished as compared with the situation in which the trace element approximation is employed.
As well known, the theory of stellar evolution predicts massive hydrogen envelopes for DA WDs (Iben & MacDonald 1986; D’Antona & Mazzitelli 1991; Althaus et al. 2002), in agreement with expectations from some seismological studies (Clemens 1994; Bradley 1998, 2001). However, the possible existence of DAVs with thin hydrogen envelopes has been put forward in some cases, such as the ZZ Ceti GD 154 (Pfeiffer et al. 1996). In this regard, we judge it to be worthwhile to extend our exploration of the effects of element diffusion on the trapping properties made in Córsico et al. (2001) to the case of less massive hydrogen envelopes. In contrast to Córsico et al. (2001), we do not attempt here a detailed treatment of the pre-WD evolution. Rather, we obtain our initial models on the basis of an artificial evolutionary procedure. Another aim of this work is to compare our results with the predictions of equilibrium diffusion in the trace element approximation.
The paper is organised as follows. In Section 2 we briefly describe our evolutionary-pulsational code and starting models. In Section 3 we present in detail the pulsational results. Attention is focused mainly on the oscillation kinetic energies and period spacing diagrams. Finally, Section 4 is devoted to summarizing our results.
2 Details of the Computations
For this work we have employed the same pulsational code and physical ingredients as in Córsico & Benvenuto (2002) and Benvenuto et al. (2002). One of the most important aspects of this study concerns the modeling of the chemical abundance distribution. Specifically, we are interested in assessing the effect of diffusion of nuclear species on the shape of the profile of the chemical composition at the chemical transition zones. To this end, we have included in our calculations the various processes responsible for element diffusion. In particular, gravitational settling, chemical and thermal diffusion have been taken into account (Althaus & Benvenuto 2000) following the formulation given by Burgers (1969) for multicomponent plasmas. In our work, the WD evolution is followed in a self-consistent way with the evolution of the chemical abundance distribution as given by time-dependent element diffusion. In this way, we are avoiding the use of the equilibrium diffusion in the trace element approximation usually assumed in most of white dwarf pulsation studies. In this approximation, the transition zone is separated into two parts: an upper one in which one element is dominant and the other is considered as a trace and a lower region in which the role of the respective elements is reversed. Because the solutions are matched for fulfilling the condition of conservation of mass of each element, a discontinuity in the derivative occurs just at the matching point. The resulting profile remains fixed during the whole evolution except only for small changes induced by modification in the ionization state of the plasma.
In our code, evolutionary and pulsational calculations are performed in an automatic way. After selecting a starting stellar model we choose an interval in and . The evolutionary code computes the model cooling until the hot edge of the -interval is reached. Afterwards, the pulsation code searches and computes the whole set of eigenfrequencies within the selected period window. From this stage, the eigensolution for the first model within the -interval is employed as approximate one for the subsequent model and iterated to convergence. This process is repeated for all of the evolutionary models inside the chosen -interval. Note that the search for eigenmodes is performed only once in the whole computational procedure. We refer the reader to Córsico & Benvenuto (2002) and Benvenuto et al. (2002), and references therein for further details about our computational strategy. Let us quote that most of our WD evolutionary models have been divided in about 2000 mesh-points, whereas for mode calculations we employed up to 5000 mesh-points.
As mentioned in the Introduction, we undertake this project to assess the role of element diffusion on the pulsation properties of DAV models with different hydrogen envelopes. Because thin hydrogen envelopes are not predicted by the standard treatment of stellar evolution, we construct the starter models for the computation of the cooling sequences by means of an artificial evolutionary procedure. Specifically, we use the artificial heating technique detailed in Althaus & Benvenuto (2000). Here, the stellar model is forced to undergo an unphysical evolution as a result of introducing an artificial energy release which, after the star become bright enough, is switched off smoothly. The star relaxes then to the physical cooling branch after few tens of models. We have checked that the stellar model converges not only to the physical cooling branch but simultaneously to a correct internal chemical profile. To this end, we employ different shapes of the initial hydrogen and helium profiles at the hydrogen-helium interface. We found that, irrespective of the precise shape of such initial chemical interface, diffusion evolves it to a well defined one far before the star reaches the ZZ Ceti domain. With respect to the hydrogen envelope mass, we elect the following values: = 444We find that models with more massive hydrogen envelopes suffer from hydrogen flashes. So, we consider this value as the upper limit for the hydrogen content. Interestingly, this value is in agreement with what is predicted when an account is made of the evolutionary stages prior to the WD formation (see Althaus et al. 2002)., , , and . Finally, the innermost chemical composition of our models is that of Salaris et al. (1997).
3 Pulsational Results
In this work we have computed adiabatic non-radial -modes with 1, 2, 3, for periods ranging from 100 to 1000 s. In addition, we have obtained the forward period spacing (being the radial order of mode), and the oscillation kinetic energy for each mode, given by:
| (1) |
where and are the stellar mass and the stellar radius respectively, is the gravitation constant, and . , the dimensionless eigenfrecuency, is given by equation , being the eigenfrecuency (). The quantities and are the dimensionless eigenfunctions (see Unno et al. 1989 for their definition).
Pulsational calculations have been performed on 0.6 WD evolutionary models in a range covering the entire observed ZZ Ceti instability strip. The Brunt-Väisälä frequency (), a fundamental quantity entering the non-radial pulsations of WDs, is obtained by employing the “modified Ledoux treatment” as in Brassard et al. (1991), that is
| (2) |
Here, and are the adiabatic and the actual temperature gradients. The Ledoux term , for the case of a multicomponent plasma (M-component plasma), is given by
| (3) |
where
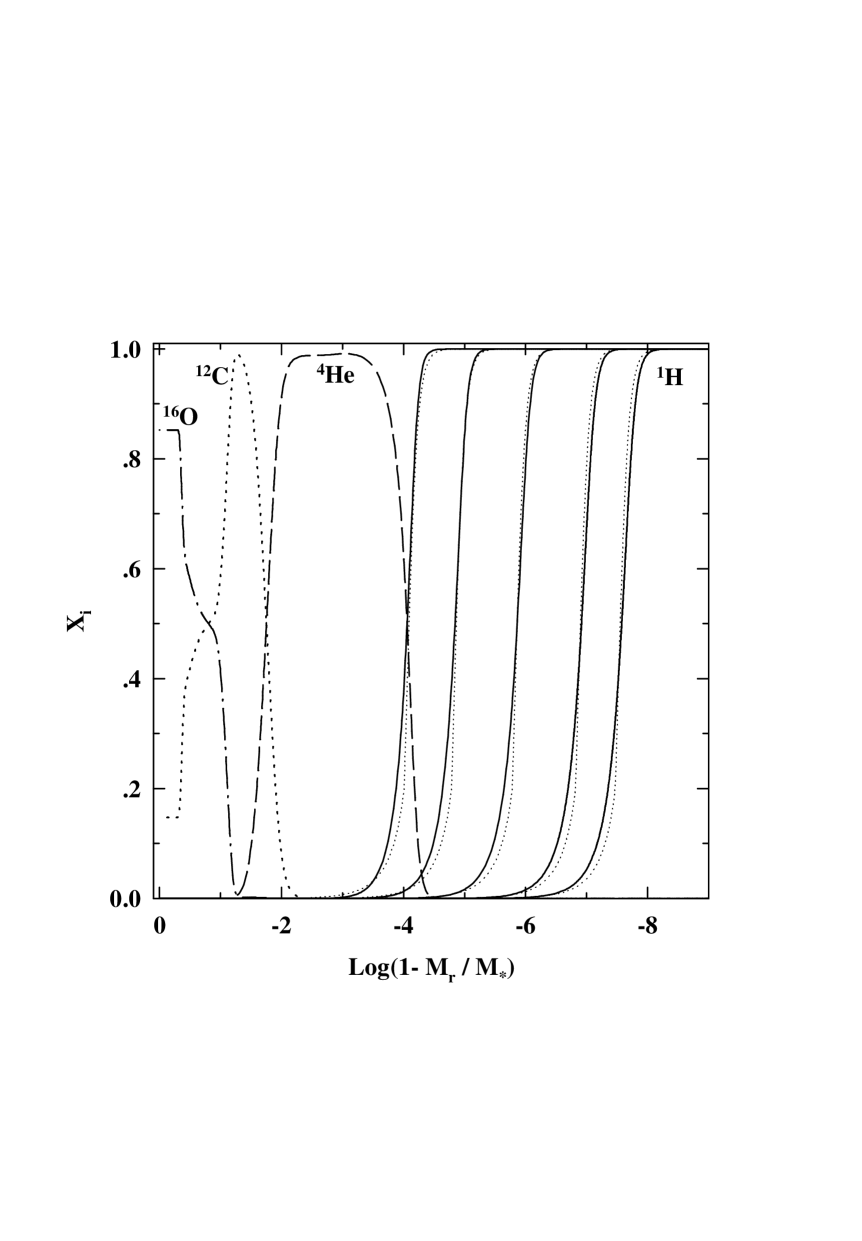
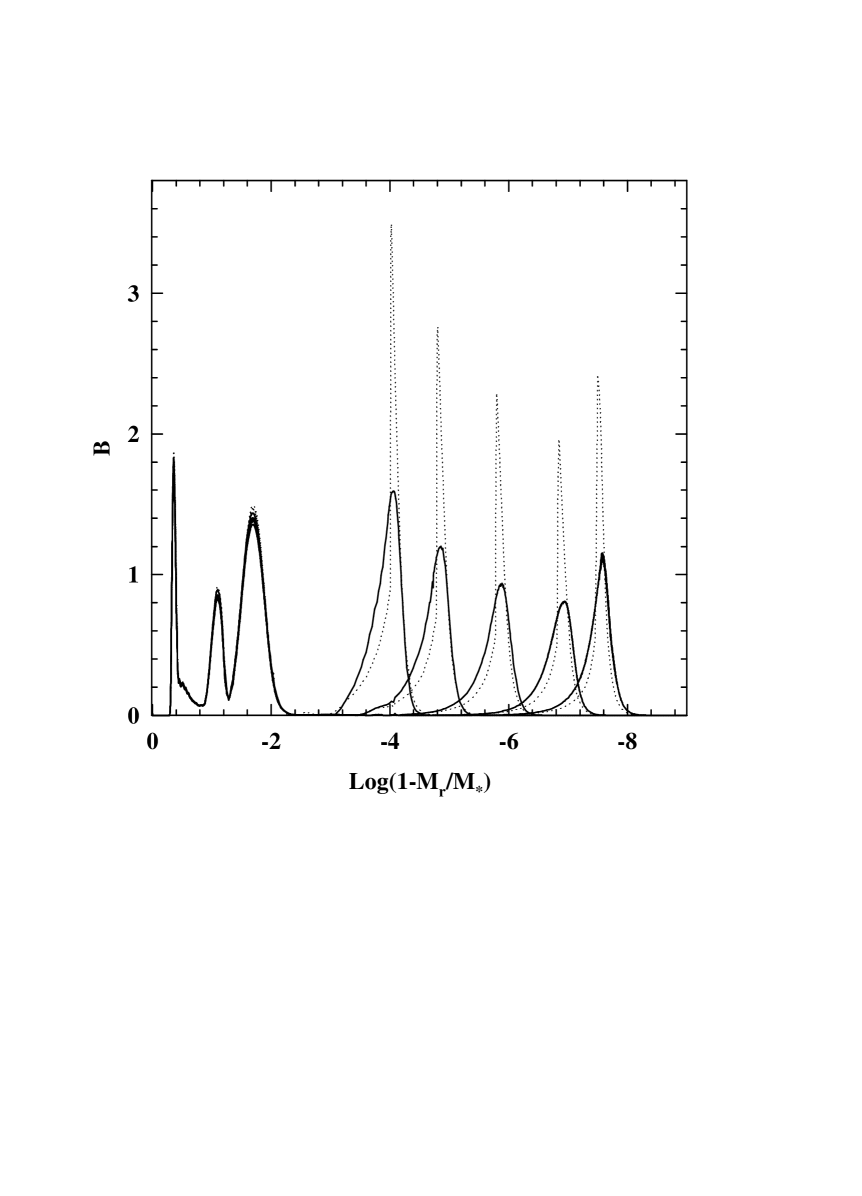
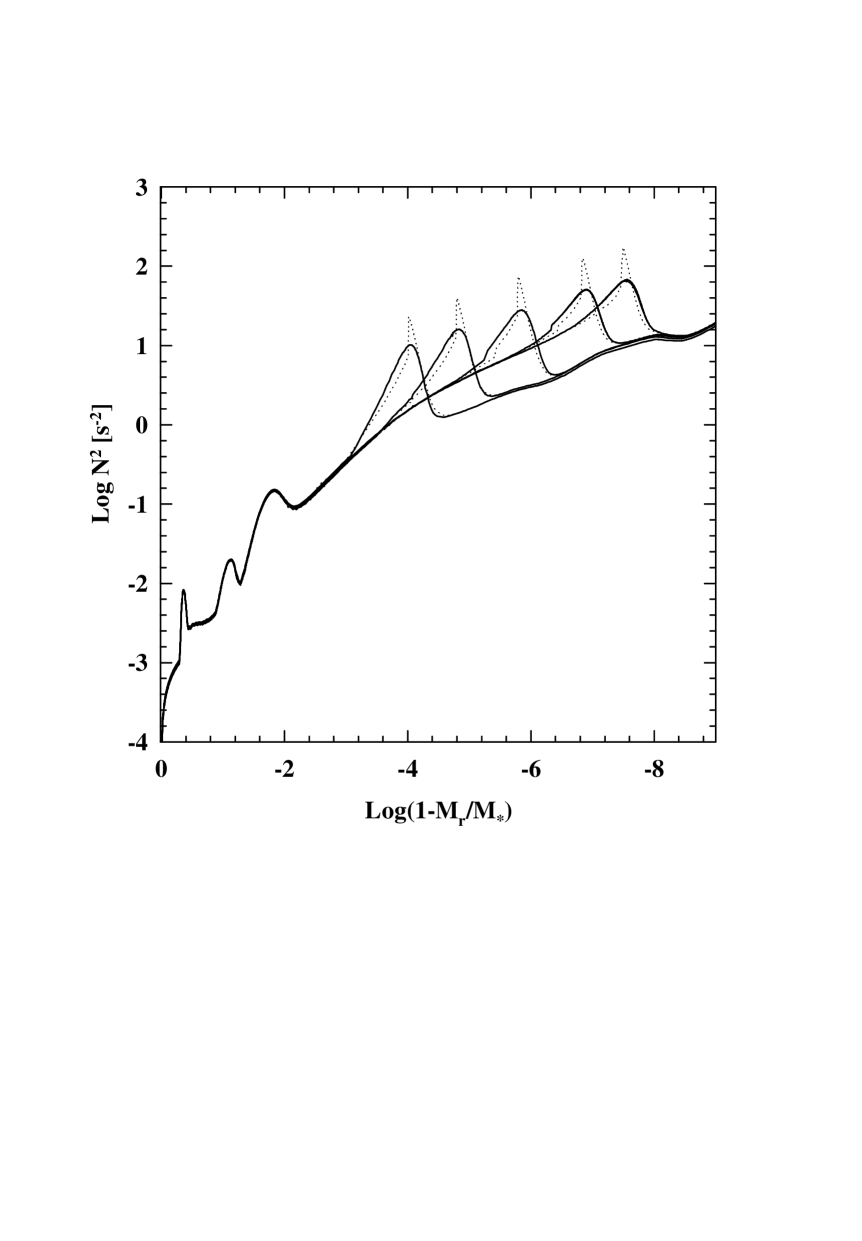
Before entering the discussion of the pulsational results, some words concerning the shape of our chemical profile and the relevant pulsation quantities are in order. To this end we show in Fig. 1 the internal chemical abundance distribution, in Fig. 2 the Ledoux term () and in Fig. 3 the resulting Brunt-Väisälä frequency for WD models at 11800 K for all of the considered values. We also show in these figures the predictions resulting from the use of the diffusive equilibrium in the trace element approximation at the hydrogen-helium transition zone (thin dotted lines). Note the smoothness of the composition at the hydrogen-helium chemical interface resulting from the diffusion processes. This is true even for the case of the thickest hydrogen envelope, because diffusion is operative at the large depths reached by such envelopes. For each considered value, the hydrogen-helium chemical transition gives rise to a marked increase in , which in turn is translated as a smooth bump into the Brunt-Väisälä frequency. In contrast, the trace element approximation yields a strongly peaked feature in the and values at the hydrogen-helium interface. It is important to note that, despite the fact that the condition of diffusive equilibrium is nearly realised at the bottom of our thinnest hydrogen envelopes, the use of the trace element approximation is clearly not an appropriate one even in the case of such envelopes. As a last remark, note that the term exhibits a very pronounced peak at deepest layers, which is a result of the steep growth of carbon abundance from a central constant value of to at . Fig. 3 clearly shows that this peak is further present in the Brunt-Väisälä frequency profile. As we shall see, the presence of this pronounced feature in the Brunt-Väisälä frequency at high density regions has non-negligible consequences for oscillation kinetic energy of certain modes.
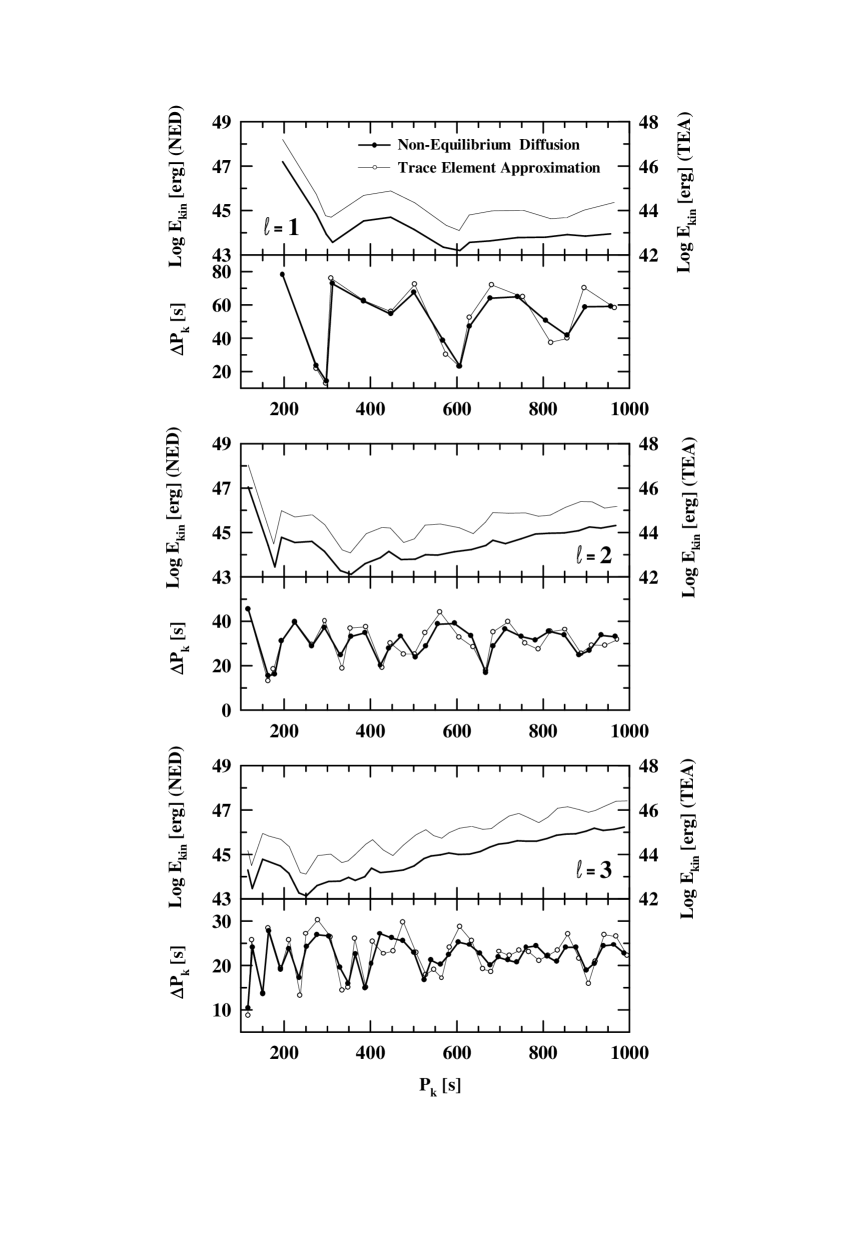
Next, we describe the results of our pulsation calculations. To this end, we concentrate ourselves on the - and - diagrams. As well known, the - relation enables us to infer the presence of trapped modes in the outer layers. In particular, trapped modes correspond to local mimima in the spectrum. In addition, the presence of mode trapping is also inferred through the analysis of the period spacing diagrams (Brassard et al. 1992ab). Here, mode trapping manifests itself in departures from uniformity in the period spacing of consecutive overtones. Specifically, trapped modes correspond to local minima in . This quantitiy is potentially useful to detect trapped modes in the light curves of pulsating WDs. Nonetheless, the evaluation of requires at least two periods with consecutive values to be present in the pulsational pattern; otherwise this quantity remains undefined. Unfortunately, the DAVs show periods with sparsed values, making the employment of almost useless to infer the presence of mode trapping from observations.
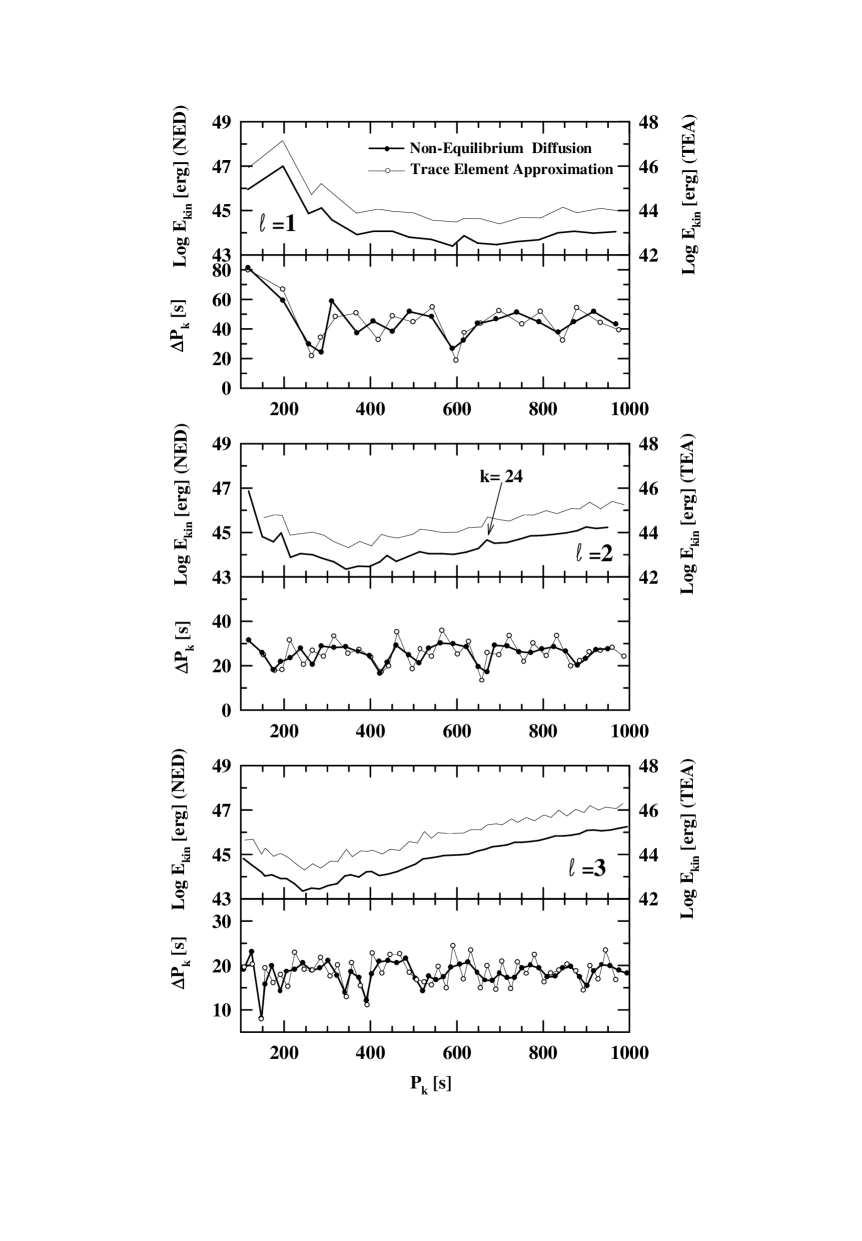
Figs. 4 and 5 depict the - and - diagrams corresponding to the values of and for 1, 2, 3 modes for WD models at 11800 K. The predictions of the time-dependent element diffusion are shown by filled symbols and solid lines, and the expectations from the standard assumption of diffusive equilibrium in the trace element approximation are denoted by empty symbols and thin lines. In the interests of clarity, the scale for the kinetic energy in the case of trace element approximation is displaced upwards by 1 dex. For short periods, the oscillation kinetic energy and period spacing distributions are qualitatively similar for both treatments of diffusion. This is notable in the case of the thin value. The outstanding feature illustrated by these figures is the fact that from a sufficiently high radial order, say ’, and depending on the value, the kinetic energy distribution is quite even when account is made of stellar models with diffusively evolving chemical compositions. This is true even for the thinnest hydrogen envelopes we have analyzed. Note that, particularly for the thin hydrogen envelope, the ’ value becomes smaller as value is increased. As a last remark, we want to comment on the fact that for the thickest hydrogen envelope (see Fig. 4), the uniformity of the kinetic energy distribution (i.e. the absence of appreciable mode trapping signatures) takes place for periods longer than 400 - 500 s irrespective of the value555 A similar result has been found by Córsico et al. (2001) in the frame of full evolutionary calculations that take into account the history of the WD progenitor..
The behaviour quoted in the preceding paragraph is in sharp contrast with the situation encountered for equilibrium diffusion models. In fact, we find that, as a result of the use of the trace element approximation, the presence of mode trapping manifests itself for all of the set of hydrogen envelopes and the whole range of periods considered. This is a result that has been found by others authors (Brassard et al. 1992ab; Bradley 1996). As mentioned, trapped modes correspond to local minima in kinetic energy. Note that, as decreases, the number of trapped modes becomes markedly lower, and also that the contrast in kinetic energy between trapped modes and other (non-trapped) modes increases, as found by Brassard et al. (1992b) (see their figures 20a and 20b). As detailed by these authors, for models with thick hydrogen envelopes, the hydrogen-helium transition is located at relatively large depths, in such a way that the radial eigenfunctions of modes adopt very low amplitudes. As a consequence, the reduction in the amplitude of the eigenfunctions caused by the presence of the chemical transition region is not very appreciable for the trapped modes, and therefore their values are not very much diminished (see Fig. 4). In contrast, for thin hydrogen envelopes, the lowering of value for trapped modes is more noticeable, because the hydrogen-helium interface is located in a region in which the eigenfunctions have larger amplitudes.
The situation is quite different when time-dependent element diffusion is adopted to modeling the chemical interfaces. As a result of the smoothness caused by element diffusion, the eigenfunctions are not substantially perturbed by the density changes at the interfaces. Therefore, the modes have similar values, at least from a given ’ value. We conclude that for all of the values, the signatures of mode trapping become therefore considerably weaker when the shape of the chemical composition at the hydrogen-helium transition zone is assessed in the frame of non-equilibrium diffusion. However, note that the differences obtained between both treatments of diffusion are not very important as far as the distribution of is concerned. A closer inspection of the behaviour of this quantity reveals the imprints of the other chemical transitions, such as the helium-carbon interface. The signals of mode trapping from this interface consist of secondary minima in .
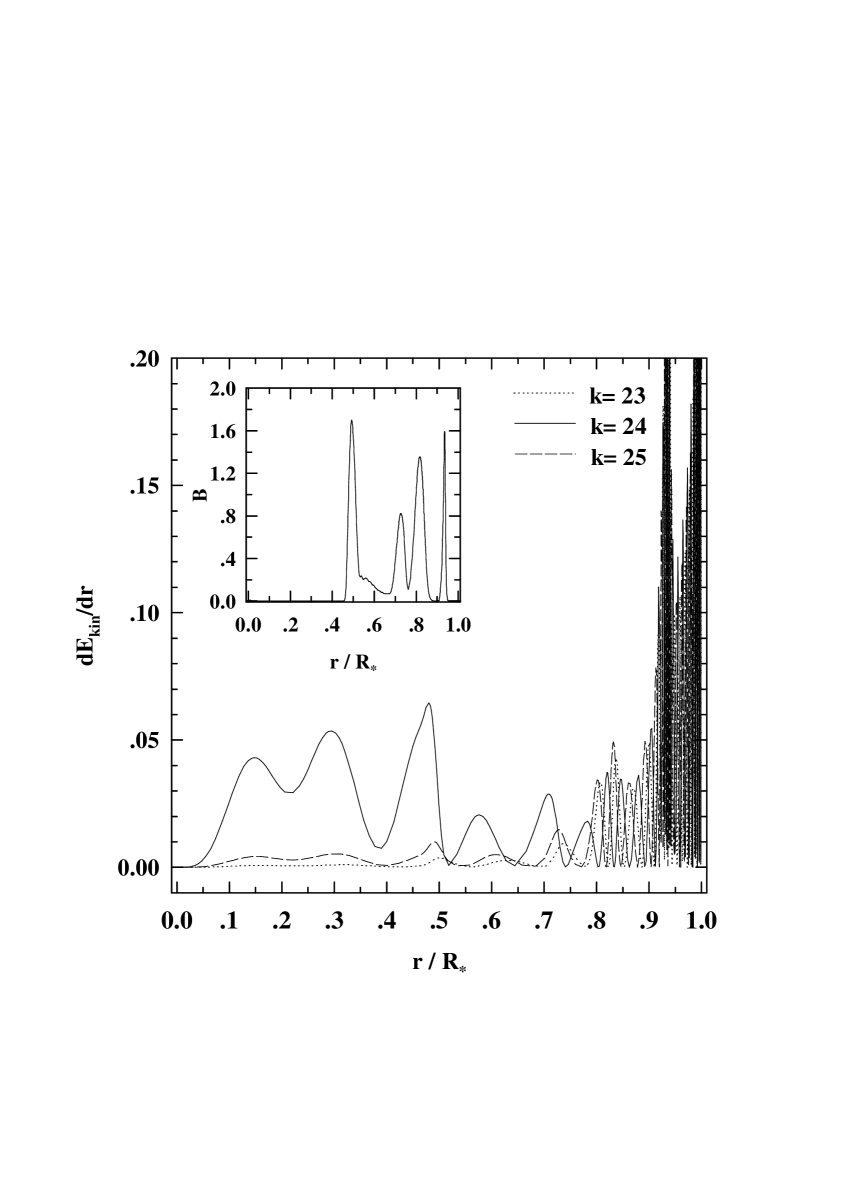
Another interesting feature shown by these diagrams is the presence of certain modes characterized by enhanced values of their kinetic energy. The existence of these modes is related to the innermost peak in the Ledoux term. These modes are characterized by relatively large amplitude in the high-density, central region of the star. This can be appreciated in Fig. 6, in which we depict the density of oscillation kinetic energy () in terms of the stellar radius, corresponding to modes with 23, 24 and 25 and 2 in a model with = (see Fig. 4). As well known, this function is an indicator of how a given mode samples different regions in a stellar model. This function has been employed by Gautschy, Ludwig & Freytag (1996). Note the markedly large amplitude of corresponding to the centrally enhanced mode (= 24), as compared with the neighbouring ones (= 23 and 25). The presence of the centrally enhanced modes translates into very pronounced minima in the - diagrams. A similar finding has been reported by Gautschy et al. (1996). It is also worth noting that in the case of stellar models with time dependent diffusion, the presence of such centrally enhanced modes in the spectrum of energy is much more apparent that in the case of stellar models calculated under the assumption of diffusive equilibrium in the trace element approximation, in which case the imprint of mode trapping in the outer layers is the dominant feature.
4 Conclusions
In this paper we have explored the effect of the time-dependent element diffusion on the mode trapping properties of DA white dwarf models with various thickness of the hydrogen envelope. Specifically, we have computed adiabatic non-radial -modes with 1, 2, 3, for periods ranging from 100 to 1000 s. In addition, we have obtained the period spacing and the oscillation kinetic energy for each mode. Pulsational calculations have been performed on 0.6 WD evolutionary models in a range covering the entire observed ZZ Ceti instability strip. With respect to the hydrogen content, the following values for the hydrogen envelopes = , , , and have been considered. The innermost chemical composition of our models is that of Salaris et al. (1997).
Here, white dwarf modeling rests on a detailed and up-to-date physical description. In particular, the processes describing gravitational settling, chemical and thermal diffusion of nuclear species have been considered in the frame of a multi-component treatment. White dwarf evolution has been computed in a self-consistent way with the predictions of element diffusion and nuclear burning. In the interests of comparison, we have also performed pulsation calculations in the frame of the stellar models constructed under the standard assumption of diffusive equilibrium in the trace element approximation. In this sense, results using such a standard treatment are in good agreement with those of other authors.
We find that time-dependent element diffusion considerably smooth out the composition profile at the hydrogen-helium chemical interface by the time the ZZ Ceti domain is reached. This is true for all of the hydrogen envelopes we considered. The main conclusion of this work is that the presence of mode trapping becomes considerably weaker when the shape of the chemical composition at the hydrogen-helium transition zone is assessed in the frame of time-dependent element diffusion. For large periods, this conclusion remains valid regardless the hydrogen envelope mass with which a white dwarf settles upon its cooling track. Notice that such conclusion is largely the same we have found in our previous work on this topic (Córsico et al. 2001), which was based on white dwarf models constructed by a full stellar evolution treatment. Let us remark that these models have internal profiles somewhat different than those employed here (Salaris et al. 1997). Thus, it seems that, regardless the fine details of the internal chemical profile, the weakening of mode trapping caused by time-dependent element diffusion is expected to be correct on very general grounds. Thus, we see no reason for considering mode trapping as an efficient mechanism to explain the scarcity of eigenperiods in the pulsational spectra of ZZ Ceti stars.
In closing, we note that in view of the smoothness of the kinetic energy distribution predicted by our models with diffusively evolving stratifications, the hypotetical existence of centrally enhanced modes in real stars would manifest itself as the absence of such modes in the light curves. This is so because these modes are very energetic and would have low probability to reach sufficiently high amplitude. Thus, these modes (the absence of them in the light curves) could be a potentially useful means for exploring the structure of innermost deep regions of the WD cores.
5 acknowledgments
We would like to acknowledge the comments and suggestions of an anonymous referee, which improved the original version of this work.
References
- [1] Althaus L. G., Benvenuto O. G., 2000, MNRAS, 317, 952
- [2] Althaus L. G., Serenelli A. M., Córsico A. H., Benvenuto O. G., 2002, MNRAS, 330, 685
- [3] Benvenuto O. G, Córsico A. H., Althaus L. G., Serenelli A. M., 2002, MNRAS, 332, 399
- [4] Bradley P. A., 1996, ApJ, 468, 350
- [5] Bradley P. A., 1998, ApJS, 116, 307
- [6] Bradley P. A., 2001, ApJ, 552, 326
- [7] Bradley P. A., Winget D. E., 1991, ApJS, 75, 463
- [8] Bradley P. A., Winget D. E., 1994, ApJ, 421, 236
- [9] Brassard P., Fontaine G., Wesemael F., Hansen C. J., 1992a, ApJS, 80, 369
- [10] Brassard P., Fontaine G., Wesemael F., Tassoul M., 1992b, ApJS, 81, 747
- [11] Brassard P., Fontaine G., Wesemael F., Kawaler S. D., Tassoul M., 1991, ApJ, 367, 601
- [12] Brickhill A. J., 1991, MNRAS, 251, 673
- [13] Burgers J. M., 1969, Flow Equations for Composite Gases (New York: Academic)
- [14] Clemens J. C., 1994, PhD Thesis, University of Texas
- [15] Córsico A. H., Benvenuto O. G., 2002, Ap&SS, 279, 281
- [16] Córsico A. H., Althaus L. G., Benvenuto O. G., Serenelli A. M., 2001, A&A, 380, L17
- [17] D’Antona F., Mazzitelli I., 1991, in IAU Symp. 145, Evolution of Stars: the Photospheric Abundance Connection, ed. G. Michaud & A. Tutukov (Dordrecht: Kluwer), 399
- [18] Dolez N., Vauclair G., 1981, A&A, 102, 375
- [19] Dziembowski W., 1977, Acta Astron., 27, 203
- [20] Gautschy A., Ludwig H.-G., Freytag B., 1996, A&A, 311, 493
- [21] Goldreich P., Wu Y., 1999, ApJ, 511, 904
- [22] Iben I. Jr., MacDonald J., 1986, ApJ, 301, 164
- [23] Kepler S. O., Robinson E. L., Nather R. E., 1983 ApJ, 271, 544
- [24] Kepler S. O., Robinson E. L., Nather R. E., McGraw J. T., 1982, ApJ, 254, 676
- [25] Nather R. E., Winget D.E., Clemens J.C., Hansen C. J., Hine B. P., 1990, ApJ, 361, 309
- [26] Pfeiffer B., et al., 1996, A&A, 314, 182
- [27] Salaris M., Domínguez I., García-Berro E., Hernanz M., Isern J., Mochkovitch R., 1997, ApJ, 486, 413
- [28] Stover R. J., Nather R. E., Robinson E. L., Hesser J. E., Lasker B. M., 1980, ApJ, 240, 865
- [29] Tassoul M., Fontaine G., Winget D. E., 1990, ApJS, 72, 335
- [30] Winget D. E., Van Horn H. M., Hansen C.J., 1981, ApJ, 245, L33
- [31] Winget D. E., Van Horn H. M., Tassoul M., Hansen C. J., Fontaine G., Carroll B. W., 1982, ApJ, 252, L65
- [32] Unno W., Osaki Y., Ando H., Saio H., & Shibahashi H., 1989, Nonradial Oscillations of Stars, University of Tokyo Press, 2nd. Edition