The Extended Emission-Line Region of 4C 37.43111Based on observations made with the NASA/ESA Hubble Space Telescope, obtained at the Space Telescope Science Institute, which is operated by the Association of Universities for Research in Astronomy, Inc., under NASA contract NAS 5-26555.
Abstract
We have explored the nature of the extended emission-line region around the quasar 4C 37.43, using extensive ground-based and HST imaging and spectroscopy. The velocity field of the ionized gas shows gradual gradients within components but large jumps between components, with no obvious global organization. The HST [O III] image shows radial linear features on the east side of the QSO that appear to mark the edges of an ionization cone. Concentrating on the bright emission peaks east of the quasar, we find through modeling that we require at least two density regimes contributing significantly to the observed emission-line spectrum: one with a density of cm-3, having essentially unity filling factor, and one with a density of cm-3, having a very small () filling factor. Because the temperatures of these two components are similar, they cannot be in pressure equilibrium, and there is no obvious source of confinement for the dense regions. We estimate that the dense regions will dissipate on timescales years and therefore need to be continuously regenerated, most likely by shocks. Because we know that some QSOs, at least, begin their lives in conjunction with merger-driven massive starbursts in their host galaxies, an attractive interpretation is that the extended emission region comprises gas that has been expelled as a result of tidal forces during the merger and is now being shocked by the galactic superwind from the starburst. This picture is supported by the observed distribution of the ionized gas, the presence of velocities ranging up to km s-1, and the existence of at least two QSOs having similarly luminous and complex extended emission regions that are known to have ultra-luminous IR galaxy hosts with current or recent starbursts.
1 Introduction
The first observation of emission lines from a resolved region around a QSO was that of Wampler et al. (1975). Other examples followed (Stockton, 1976; Richstone & Oke, 1977; Boroson & Oke, 1984; Boroson et al., 1985; Stockton & MacKenty, 1987). The origin of these extended emission-line regions (EELRs) around low-redshift QSOs is still uncertain. The distribution of the emission-line gas generally appears to be uncorrelated with either the extended continuum emission or the radio structure, although both the incidence and the luminosity of EELRs is higher for steep-spectrum radio quasars than for flat-spectrum quasars or radio-quiet QSOs (Boroson & Oke, 1982, 1984; Stockton & MacKenty, 1987). Two principal suggestions have been made: (1) that the gas is debris from strong interactions or mergers (Stockton & MacKenty, 1987), and (2) that the gas is due to cooling flows from a hot surrounding medium (Fabian et al., 1987). We report here on an investigation of the EELR associated with the 4C 37.43. This quasar has the most luminous EELR known among QSOs at (Stockton & MacKenty, 1987), making it an obvious candidate for detailed study. At the same time, the morphology and spectrum of this EELR are similar to those of many other low-redshift QSOs, so the results of this investigation should have a wider application.
2 Observations and Data Reduction
2.1 Ground-Based Imaging and Spectroscopy
We use several types of ground-based data on 4C 37.43: (1) imaging in a 29 Å bandpass centered on [O III] , to determine the morphology and brightness distribution of the ionized gas; (2) imaging in the essentially line-free continuum region between restframe 5050 Å and 6050 Å; (3) imaging in a 290 Å bandpass including H, along with an adjacent continuum bandpass, to determine the H flux within an aperture equivalent to that used for our Hubble Space Telescope (HST) FOS spectroscopy; (4) low-resolution spectroscopy to determine both the velocity structure of the ionized gas and line ratios to compare with photoionization models to estimate reddening; and (5) higher-resolution spectroscopy to measure the [O II] ,3729 doublet ratio as a diagnostic of the electron density.
We obtained a total of 9000 s of narrowband [O III] imaging with the University of Hawaii (UH) 2.2-m Telescope and a Tektronix CCD, through a filter centered at 6865 Å and having a FWHM of 29 Å. In addition, we obtained 3000 s in an essentially line-free continuum bandpass filter centered at 7606 Å, with a FWHM of 1372 Å. The images were reduced via standard techniques, using flat-field exposures of the illuminated interior of the dome, and the flux calibration was determined from images of the spectrophotometric standard star Feige 67 (Massey et al., 1988). Stellar objects have a FWHM of 080 in the [O III] image and 076 in the line-free continuum image. For the brighter regions in both images, our S/N ratio is high enough to allow useful deconvolution, which we have carried out using the STSDAS contributed task ACOADD (Hook & Lucy, 1993, and references therein).
We also obtained 10,800 s of H imaging at the UH 2.2-m Telescope, with a filter centered at 9131 Å and having a 290 Å FWHM bandpass. Although redshifted H lies at Å near the edge of the filter bandpass, the transmission at this position was greater than 70%. Line-free continuum exposures totaling 1500 s were obtained through a filter centered at 8338 Å, with a FWHM of 880 Å. These FWHM for stellar objects in these images was .
Some of the low-resolution spectroscopy was obtained with image slicers (Stockton & Canalizo, 2000) and the f/31 spectrograph on the UH 2.2-m Telescope. The image slicers provided 3 contiguous slits on the sky and produced 3 independent spectra on the Tektronix CCD. We tried two approaches: half of the data was obtained with a slicer having slit widths of 115 at a position angle (PA) of ; the remaining half with a slicer having slit widths of 21 at a PA of . In both cases, the center slit was centered on the bright emission peak about 4″ east and slightly north of the quasar. By using these image slicers, we were able to collect essentially all of the flux from the main emission region and eliminate any potential problem with atmospheric dispersion in comparing the flux from H and H. We obtained a total of 16,200 s of useful integration.
We obtained additional low-resolution spectroscopy, with a total integration of 3600 s, with the Low-Resolution Imaging Spectrometer (LRIS; Oke et al. 1995) on the Keck II telescope. With a 300 groove mm-1 grating, the 1″-wide slit gave a FWHM of Å. The slit was placed through the QSO and the bright emission region to the east at position angle 727.
Our high-resolution spectroscopy of the [O II] doublet was obtained with the UH Faint-Object Spectrograph and a Texas Instruments CCD on the Canada-France-Hawaii Telescope (CFHT). Using a 1200 groove mm-1 grating and a 14 slit, we had a dispersion of 0.7 Å pixel-1 and an instrumental FWHM of 3.3 pixels, or 2.3 Å. We obtained 7200 s total integration centered on the peak of the emission-line region at slit PA . We also obtained additional lower-resolution (FWHM 5.0 Å) spectroscopy during the same run, using a 500 groove mm-1 grating and an image slicer with three 07 slits on 14 centers and at position angle 755. By using 4 interleaved exposures (3 of 2700 s duration, 1 of 2100 s), we were able to completely cover a region of . The main purpose of these observations was to determine the velocity field of the ionized gas over most of the emitting region through measurements of the [O III] line.
2.2 HST Spectroscopy and Imaging
Our HST observations of 4C 37.43 consist of Cycle 2 spectroscopy with the Faint-Object Spectrograph (FOS) and Cycle 6 imaging with the Wide-Field—Planetary Camera (WFPC2).
The original objective of the FOS spectroscopy was to determine the Ly- flux, for comparison with groundbased observations of Balmer-line fluxes. The entrance aperture was , but the height of the linear diode array limited the effective aperture to , where the 43 dimension was parallel to the dispersion axis. For an aperture of this size, the pre-refurbishment HST optical quality was sufficiently good that the residual spherical aberration had no significant impact on our results. The center of this effective aperture was offset from the quasar by 4″ in position angle , to the peak of the extended emission. In order to minimize the amount of scattered light from the wings of the aberrated quasar PSF entering the spectrograph, we used an engineering mode that allowed us to deflect the electron beam within the Digicon detector so that only the lower third of the square entrance aperture (that closest to the quasar) was projected onto the readout array. A total of 5550 s of exposure was obtained in two orbits.
The FOS observations were reduced with the improved STScI “calfos” pipeline in 1994. This version included geomagnetic correction. In addition, a manual correction was applied for internal scattered light, although this had only a minor impact on the resulting spectrum. From the absence of broad wings on Ly- and C IV and comparison with the line ratios observed in the FOS nuclear spectrum (Bahcall et al., 1993), we established that any contribution of light from the quasar itself was small, in agreement with our estimate of the expected light in the wings of the quasar PSF.
The WFPC2 imaging comprised both WFC3 and PC1 observations in the F814W filter, which is dominated by continuum radiation (although H falls on the longward wing of the filter profile, where the transmission is % of the peak), and WFC2 observations with a linear-ramp filter (LRF) centered on the redshifted [O III] emission line. The WFC3 F814W imaging consisted of two exposures at each of four dither positions, with a total of 6400 s; the PC1 F814W imaging, of four exposures at each of four dither positions, with a total of 2560 s; and the WFC2 LRF imaging, of two exposures at each of two dither positions, with a total of 9200 s.
After standard pipeline reduction, the images were combined using the STSDAS drizzle procedure (Fruchter & Hook, 1997). Cosmic rays were first identified using the STSDAS crrej task, with careful adjustment of the parameters to avoid any significant compromising of real data, and masks for the cosmic rays were combined with the pipeline-generated data-quality files to produce the masks used to reject pixels in the final combination.
3 Results
3.1 The Morphology of the Ionized Gas
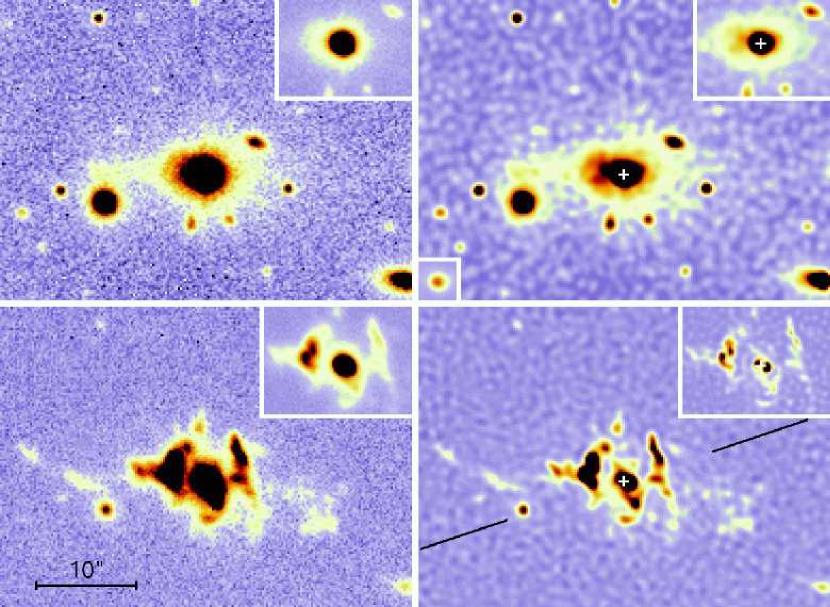
Figure 1 shows our ground-based images in essentially line-free continuum and in [O III] emission, obtained with the UH 2.2 m telescope. The most striking impression is how unlike the continuum and line images are: the ionized gas seems to know virtually nothing of the distribution of the continuum (presumably stellar) material. The continuum extension to the east, possibly forming a tidal bridge to the companion galaxy (which is known to be at the same redshift as the quasar; Stockton 1973, 1978), has been described previously by Stockton (1986), Hickson & Hutchings (1987), Stockton & MacKenty (1987), and Block & Stockton (1991). The strong emission-line peak ″ east-northeast of the quasar was first noted in -band imaging (which includes the strong [O III] lines) by Stockton (1976); a lower-resolution image in a narrow-band filter centered on [O III] has been given by Stockton & MacKenty (1987), and integral-field spectroscopy has been carried out by Durret et al. (1994) and Crawford & Vanderriest (2000). This emission structure, which we shall henceforth refer to as “”, is the subject of much of the remainder of this paper.
Particularly in the deconvolved, PSF-subtracted [O III] image (lower-right panel of Fig. 1), considerable new detail is seen in the structure of the ionized gas. , previously seen simply as an elongated region, is now clearly double, with each of the peaks sporting suggestive tail-like appendages. The long linear structure to the northwest of the quasar takes on an undulating appearance and breaks up into a series of knots. Finally, there appears to be a previously undetected emission peak even brighter than those to the east just 05 west and slightly south of the quasar.
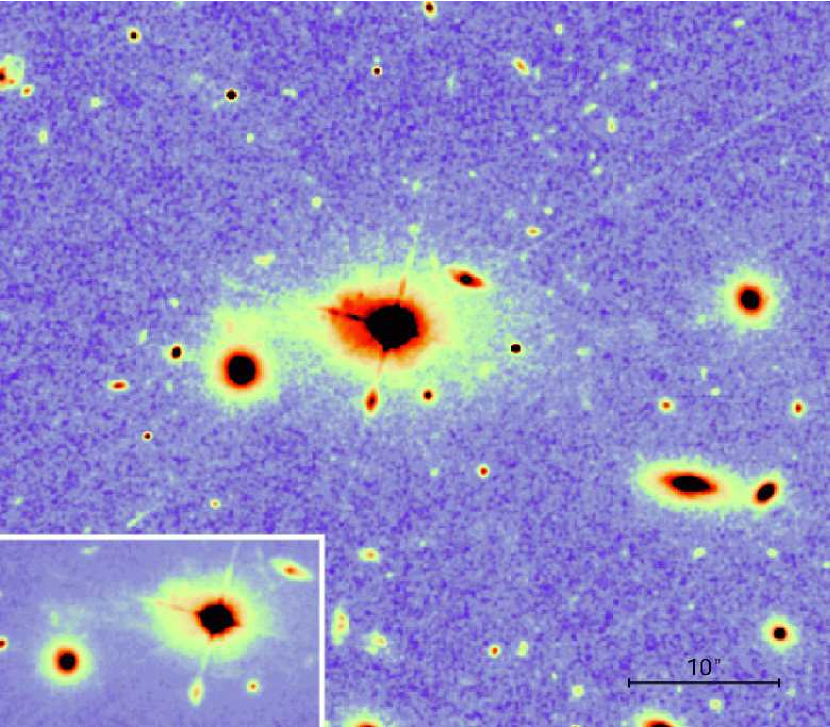
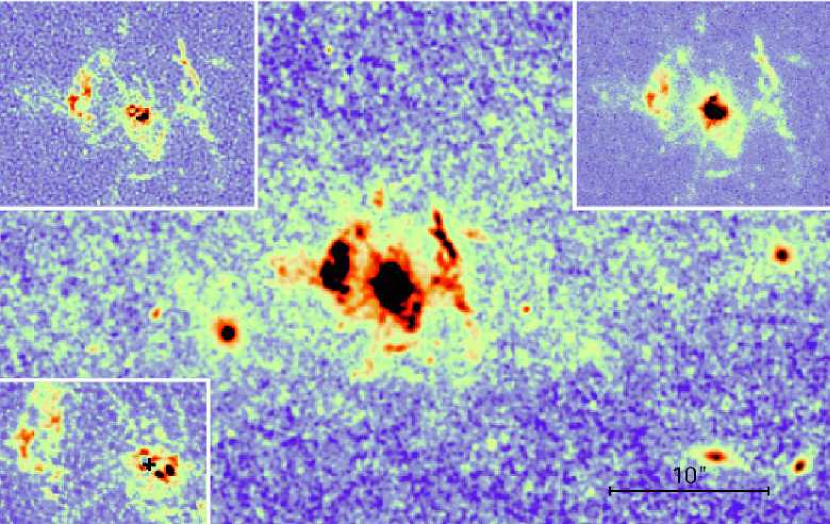
The HST images generally confirm and extend these results. The WFC3 F814W continuum image is shown in Fig. 2, and the LRF [O III] image in Fig. 3. The relatively shallow PC F814W image shows no significant new structure.
The WFC3 F814W continuum images are saturated at the center of the quasar, so it is difficult to recover structure very close to the quasar by deconvolution or PSF fitting and subtraction. The PC1 F814W exposures were planned to avoid saturation of the quasar; on the other hand, these images are strongly dominated by CCD readout noise, so low-surface-brightness features have poor S/N. The linear-ramp-filter [O III] images avoid saturation of the quasar and have similar surface-brightness sensitivity to our best ground-based images. However, the shift of the central wavelength with position on the CCD that is a characteristic of these filters means that the [O III] emission more than about 8″ from the quasar will be lost.
The deep continuum image (Fig. 2) shows that the bridge-like structure to the east has a quite narrow core. The high-surface-brightness region northeast of the quasar, quite smooth at ground-based resolution, now shows some knots that may be star-forming regions, although some of this structure is due to regions of bright H emission leaking through the wings of the F814W filter profile.
The [O III] image (Fig. 3) shows an impressive amount of detail. The two bright peaks comprising break up into a series of discrete knots, the long structure on the west side of the quasar now has a braided appearance, and the very bright region just west of the quasar is seen to have two discrete bright peaks; these last features are confirmed in the PC image, where they are apparently due to the H leak. The material to the southwest of the quasar forms an irregular ring, somewhat reminiscent of the one seen in the extended emission region around the quasar 4C 25.40 (Stockton & MacKenty, 1987). However, probably the most important new features are the faint linear structures extending from the quasar to the northeast and southeast: these are almost certainly the edges of the ionization cone illuminating the bright emission regions east of the QSO. They are unlikely to be artifacts of the PSF, since they persist undiminished after careful PSF subtraction, using a star observed at the same detector position (Fig. 3, upper-left insert). The presumed cone has an apparent opening angle of and its axis has a position angle of 77°, not particularly well aligned with the axis of the extended symmetric double radio source, which has a position angle of (Miller, Rawlings, & Saunders 1993; see Fig. 1). In retrospect, these linear features are confirmed in our deconvolved ground-based [O III] image in Fig. 1, although the resolution there is certainly not high enough to allow them to have been recognized as an ionization cone.
As mentioned above, at distances greater than a few arcsec, the LRF bandpass shifts off the [O III] line, so some of the [O III] emission seen at large distances east and west of the quasar in the our ground-based [O III] image is not present in the HST image. It is perhaps significant that the axis defined by the most distant material seen in the ground-based [O III] image (Fig. 1, bottom panels) lies close to the axis of the ionization cone. In fact, most of the extended emission lies within the projected edges of this cone or those of an inferred counter cone, although some strong emission does not. It is possible that this emission lying outside the projected cone is evidence that the obscuring torus is leaky or irregular along some lines of sight.
3.2 Reddening Along the Line-of-Sight
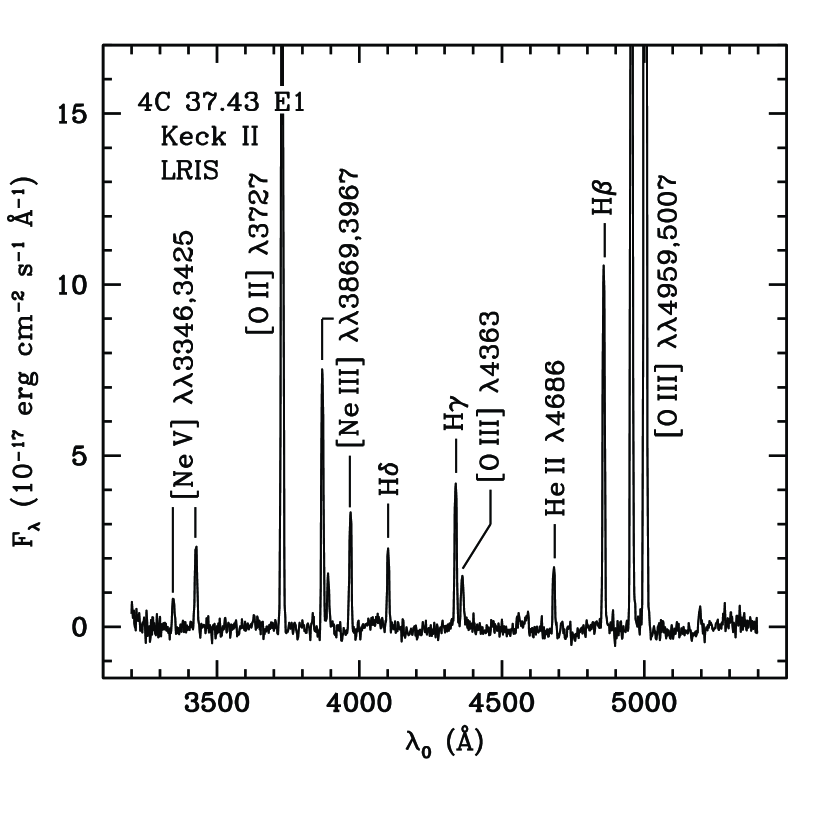
Before we can discuss emission-line ratios, we must estimate the reddening along the line-of-sight from both Galactic dust and that associated with 4C 37.43 itself. For the Galactic extinction, the dust column densities found by Schlegel et al. (1998) imply mag. After correcting the line fluxes by a standard Galactic extinction curve normalized to this value, we obtain an H to H flux ratio of and an H to H flux ratio of (the former ratio was obtained from our spectrum from the UH 2.2 m telescope, the latter from our Keck LRIS spectrum (Fig. 4), which has a much better signal-to-noise ratio). Assuming that the reddening of the emission lines by intervening dust associated with 4C 37.43 can be approximated by a standard Galactic reddening law (e.g., Cardelli et al., 1989), we obtain intrinsic ratios HH and HH with . These ratios are quite consistent with Case B recombination, with little or no enhancement of H due to collisional excitation.
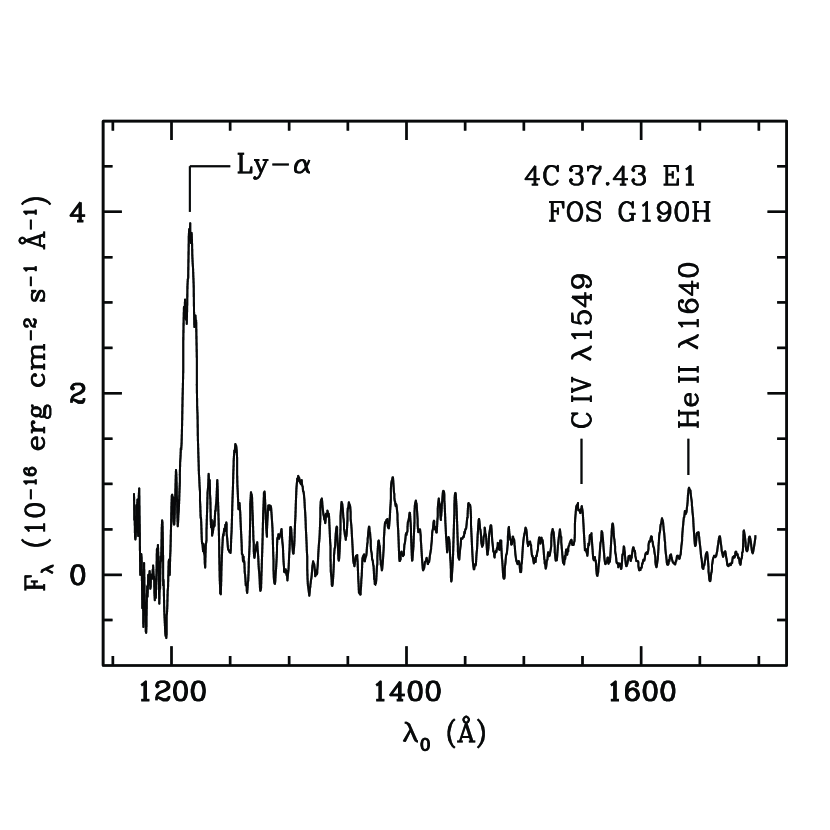
3.3 The Ly-/H Ratio
The UV spectrum of obtained with the HST FOS is shown in Fig. 5. The observed flux in the Ly- line is erg cm-2 s-1. From our ground-based H imaging, using a synthetic aperture designed to match as closely as possible the effective FOS aperture, we obtain an H flux of erg cm-2 s-1, where most of the quoted error is due to estimated uncertainties in the aperture matching. These values give a measured value of the Ly-/H flux ratio of . We must now attempt to correct for reddening.
Extrapolating the reddening found from the Balmer lines into the UV is very uncertain. If we simply assume that a standard Galactic reddening law, with , holds over the whole range, then the Ly- to H flux ratio is ; if we consider values of ranging from 2.5 to 5 (roughly corresponding to the extreme values seen along lines of sight in the Galaxy), we obtain flux ratios ranging from to , respectively. The expected ratio under Case B conditions with no dust in the emission region, K, , and uncomplicated geometries would be (our more detailed photoionization models given in §3.4.2 give a ratio of ). Thus, the intrinsic ratio could be consistent with little or no dust in the emitting region, or it could be a factor of lower than this value, depending on the UV extinction properties of the intervening dust. Although it is often assumed that Ly- emission is easily destroyed by small amounts of internal dust because of the increase of effective path before escape due to multiple scatterings, realistic simulations indicate that rather large concentrations of dust are required to produce significant deviations from the Case B ratio (Binette et al., 1993). This result is largely due to the small gas column density in typical clouds, thus requiring few average scatterings before escape from the cloud. There can also be rather large variations in the Ly-/H ratio because of geometrical effects (Binette et al., 1993). Our bottom line is that, if something close to a standard Galactic reddening law with applies along the line of sight, both in our Galaxy and in the host galaxy of 4C 37.43, and if the individual emitting clouds are fairly isotropic in their emission of Ly-, then we infer substantial quantities of internal dust. However, the uncertainties in both the intervening reddening and the nature of the emitting clouds is such that we cannot exclude the possibility of little or no dust.
3.4 Physical Properties of the Emission-Line Region
3.4.1 Average Electron Density and Temperature in the Emitting Regions
The luminosity-weighted average electron density in the [O II]-emitting region can be determined from the ratio of the [O II] ,3729 lines, and the electron temperature in the [O III]-emitting region similarly can be determined from the ratio of the [O III] ,5007 lines (e.g., Osterbrock, 1989).
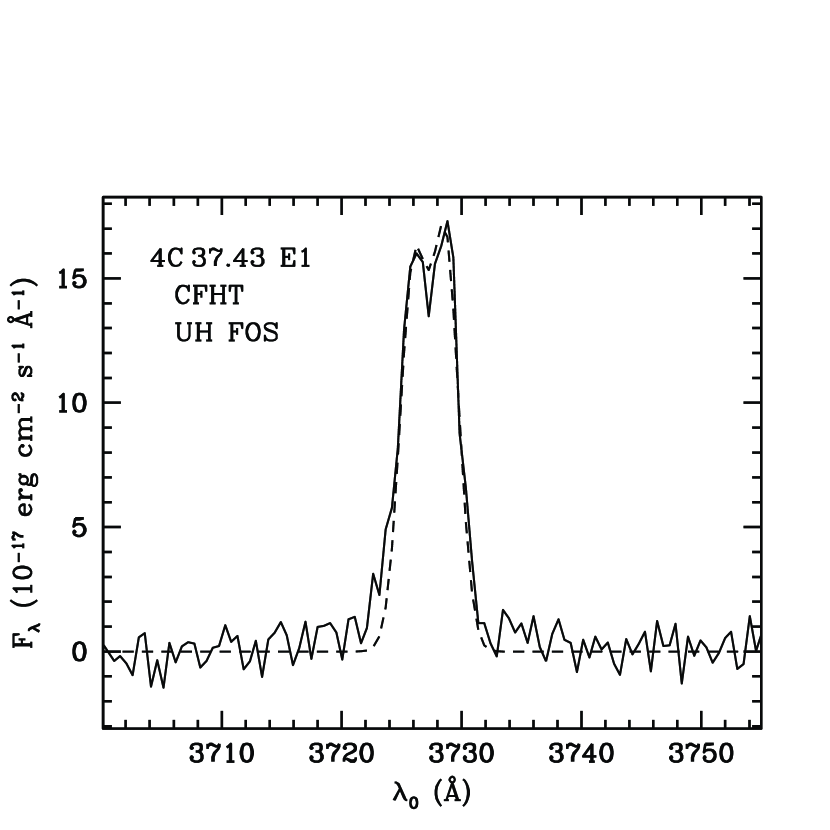
Figure 6 shows our high-resolution profile of the [O II] ,3729 doublet. While the two lines are not quite resolved, the profile allows a unique decomposition. The fit shown is based on Gaussian profiles placed at the laboratory wavelengths of the lines, fitted to the deredshifted spectrum, where the redshift has been determined from the [Ne III] line. The ratio , implying cm-3 if K, or cm-3 if K. Earlier, Bergeron & Durret (1987) had found by estimating the ionization parameter from the emission-line spectrum and the incident flux from the quasar luminosity and the projected distance to the emitting region.
The [O III]-line ratio is well determined from our Keck LRIS spectrum (Fig. 4). The observed ratio is . After correction for reddening, as determined according to §3.2, we obtain (we assume both for the correction for Galactic reddening and for reddening at the redshift of 4C 37.43, but the difference over this wavelength range from using any other reasonable value is similar to the random uncertainty). For any likely value of , K.
3.4.2 Comparison with Photoionization Models
It is clear even without running the models that no single-parameter model can reproduce the observed spectrum: an ionization parameter consistent with the [Ne V]/[Ne III] and [O III] /H intensity ratios produces relatively much weaker [O II] emission than is observed. These and other inconsistencies between observed spectra of AGN narrow-line and extended emission regions and computed photoionization models based on a single ionization parameter have led to several attempts to achieve better agreement by considering at least two kinds of clouds with significantly different physical properties. One of the most successful of these approaches, pioneered by Viegas & Prieto (1992) and explored in considerable detail by Binette, Wilson, & Storchi-Bergmann (1996), involves using a combination of high-ionization-parameter matter-bounded clouds and low-ionization-parameter ionization-bounded clouds. The usefulness of this approach was confirmed by Robinson et al. (2000), who found that such a mixed-medium model not only gave a better fit to the emission-line spectrum of extended emission in the radio galaxy 3C 321 but also resulted in a more reasonable value for the photoionizing flux of the (hidden) UV source. Achieving good agreement with the observed emission spectrum may also require the use of non-solar abundances (e.g., Viegas & Prieto, 1992).
We have run grids of models using the MAPPINGS3 photoionization code (Dopita & Sutherland, 1995). Guided by the investigations just mentioned, we have sought an acceptable model by (1) using two components, (2) allowing either or both components to be density bounded, and (3) allowing non-solar metallicities. We estimate the flux density at the Lyman limit by making a plausible interpolation between the UV and X-ray luminosities given by Laor et al. (1994), converting the luminosity density to our assumed flat cosmology with km s-1 Mpc-1 and , and taking the actual distance to to equal the projected distance of 4″ ( kpc). We obtain the flux density from the quasar continuum at the Lyman limit incident on to be erg cm-2 s-1 Hz-1. We assume a two-component power-law photoionizing continuum, where a component with index dominates in the UV and a flatter component with index dominates in the X-ray region (). This continuum is normalized at the Lyman limit to the value of found above. We have also considered a normalization to a flux density reduced by a factor of 2, corresponding to a projection factor of in the distance. This reduced incident flux results in best-fit models only slightly different from those for unity projection factor (i.e., using our assumed ), requiring minor changes to the densities and metallicity.
To obtain an acceptable fit to the observations, we find that we need to have a metallicity significantly below solar, one component with a density of several hundred cm-3, and the other with a density near 1 cm-3. Neither component can be extremely optically thin at the Lyman limit; on the other hand, we get slightly better agreement if the low-density component is somewhat density limited, with optical depths at the Lyman limit of 10 or so. Our best agreement is for a model with about 1/3 solar metallicity, with of the flux of H coming from an essentially ionization-bounded component with average density cm-3, and from a density-bounded component with average density cm-3 and an optical depth at the Lyman limit of 16. The run of temperature in these regions is determined in a self-consistent manner from the models and averages close to K in the high-density component and K in the low-density component. The average dimensionless ionization parameters are for the low-density region and for the high-density region. The results from two models, combining these two components in different ratios, are compared with the observed line ratios in Table 1. Models 1 and 2 have, respectively, 25% and 33% of the H flux coming from the high-density component. Model 1 fits most of the line ratios very well, but underestimates the [O II] emission by 40%. Model 2 fits all of the line ratios within %.
| Line-Flux Ratios | [Ne V] | [O II] | [O II] | [Ne III] | [O III] | He II | [O III] | [N I] |
|---|---|---|---|---|---|---|---|---|
| ObservedaaAll line fluxes are given as ratios to the H flux | 0.34 | 1.42 | 1.46 | 0.96 | 0.19 | 0.20 | 10.55 | 0.07 |
| Model 1 | 0.34 | 0.87 | 0.90 | 0.85 | 0.19 | 0.20 | 10.31 | 0.07 |
| Model 2 | 0.30 | 1.15 | 1.18 | 0.81 | 0.17 | 0.20 | 9.35 | 0.07 |
From our estimate of the dereddened H flux (§3.3), an estimate of the volume over which this flux is emitted, and the relative amounts of Balmer emission from the two components of our photoionization model, we can estimate the filling factors of the two density regimes. If is the observed H flux from a given region, the filling factor can be written as
where is the emission coefficient for H, is the angular radius of a sphere having the same volume as the emitting region, and is the luminosity distance. The quantity is nearly independent of density over the relevant density range and can be taken to be a function of temperature only (e.g., Osterbrock, 1989). For the case of , if we assume that and that , with values of 2 cm-3 and 500 cm-3 for the low-density and high-density regions, respectively, we then obtain filling factors and . Given the strong sensitivity of these calculations to the size of the emitting region, along with the simplicity of our model, these results likely point to a situation in which the low-density, [O III]-emitting gas fills the volume, in which are embedded tiny, dense regions of [O II]-emitting gas. Normalizing to the H flux over a region centered on , we obtain of gas in the low-density component and of gas in the high-density component.
While our two-component model is clearly a great oversimplification, it can still give some qualitative insight into the properties of the emission-line region. It is clear that most (%) of the [O III] emission comes from regions of low density, while the [O II] emission comes almost entirely from regions with densities times higher. This means that attempts to estimate the ionization parameter (and thence the pressure) from the [O II]/[O III] ratio (e.g., Fabian et al., 1987; Crawford & Vanderriest, 2000) are not likely to be reliable. As it happens, we do indeed find a pressure of cm-3 K for the high-density regions, close to the average pressure found by Crawford & Vanderriest (2000) for the EELR around 4C 37.43. But the pressure in the low-density region, which is arguably the component that is likely to be in pressure equilibrium with a hot external medium, is cm-3 K, over 2 orders of magnitude lower.
The high-density regions are thus clearly not in pressure equilibrium with their surroundings. Because they are located some 20 kpc (in projection) from the quasar and do not show a strong correlation with the continuum structure of the host galaxy (and are hence unlikely to be gravitationally confined), they will dissipate on a timescale on the order of the sound-crossing time. Our photoionization calculations indicate that these dense clouds (or at least the ionized part of them) are typically only about 0.1 pc thick, so, with a typical sound speed of km s-1, they are likely to have lifetimes of years. It seems most likely, then, that these clouds are continuously regenerated by shocks propagating through the surrounding medium. On the other hand, the relative weakness of UV lines such as O IV and C IV with respect to He II indicates that photoionization by the central QSO strongly dominates over ionization by the shocks themselves in generating the observed emission lines.
3.5 Kinematics of the Ionized Gas
Our moderate-resolution image-sliced spectroscopy of the [O III]—H region covers most of the obvious emission seen in our deep narrow-band [O III] imaging. Velocities (relative to the nuclear narrow-line region) measured from the [O III] line are shown in Fig. 7.
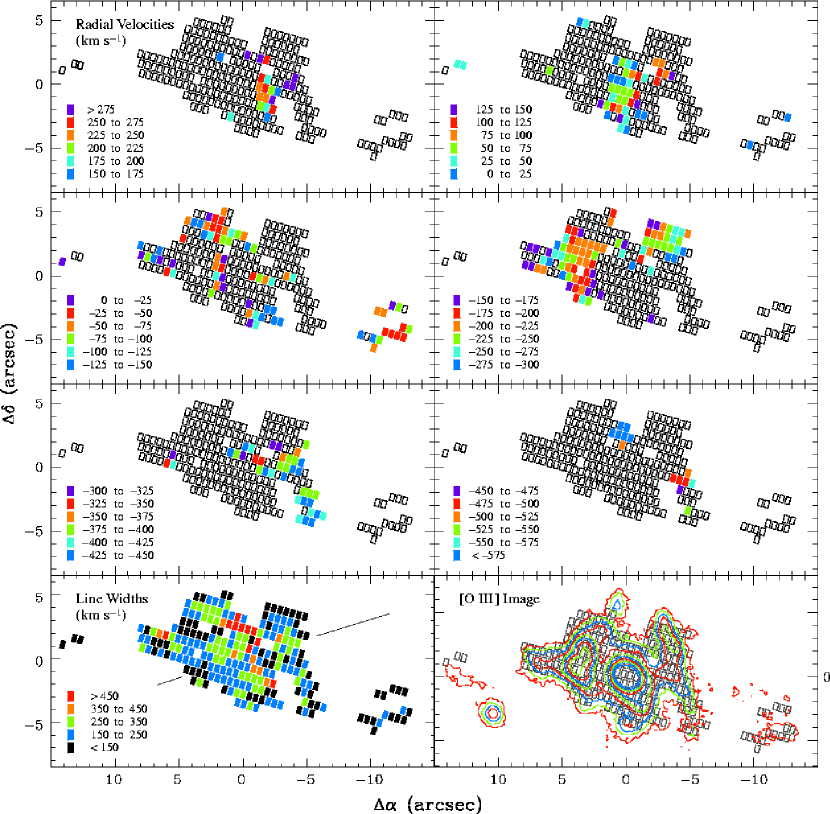
Our velocity map is in general agreement with those of Durret et al. (1994) and Crawford & Vanderriest (2000). The relative velocities range from to km s-1. One’s general impression is that the velocity field is locally ordered but globally disordered: individual filaments and components show continuous velocity gradients, but the velocities from region to region do not suggest any sort of simply organized kinematics. Note that the brightest regions on both the east and west sides of the QSO have substantial negative velocities.
Crawford & Vanderriest (2000, p. 442) mention that “…it is notable that the region of largest blueshift and of higher ionization in both the eastern and western clouds, and the highest FWHM in the western cloud (but not the eastern cloud) are all where the optical gas crosses the radio source axis.” Raising the possibility of a jet-cloud interaction, they however point out that “…there is no obvious distortion in the radio source to support this interpretation.” As Fig. 7 shows, while some fairly high-velocity gas lies close to the radio axis on the western side, gas at similar velocities exists at many locations, and the highest velocities are found elsewhere. In any case, it would seem difficult to understand why an interaction between the radio jet and the gas should give large negative radial velocities for both the approaching and the receding jet. We cannot make detailed comments on the variations in ionization because in many areas the H emission is too weak to measure. What measurements we do have show that the peak [O III]/H ratio falls near the peaks of the [O III] intensity, significantly to the north of the radio jet on both the east and west sides. In fact, our measurement of the [O III]/H ratio at the brightest region crossed by the jet on the east side is 5.3, the lowest we are able to measure anywhere, compared with 11.0 about 35 north of this position.
We show our measurements of the [O III] line width in the lower left map in Fig. 7. These measurements must be taken with some caution, since multiple velocities are present along many lines of sight, and it may not always have been possible to deconvolve indivdual components. With this proviso, there seems to be some enhancement in the line width near where the radio jet crosses the linear structure on the west side, but similar line widths are seen at many other locations in the nebula. The largest line widths seem to be associated with the high velocity gas about 2″ north of the quasar.
Overall, then, we find no compelling evidence for a significant effect on the gas kinematics or ionization from an interaction with the radio jet.
4 Origin of the Extended Gas
4.1 Varieties of QSO EELRs
Considering QSO EELRs as a class, we can distinguish at least four different types. The first are those in which the emission-line gas is closely associated with the morphology of the host galaxy; apparently, cold disk gas in the host galaxy is photoionized by the QSO nucleus. Such examples among QSOs (as contrasted with Seyferts) are rare, possibly because few QSOs have host galaxies with intact cold disks, and the ionization cones are likely not to intercept the disks in any case. The only likely example we are aware of is PG 0052+251 (Stockton & MacKenty, 1987).
The second type is that in which the emission-line gas appears to be connected with the radio morphology. At least among low-redshift QSOs, strong emission associated with radio structure is not common, but we do have an example in PKS 2251+11, where the two brightest peaks in the extended emission bracket the southeast radio lobe (Stockton & MacKenty, 1987; Durret et al., 1994; Crawford & Vanderriest, 2000). In such cases, it is likely that the emitting gas is either ambient material that has been shocked by the radio jet, or that it is gas from the host galaxy that has become entrained in the radio jet.
A third type includes cases for which a neighboring gas cloud, confined either gravitationally (as in a companion galaxy) or by thermal pressure (as in a cooling flow, as envisioned by Fabian et al. 1987), lies within the ionization cone of the QSO and is close enough to be photoionized by the QSO’s UV continuum. One trivial example of this type is a small galaxy ″ west of Mrk 1014. Stockton & MacKenty (1987) noticed that this galaxy was enhanced in the narrow-band image centered on the wavelength of [O III] in Mrk 1014, and recent spectroscopy confirms strong [O III] emission from this object at the redshift of Mrk 1014 (Canalizo & Stockton, 2000b). An intriguing possibility is that ionization by nearby QSO may make visible objects that would be very difficult to detect by any other means. There is reasonable evidence that dwarf galaxies are heavily dark-matter dominated (e.g., Mateo 1998, and references therein), so such galaxies can, in principle, trap gas in potential wells that are not well advertised in terms of their stellar luminosity. The ubiquitous dwarf star-forming galaxies (aka extragalactic H II regions) are a case in point: they cannot have sustained their present rate of star formation for more than a small fraction of a Hubble time. Many of these must have been virtually invisible in their earlier quiescent state; yet they have to have had substantial reservoirs of gas at moderately high densities in order to allow the current star formation to proceed. Objects such as these, with few stars but some gas in a largely dark matter potential well, would normally be undetectable at moderate redshifts, but they would become quite noticeable if the gas were to be ionized by a nearby QSO. This might be one way of detecting at least one class of the “ghost galaxies” proposed by Kormendy & Freeman (1998; see also Trentham et al. 2001). A possible example of such a case is the discrete [O III]-emitting object near NAB 0205+05 (Stockton & MacKenty, 1987), for which the equivalent width of the [O III] line is extremely high.
Finally, there is the type of EELR which is closely associated with the QSO, but for which the ionized gas, though often having a highly structured morphology, shows no obvious relation to either the radio or the optical continuum morphology. Most QSO EELRs seem to be of this type, although few have the luminosity or show the richness of structure of that of 4C 37.43.
4.2 Observational Constraints from the 4C 37.43 EELR
To recapitulate our main results from §3.4.2, the region of the 4C 37.43 EELR that we have investigated appears to comprise two main regimes, one with a density of cm-3 and a temperature of K, the other with a density of cm-3 and a temperature of K. The filling factor of the low-density gas is close to unity, while that of the higher-density gas is . It is possible that the low-density gas is close to pressure equilibrium with a surrounding hot external medium, but the high-density gas cannot be. The relatively low pressure of cm-3 K that we deduce for the low-density gas argues against a cooling flow origin for the emission-line region of 4C 37.43, as proposed by Crawford & Vanderriest (2000).
The referee has pointed out that photoionization of a typical giant molecular cloud (GMC) complex by a quasar could produce a similar two-phase density structure, as the photoionized region eats into the dense cloud and the ionized gas rapidly expands to reach pressure equilibrium with the surrounding medium. This is an attractive suggestion, since GMCs are self-gravitating and could be stable over timescales of years. However, as we have noted above, there is virtually no correlation between host galaxy morphology and the distribution of the gas in the EELR for 4C 37.43 and similar objects; in these cases, the quasar cannot simply be “lighting up” in situ interstellar clouds. The brightest emission regions around 4C 37.43 are mostly at projected distances of kpc, where one would not normally expect to find dense molecular clouds. Furthermore, strong extended emission is not the norm in QSOs, even amongst the steep-radio-spectrum classical double sources for which it is statistically more likely. Why do a few objects like 4C 37.43 have such prolific displays of extended emission, while the majority of apparently similar objects show little or none? As we have previously noted (Stockton & MacKenty, 1987), there is an apparent correspondence between the incidence of strong extended emission among QSOs and the presence of overt signs of strong interaction, such as close companion galaxies and tails or bridges seen in continuum emission. This is certainly true in the case of 4C 37.43, where the continuum asymmetry and bridge- or tail-like structure to the east strongly suggest a recent merger. One might therefore suppose that GMCs could have been tidally ejected to large distances and out of the plane of the original disk in which they were formed. But GMCs are sufficiently dense that their trajectories should not be significantly affected by hydrodynamic interaction with the ambient gas, and they should follow essentially the same paths the stars do. Once again, the general lack of correspondence between the continuum and emission-line morpholgies in 4C 37.43 argues against this scenario.
Because the high-density clouds cannot be confined by external pressure, and gravitational confinement seems unlikely, they have probable lifetimes of years. It therefore seems likely that they must be continuously regenerated by shocks. If so, it remains a possibility that the shocks responsible for the dense regions are simply due to collisions of sheets of gas during the merger (Stockton, 1990). The velocities of up to 700 km s-1 that we see are a significant, but perhaps not completely fatal, objection to this picture. It is quite possible that much of the extended ionized gas we see was originally ejected from one or both of the galaxies by tidal forces during the merger. However, it now seems likely to us that the origin of the shocks needed to produce the high-density clouds is an indirect result of the merger: a starburst-driven galactic superwind.
Virtually all ultra-luminous infrared galaxies (ULIGs) are starbursts triggered by major mergers (e.g., Sanders & Mirabel, 1996). At least some significant fraction of these also have QSO nuclei (e.g., Lutz, Veilleux, & Genzel, 1999), which must also have been triggered by the merger (Canalizo & Stockton, 2001). The ULIG phase can dominate the IR emission for up to Myr (Canalizo & Stockton, 2001); if the QSO has a lifetime greater than this, some objects identified as “ordinary” QSOs (i.e., those with no evidence of excessive FIR emission) will have previously been ULIGs as well. One of the consequences of a vigorous starburst is a galactic superwind (Heckman, 2001, and references therein), which will interact with the surrounding medium and particularly with any tidally ejected gas. This superwind provides a mechanism for producing shocked gas, potentially at large distances from the QSO666This possibility was first mentioned to us by Mike Dopita.. It also may be responsible for entraining any ambient cool gas (including that possibly ejected during the encounter) and controlling both its location and its velocity. This picture is consistent with both the distribution and the velocities of the ionized gas we see in 4C 37.43. The main emission regions are found at roughly the same projected distances to the east and west of the quasar, and knots of emission are arranged along linear or arc-like structures roughly perpendicular to the direction to the quasar, which plausibly correspond to surfaces of the expanding bubbles. As can be seen from Fig. 7, the bulk of the gas in the most luminous emission regions has projected velocities between about and km s-1. There are similar positive velocities in regions with weaker emission; also in weaker-emitting regions, there are negative velocities ranging up to km s-1. The predominance of negative velocities could simply be due to chance: the uneven distribution of the gas (particularly if it is mostly tidal debris), coupled with the illumination pattern of the UV continuum from the quasar. However, if the velocities have a significant outflow component, a bias towards negative velocities could also be a natural consequence of screening by dust blown out by a superwind. Also, the tendancy for the highest velocities to be found amongst the weaker-emitting components is consistent with the expectation that initially less dense and less massive clouds would be accelerated to higher velocities.
Furthermore, of the dozen most luminous EELRs in the survey of low-redshift QSOs by Stockton & MacKenty (1987) (including, of course, that of 4C 37.43), two are known to be associated with QSOs having ultraluminous IR host galaxies having confirmed starburst or recent post-starburst stellar populations (3C 48, Canalizo & Stockton 2000a; Mrk 1014, Canalizo & Stockton 2000b). This association lends support to a connection between the EELR and starburst activity. Canalizo & Stockton (2001) have suggested that QSOs that are also powerful radio sources, such as 3C 48, can break through a dust cocoon associated with the starburst more rapidly than can most radio-quiet QSOs, allowing the central UV source to illuminate and photoionize the extended gas early on. If this is true, it could explain why the most luminous EELRs are associated with powerful extended radio sources (Boroson & Oke, 1982, 1984; Stockton & MacKenty, 1987).
5 Summary
The observations presented here have given us the clearest view yet of an extended emission region around a quasar. The HST WFPC2 imaging in the [O III] emission line shows the first clear evidence of an ionization cone on the east side of the quasar and confirms the presence of very high surface brightness emission west of the quasar. Much of the emission is arrayed in linear or arc-like structures, many of which appear to lie about 4″ from the quasar and to be centered on it. The spectrum of the bright emission complex is consistent with photoionization by the quasar, provided that the region comprises two main components, both having metallicities around 1/3 solar: (1) a low-density ( cm-3) gas with essentially unity filling factor, and (2) a high-density ( cm-3) gas with a very low () filling factor and distributed in thin ( pc) filaments or sheets. The very short ( year) lifetimes of these dense regions suggest their origin in shocks. From the spectroscopic and imaging evidence, together with our knowledge that at least some QSOs have gone through a strong starburst phase as a result of major mergers, we believe that it is quite likely that such shocks are consequences of superwinds driven by a recent starburst in the quasar host galaxy.
References
- Bahcall et al. (1993) Bahcall, J., et al. 1993, ApJS, 87, 1
- Bergeron & Durret (1987) Bergeron, J., & Durret, F. 1987, A&A, 184, 93
- Binette, Wilson, & Storchi-Bergmann (1996) Binette, L., Wilson, A. S., & Storchi-Bergmann, T. 1996, A&A, 312, 365
- Binette et al. (1993) Binette, L., Wang, J., Villar-Martin, M., Martin, P. G., & Magris C., G. 1993, ApJ, 414, 535
- Block & Stockton (1991) Block, D. L., & Stockton, A. 1991, AJ, 102, 1928
- Boroson & Oke (1982) Boroson, T. A., & Oke, J. B. 1982, Nature, 296, 397
- Boroson & Oke (1984) Boroson, T. A., & Oke, J. B. 1984, ApJ, 281, 535
- Boroson et al. (1985) Boroson, T. A., Persson, S. E. & Oke, J. B. 1985, ApJ, 293, 120
- Canalizo & Stockton (2000a) Canalizo, G., & Stockton, A. 2000a, ApJ, 528, 201
- Canalizo & Stockton (2000b) Canalizo, G., & Stockton, A. 2000b, AJ, 120, 1750
- Canalizo & Stockton (2001) Canalizo, G., & Stockton, A. 2001, ApJ, 555, 719
- Cardelli et al. (1989) Cardelli, J. A., Clayton, G. C., & Mathis, J. S. 1989, ApJ, 345, 245
- Crawford & Vanderriest (2000) Crawford, C. S., & Vanderriest, C. 2000, MNRAS, 315, 433
- Dopita & Sutherland (1995) Dopita, M. A., & Sutherland, R. S. 1995, ApJ, 455, 468
- Durret et al. (1994) Durret, F., Pécontal, E., Petitjean, P., & Bergeron, J. 1994, A&A, 291, 392
- Fabian et al. (1987) Fabian, A. C., Crawford, C. S., Johnstone, R. M., & Thomas, P. A. 1987, MNRAS, 228, 963
- Fruchter & Hook (1997) Fruchter, A. S., & Hook, R. N. 1997, in Applications of Digital Image Processing XX, ed. A. Tescher, Proc. SPIE, 3164, 120
- Heckman (2001) Heckman, T. M. 2001, ASP Conf. Ser., 240, 345
- Hickson & Hutchings (1987) Hickson, P., & Hutchings, J. B. 1987, ApJ, 312, 518
- Hook & Lucy (1993) Hook, R. N., & Lucy L. B. 1993, ST-ECF Newsletter 19, 6
- Hook et al. (1994) Hook, R. N., Lucy L. B., Stockton, A., & Ridgway, S. E. 1994, ST-ECF Newsletter 21, 16
- Kormendy & Freeman (1998) Kormendy, J., & Freeman, K. C. 1998, BAAS, 30, No. 4, 21.05
- Laor et al. (1994) Laor, A., Fiore, F., Elvis, M., Wilkes, B. J., & McDowell, J. C. 1994, ApJ, 435, 611
- Lutz, Veilleux, & Genzel (1999) Lutz, D., Veilleux, S., & Genzel, R. 1999, ApJ, 517, L13
- Massey et al. (1988) Massey, P., Strobel, K., Barnes, J. V., & Anderson, E. 1988, ApJ, 328, 315
- Mateo (1998) Mateo, M. 1998, ARA&A, 36, 435
- Miller, Rawlings, & Saunders (1993) Miller, P., Rawlings, S., & Saunders, R. 1993, MNRAS, 263, 425
- Oke et al. (1995) Oke, J. B., et al. 1995, PASP, 107, 375
- Osterbrock (1989) Osterbrock, D. E. 1989, Astrophysics of Gaseous Nebulae and Active Galactic Nuclei, Mill Valley, California: University Science Books
- Richstone & Oke (1977) Richstone, D. O., & Oke, J. B. 1977 ApJ, 213, 8
- Robinson et al. (2000) Robinson, T. G., Tadhunter, C. N., Axon, D. J., & Robinson, A. 2000, MNRAS, 317, 922
- Sanders & Mirabel (1996) Sanders, D. B. & Mirabel, I. F. 1996, ARA&A, 34, 749
- Schlegel et al. (1998) Schlegel, D. J., Finkbeiner, D. P., & Davis, M. 1998, ApJ, 500, 525
- Stockton (1973) Stockton, A. 1973, Nature, 246, 25
- Stockton (1976) Stockton, A. 1976, ApJ, 205, L113
- Stockton (1978) Stockton, A. 1978, ApJ, 223, 747
- Stockton (1986) Stockton, A. 1986, Ap&SS, 118, 487
- Stockton (1990) Stockton, A. 1990, in Dynamics and Interactions of Galaxies, ed. R. Wielen, (Springer-Verlag: Berlin), 440
- Stockton & Canalizo (2000) Stockton, A., & Canalizo, G. 2000, ASP Conf. Ser., 195, 385
- Stockton & MacKenty (1987) Stockton, A., & MacKenty, J. W. 1987, ApJ, 316, 584
- Trentham et al. (2001) Trentham, N., Möller, & Ramirez-Ruiz, E. 2001, MNRAS, 322, 658
- Viegas & Prieto (1992) Viegas, S. M., & Prieto, M. A. 1992, MNRAS, 258, 483
- Wampler et al. (1975) Wampler, E. J., Burbidge, E. M., Baldwin, J. A., & Robinson, L. B. 1975, ApJ, 198, L52