Westphal-MMD11: An interacting, submillimeter luminous Lyman break galaxy
Abstract
We present new Hubble Space Telescope, high-resolution optical imaging of the submm luminous Lyman-break galaxy, Westphal-MMD11, an interacting starburst at . The new imaging data, in conjunction with re-analysis of Keck optical and near-IR spectra, demonstrate MMD11 to be an interacting system of at least three components: a luminous blue source, a fainter blue source, and an extremely red object (ERO) with 6. The separations between components are 8 kpc (, , h=0.65), similar to some of the local ultra-luminous infrared galaxies (ULIGs). The lack of obvious AGN in MMD11, along with the fragmented, early stage merger morphology, suggest a young forming environment. While we cannot unambiguously identify the location of the far-IR emission within the system, analogy to similar ULIGs suggests the ERO as the likely far-IR source. The 1012 L⊙ bolometric luminosity of MMD11 can be predicted reasonably from its rest frame UV properties once all components are taken into account, however this is not typically the case for local galaxies of similar luminosities. While LBGs as red in and as MMD11 are rare, they can only be found over the restricted range. Therefore a substantial number of MMD11-like galaxies (0.62 arcmin-2) may exist when integrated over the likely redshift range of SCUBA sources (), suggesting that SCUBA sources should not necessarily be seen as completely orthogonal to optically selected galaxies.
Subject headings:
cosmology: observations — galaxies: evolution — galaxies: formation — galaxies: starburst1. Introduction
Our understanding of the blank field submillimeter (submm) sources, their diversity, and their connection to optically selected galaxies has had a slow progression since their discovery by Smail, Ivison & Blain (1997). The few sources with well studied properties come mostly from the lensed surveys of Smail et al. (2002), and have been restricted to the small fraction with relatively bright and obvious optical counterparts. Only one of these does not contain the signatures of an AGN (SMM J14011+0252 – Ivison et al. 2001, 2000). While the identification of submm sources has thus far only been successful for the brightest optical counterparts and the strongest emission line spectra, none of the emission lines are all that strong compared to purely star forming objects, and it is as yet unclear what the relative proportion of AGN is for submm sources. This bright counterpart bias also manifests itself in the redshift distribution of submm sources. While photometric studies place the median redshift for the submm sample at (Smail et al. 2000, Archibald et al. 2001), no submm selected galaxy has yet been spectroscopically identified with redshift higher than .
Westphal-MMD11 (hereafter MMD11) remains amongst the highest spectroscopically confirmed redshift submm sources () which are thought to be exclusively starbursting galaxies. Targeted submm observations of rare, luminous AGN at have however yielded detections since early single bolometer observations (Hughes et al. 1997, summarize the state of submm detections with pre-SCUBA instruments; Archibald et al. 2001, Carilli et al. 2001, Willott et al. 2001 have demonstrated the high frequency of high AGN detection in the submm). Ironically, MMD11 was discovered originally, not through its copious submm emission, but as a Lyman-break galaxy (LBG – Steidel, Pettini & Hamilton 1995). MMD11 was isolated as a candidate LBG with very high star formation rate (SFR), its rest frame UV properties suggesting several hundred M⊙/yr, and its is the reddest color for the observed LBG sample (Shapley et al. 2001). The submm detection validated the UV-based predictions, showing that this is an ultraluminous IR galaxy (ULIG) with a far-IR luminosity of L⊙, implying a SFR 103 M⊙/yr. The detailed properties of this source have prompted successful submm detection of other LBGs (Chapman et al. 2000b).
However, LBGs have been difficult to consistently detect in the submm. Work by Chapman et al. (2000a), Adelberger & Steidel (2000), Peacock et al. (2000), Eales et al. (2000), van der Werf et al. (2000), Sawicki (2001), Baker et al. (2001), Webb et al. (2002) has suggested that the direct overlap between the SCUBA and LBG populations is small and that potential overlap may be difficult to predict from knowledge of UV characteristics. Therefore, an unresolved issue is the overlap between submm selected and optically selected galaxy populations, with MMD11 remaining an enigmatic bridge. Attempts to model the properties of MMD11 led to apparently contradictory pictures. The galaxy shows an unremarkable optical spectrum for a ULIG with three times the bolometric luminosity of Arp220 (Chapman et al. 2000a). In the near-IR, it shows narrower nebular line widths than the median LBG (Pettini et al. 2001), but is not unusual in the line ratio diagnostics. MMD11 has broad-band colors that cannot be simultaneously fit in both the UV/optical and near-IR with synthetic spectral templates; adding sufficient dust to the template to match the , , photometry produces an increased extinction at shorter wavelengths resulting in an underestimate of the UV/optical bands. The broad band photometry is therefore best fit by the superposition of a blue, relatively unobscured galaxy coupled with a young, dusty galaxy (Shapley et al. 2001).
In this paper we present new Hubble Space Telescope optical imaging of MMD11, using existing Keck spectroscopy and near-IR imaging to elucidate the high resolution HST data. All calculations assume a , cosmology, with h=0.65 providing a scale of 1″ = 8.31 kpc at .
2. Observations and Results
2.1. HST-Visible and Keck-NearIR observations
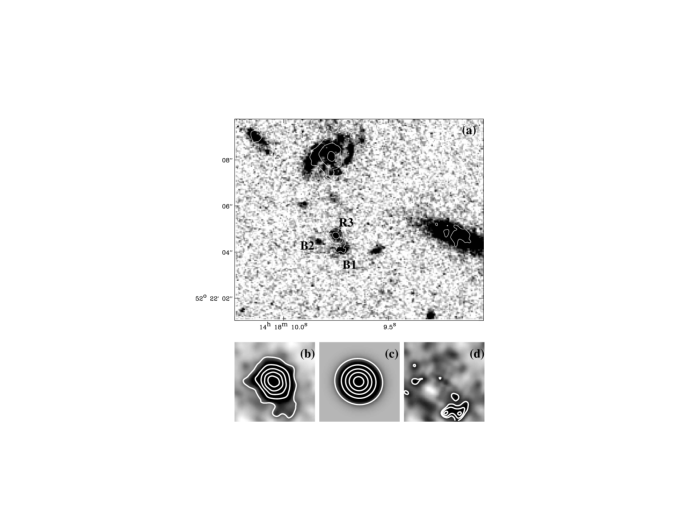
HST imaging was obtained through a Cycle 10 program with the Space Telescope Imaging Spectrograph (STIS) to study the morphologies of submm luminous galaxies. One orbit of integration time, giving 1170 sec of LOW SKY observation, was split between two exposures, using the -clear filter. The pipeline processed frames were calibrated, aligned, and cosmic ray rejected, using standard IRAF/STSDAS routines. The pixel size in the STIS image is 0.0508″/pixel. The sensitivity limit reached is (5), corresponding to for a point source with a late-type spiral galaxy SED. The -clear filter is roughly a gaussian with 1840Å halfwidth and a pivot wavelength of 5733.3Å, and we refer to the associated AB magnitude as . Near-IR observations in 0.4″ -band seeing were obtained with the Near-InfraRed Camera (NIRC) on the Keck I telescope in the , , and -bands, as described originally in Shapley et al. (2001). The STIS image is presented in Fig. 1a with -band contours overlaid. The limiting magnitude in a 1.5″ aperture is 22.1, 5.
The relative astrometry was ascertained in the images by smoothing the STIS image to the resolution and matching all sources except MMD11. After, maximimizing the cross-correlation signal between frames, the r.m.s. of the match between the optical and infrared sources is 0.16″. While ground based optical imaging with ″ seeing identified only an unresolved source (Shapley et al. 2001), our STIS imaging uncovers three distinct components with intervening low surface brightness emission in the MMD11 region, identified as , , and . The component separations are: =1.13″, =0.71″, =0.74″. A 2.5″ aperture subsuming all three components and intervening structure measures =24.03, whereas the sum of the three component measurements in 0.4″ apertures amounts to =24.54, or 63% of the total flux (, , ). We therefore see a significant portion of the total flux from MMD11 is emitted in low surface brightness regions between the compact components. Component has close to half the =24.54 measurement for the triplet, with and having respectively 1/6 and 1/3. The R3 component is resolved by STIS, but is quite compact and isolated with a half light radius of 0.2″. B1 on the other hand is morphologically complex, with low surface brightness emission extending to relatively large radius.
The near-IR images of MMD11 are all nearly unresolved, and of high enough resolution to identify their location amongst the STIS components. The peaks of the bright , , and sources all align to within 0.2″ with the component labeled , and all 3 bands show an extension towards the STIS-identified blue component, . The -band image has the best seeing (″), and a faint source is visible at the position of . A point source fit to the bright R3 component is subtracted (Fig. 1b) and an aperture measurement at with with matched 0.5″ diameter shows , suggesting a plausible infrared counterpart to the bright optical LBG with , close to the median for the LBG sample of (Shapley et al. 2001). We conclude that the optically bright component and the near-IR bright component (Shapley et al. 2001) are two distinct parts of an interacting system. We note that MMD11 displays a striking difference between its rest-frame UV and Visible emission (a morphological k-correction), seen only rarely in more local galaxies (Hibbard & Vacca (1997) Abraham et al. (1999), Kuchinski et al., 2001, Windhorst et al. 2002).
2.2. Spectroscopic observations
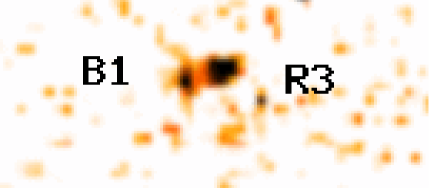
Keck, Low Resolution Imaging Spectrograph (LRIS) and NIRSPEC observations were obtained for MMD11. By chance, the slit alignments on both LRIS and NIRSPEC were such that we find evidence for redshifts of the 3 components labeled in Fig. 1. The reductions of the spectra are described in Pettini et al. (2001). With NIRSPEC, the de-rotator was not functioning during the observation, and the slit rotates in time, starting at zero degrees (North) and rotating through to deg (West of North). While a source with a strong continuum is always present in the 2D spectra, a second source appears to rotate in and out of the 1″ slit with time, having a strong [Oiii]5007 emission line at the same redshift as the bright -band source, but no detected continuum (Fig. 2). The separation of the two components is ″, similar to the separation of either or seen in the STIS image. There remains some abiguity as to whether the second source lacking continuum is or , or both at different times. Analysis of the two components in the NIRSPEC spectrum indicates that they have roughly equal [OIII]5007 flux. While H and [OIII]4959 are also visible in bright -band source, there are no other lines visible for the off-continuum component. [OIII]4959 in particular lies in a much noiser region of the -band window than [OIII]5007, and is only just detected in the brighter component.
The LRIS slit was aligned with the brightest -band peak, which we now identify as STIS-. Close inspection of the LRIS image suggests that a spatially extended or double Ly line lies on the slit, with an apparent extention of ″. The slit is aligned North/South, and the extension of the line has no continuum associated. We conclude that the red source, STIS-, was also present on the slit with detected Ly.
2.3. Submillimeter and Radio Observations
SCUBA observations at 850 m and 450 m were taken during an observing runs in 1998. Reductions and measurements from the data were presented in Chapman et al. (2000a). The photometry detection at 850 m measured mJy. MMD11 has also been detected at 1200m at IRAM (A. Baker, private communication). VLA radio observations were obtained in A-configuration at 1.4 GHz. These observations were made available to us to search for a radio counterpart to the submm source in order to pinpoint the location of the far-IR emission. The reductions and details are described elsewhere (M. Yun et al. in preparation). No significant emission is detected at the optical source position, or within the SCUBA beam, and we place a 3= 75Jy limit on the 1.4 GHz flux.
3. Analysis and Discussion
While early modeling efforts for MMD11 did not result in any conclusive picture, our deep STIS imaging in conjunction with the Keck spectra and near-IR imaging have revealed the source to be composed of at least three distinct components (Figs. 1,2) lying at the same redshift. The component represents an ERO with generating the bulk of the near-IR emission, and can naturally be fit with a dusty template SED. By subtracting a point source fit to the -band R3, we have also measured the flux from B1, resulting in , a value fairly typical of LBGs. However, a template SED fit to an ERO at requires a large amount of extinction using the Calzetti dust law (Calzetti 1997), as found even for the average properties of LBGs like MMD11 in Shapley et al. (2001). For MMD11 in particular, this would imply an unphysically large star formation rate, dwarfing the submm implied 600 M⊙ yr-1 (Chapman et al. 2000a), as even the ERO component has 1/5 the total system flux at -band (translating to an uncorrected SFR of M⊙ yr-1). In addition, the large bandwidth of the STIS filter precludes accurate constraints on the optical SED for the various components. We simply conclude that the majority of the near-IR emission emminates from the component.
With such disparate broadband and morphologocial properties between components, it is surprising that the from different components are roughly equal in intensity (EWλ is of course very different). We assume that the similarities occur only by chance.
While we have elucidated the optical and near-IR structure of MMD11 significantly with our high resolution imaging and spectroscopy, we would like to identify precisely the location and nature of the intense far-IR emission within the system. Our radio data is not deep enough to pinpoint the far-IR emission within MMD11, although it should have detected a buried AGN component if present. The upper limit (SJy), is still within the error bounds of the median expected flux relation for the submm measurement (30 Jy – using Carilli & Yun 2000). The luminosity limit (2.001022 W/Hz, assuming a radio spectral index of ) is a factor 10 to 100 less than radio quiet quasars studied by Kukula et al. (1998). The LRIS spectrum of MMD11 shows no evidence for narrow (Type II AGN) or broad (Type I AGN) emission lines. The Ly profile, known for both B1 and R3, has a total equivalent width of zero considering both the emission and absorption. The Ly emission line EW is only 6Å in the rest frame, which is weak compared with the Ly emission EW distribution of LBGs (Steidel et al. 1999). For component R3, the H line is narrow, and the [OIII]/H ratio is consistent with a starburst. Therefore the spectroscopic data can be used to place strong limits on the AGN contribution to MMD11.
While we have no way to directly assess the location or extent of the far-IR emission, other ULIG systems often show submm emission arising in the ERO galaxy component, while the bulk of the optical emission remains relatively unobscured in bluer companions. The only submm-selected source identified with a pure starburst nature is SMM14011-0252. This galaxy was recently characterized with a similar multi-component structure (Ivison et al. 2001), encompassing an ERO separated by 1.5″ from each of two luminous bluer sources, the far-IR emission apparently localized near the ERO from the radio and CO gas (Frayer et al. 1999, Ivison et al. 2000). MMD11 has a similar far-IR luminosity to SMM14011-0252, which has a cluster lensing corrected SCUBA flux of 5.0 mJy and a redshift of , although the CO(3-2) measurement would not have been possible without the 2.5 lensing factor. A similar multi-component configuration with the radio/far-IR identified to an ERO is also seen in two 1 SCUBA-detected ULIGs from the ISO/FIRBACK survey (Chapman et al. 2002a).
Both MMD11 and SMM14011-0252 appear morphologically to be examples of the early stage merger type of ULIG (Goldader et al. 2001), prevalent in % of the local ULIG population whereby luminous components are separated by kpc. These sources are in some sense equally well identified from their submm/far-IR or UV properties. While this class of system appears relatively common in SCUBA identifications, it is as yet unclear whether this is because these sources were the easiest to identify of the submm population, or because submm galaxies are typically made in different ways than local ULIGs, such early stage mergers being much more common at high-. Recent work with HST has suggested the merger rate in the past being higher by a factor (1+)2.5 (Le Fevre et al. 2000).
While MMD11 is clearly similar in many respects to ULIGs at more recent cosmic epochs, it remains difficult to relate MMD11 to the rest of the LBG population. Most of the LBGs can be consistently fit from - through -band with a single SED model (Shapley et al. 2001). However, the reddest LBGs have significant far-IR/submm emission as a group, and another LBG with has been detected with SCUBA (Chapman et al. 2000b). It is therefore reasonable to hypothesize that the most bolometrically luminous tail of the LBG population extends into the ULIG/SCUBA population.
When considered as a complete system (all components included), both MMD11 and SMMJ14011 appear to lie roughly on the local far-IR/UV versus UV continuum slope relation for local IUE starburst galaxies (Meurer et al. 1999 – FIX/ relation). However, we have seen that the regions generating the UV and far-IR are likely to be physically separated by kpc, and it might be expected that the predictive qualities of FIX/ are likely to be haphazard and orientation-dependent. We must thus consider why these two galaxies balance in energy output between the UV and far-IR well enough for the prediction to work. MMD11 is quite luminous, even without any extinction correction; the SFR calculated from LUV is 20 M⊙/yr. In addition, the total MMD11 system is, by UV color, very red, which explains why it was flagged as a submm-bright candidate with a predicted S mJy, in the absense of knowledge about the color (MMD11 would not have been selected for submm followup had it been truly unobscured). Systems like MMD11 and SMMJ14011 may therefore suggest that an LBG with a luminous, relatively red, UV component could imply an associated bolometrically luminous system. In other words, the existence of a bright, reddened UV structure makes it causally more likely that there is a bolometrically bright and heavily obscured component lurking nearby. It is not clear that either SMMJ14011 or MMD11 are necessarily accidents just because they have multiple components with different amounts of UV attenuation. In this context, the FIX/ relation can be interpreted as mapping bolometrically luminous galaxies to dustier configurations, and even the parts that are able to leak out in the UV will tend to be reddened more so than if the object were dust-free.
The FIX/ relation holds for the local LIG/starburst population (L L⊙), despite the UV and far-IR bright components often being spatially distinct. By contrast, this is not a typical property of ULIGs ( more far-IR luminous than the LIGs and IUE starbursts), or even the early stage merger subset of the ULIGs, which are generally many times over-luminous in the far-IR compared to the predicted UV energy absorbed. From the ULIG sample of Goldader et al. (2002), only one other galaxy, IRAS 22491, appears to obey the FIX/ relation. However, the LBGs have greater characteristic luminosities for a given farIR/UV ratio than local galaxies, suggesting that LBGs are less obscured per unit luminosity than lower redshift starforming galaxies (Adelberger & Steidel 2000, Chapman et al. 2000b). This suggests that LBGs are typically more similar to the less luminous LIG/starburst population locally than the ULIGs.
LBGs as red as MMD11, in both and , are rare (5%, or 0.05 arcmin-2). However, the statistics for such sources are poor since the LBG survey could only have found objects like MMD11 (i.e., instrinsically red in the UV) over a very restricted redshift range, (at higher redshifts MMD11 would have been too red in to have remained in the sample). Therefore, when integrated over the likely redshift range of SCUBA sources (), there may be a substantial number of MMD11-like galaxies (0.62 arcmin-2 for our adopted -cosmology), suggesting that SCUBA sources should not necessarily be seen as completely orthogonal to optically selected galaxies. While the conclusions extrapolated from MMD11 may be a misleading effect of small number statistics, the finding is not necessarily inconsistent with the current state of followup to blank field and radio-identified submm sources (e.g., Smail et al. 2002, Chapman et al. 2002b, Ivison et al. 2002). These studies reveal a broad range in optical properties for the SCUBA population. At least in part this may be explained because some of the submm galaxies comprise both obscured and unobscured interacting components like MMD11 and SMM14011-0252.
References
- (1)
- (2) Abraham, R. G., Ellis, R. S., Fabian, A. C., Tanvir, N. R., & Glazebrook, K. 1999, MNRAS 303, 641
- (3)
- (4) Adelberger K., Steidel C., 2000, ApJ, 544, 218
- (5)
- (6) Archibald, E., et al., 2001, MNRAS, 323, 417
- (7)
- (8) Baker, A., Lutz, D., Genzel, R., Tacconi, L. J., Lehnert, M. D., 2001, A&A, 372, 37
- (9)
- (10) Calzetti, D., 1997, AJ, 113, 162
- (11)
- (12) Carilli, C. L., et al, 2001, ApJ, 555, 625
- (13)
- (14) Carilli, C. L. & Yun, M. S. 2000, ApJ, 539, 1024
- (15)
- (16) Chapman, S. C., Scott, D., Steidel, C., et al., 2000a, MNRAS, 319, 318
- (17)
- (18) Chapman, S. C., Scott, D., Borys, C., Halpern, M., 2000b, astro-ph/0009152
- (19)
- (20) Chapman, S. C., Smail, I., Ivison, R., Helou, G., Dale, D., Lagache, G., 2002a, ApJ, in press, astro-ph/0203068
- (21)
- (22) Chapman, S. C., Barger, A., Cowie, L., et al., 2002b, ApJ, submitted
- (23)
- (24) Eales, S., Lilly, S., Webb, T., Dunne, L., Gear, W., Clements, D., Yun, M., 2000, AJ, 120, 2244
- (25)
- (26) Goldader J., Meurer G., Heckman T., Seibert M., Sanders D., Calzetti D., Steidel C., 2002, ApJ, in press, astro-ph/0112352
- (27)
- (28) Frayer, D., Ivison, R. J., Scoville, N. Z., Evans, A. S., Yun, M. S., Smail, Ian, Barger, A. J., Blain, A. W., Kneib, J.-P., 1999, ApJ, 514, 13
- (29)
- (30) Hibbard, J. E., & Vacca, W. D. 1997, AJ 114, 1741
- (31)
- (32) Hughes, D., Dunlop, J., Rawlings, S., 1997, MNRAS, 289, 766
- (33)
- (34) Ivison, R., et al., 2000, MNRAS, 315, 209
- (35)
- (36) Ivison, R., Smail, I., Frayer, D., Kneib, J.-P., Blain, A.W., 2001, ApJL, 561, L45
- (37)
- (38) Ivison, R., et al., 2002, MNRAS, submitted
- (39)
- (40) Kukula, M., et al., 1998, MNRAS, 297, 366
- (41)
- (42) Kuchinski, L. E., Madore, B. F., Freedman, W. L., Trewhella, M., 2001, AJ, 122, 729
- (43)
- (44) Le F vre, O., Abraham, R., Lilly, S. J., Ellis, R. S., Brinchmann, J., Schade, D., Tresse, L., Colless, M., Crampton, D., Glazebrook, K., Hammer, F., Broadhurst, T., 2000, MNRAS, 311, 565
- (45)
- (46) Meurer, G.R., Heckman T.M., Calzetti D., 1999, ApJ, 521, 64
- (47)
- (48) Peacock, J., et al., 2000, MNRAS, 318, 535
- (49)
- (50) Pettini, M., et al., 2001, ApJ, 554, 981
- (51)
- (52) Sawicki, M., 2001, AJ, 121, 2405
- (53)
- (54) Shapley, A., Steidel, C., Adelberger, K., Dickinson, M., Giavalisco, M., Pettini, M., 2001, ApJ, 562, 95
- (55)
- (56) Smail, I., Ivison, R.J., Blain, A.W., 1997, ApJ 490, L5
- (57)
- (58) Smail, I., Ivison, R.J., Owen, F., Blain, A.W., Kneib, J.-P., 2000, ApJ, 528, 612
- (59)
- (60) Smail, I., Ivison, R.J., Blain, A.W., Kneib, J.-P., MNRAS, 2002, ApJ in press, astro-ph/0112100
- (61)
- (62) Steidel, C., Pettini, M., Hamilton, D., 1995, AJ, 110, 2519
- (63)
- (64) Steidel C., Adelberger K., Giavalisco M., Dickinson M., Pettini M., 1999, ApJ, 519, 1
- (65)
- (66) Webb, T., et al., 2002, ApJ, submitted
- (67)
- (68) van der Werf, P., et al., 2000, astro-ph/0011217
- (69)
- (70) Willott, C., Rawlings, S., Archibald, E., Dunlop, J., 2002, MNRAS, in press, astro-ph/0111559
- (71)
- (72) Windhorst, R., et al., 2002, ApJS, in press, astro-ph/0204398
- (73)