The Kinematics and Metallicity
of the M31 Globular Cluster
System
Abstract
With the ultimate aim of distinguishing between various models describing the formation of galaxy halos (e.g. radial or multi-phase collapse, random mergers), we have completed a spectroscopic study of the globular cluster system of M31. We present the results of deep, intermediate-resolution, fibre-optic spectroscopy of several hundred of the M31 globular clusters using the Wide Field Fibre Optic Spectrograph (WYFFOS) at the William Herschel Telescope in La Palma, Canary Islands. These observations have yielded precise radial velocities ( km s-1) and metallicities ( dex) for over 200 members of the M31 globular cluster population out to a radius of 1.5 degrees from the galaxy center. Many of these clusters have no previous published radial velocity or [Fe/H] estimates, and the remainder typically represent significant improvements over earlier determinations. We present analyses of the spatial, kinematic and metal abundance properties of the M31 globular clusters. We find that the abundance distribution of the cluster system is consistent with a bimodal distribution with peaks at and . The metal-rich clusters demonstrate a centrally concentrated spatial distribution with a high rotation amplitude, although this population does not appear significantly flattened and is consistent with a bulge population. The metal-poor clusters tend to be less spatially concentrated and are also found to have a strong rotation signature.
1 Introduction
The mechanisms involved in galaxy formation remain one of the major unsolved problems in astronomy. Over the past several decades, various groups have proposed a range of models which endeavor to explain the observed properties of galaxies and their globular cluster systems (GCSs). One early formation model from Eggen, Lynden-Bell, & Sandage (1962) argues for a single, large-scale collapse of material to form galactic bodies such as the Milky Way. A principal competing model maintains that formation has occurred through random mergers of fragmented gas clouds over the course of billions of years, implying a hierarchical origin (Searle & Zinn, 1978; Cole et al., 2000). In order to interpret the bimodality seen in the globular cluster metallicity and color distributions of many galaxies (Ashman & Zepf, 1998), additional scenarios have been put forth such as multiphase in situ formation (Forbes, Brodie, & Grillmair, 1997), major mergers (Zepf & Ashman, 1993) and tidal stripping/capture (Côté, Marzke, & West, 1998).
Support for the idea that the Milky Way halo formed in a hierarchical or episodic manner arises from the lack of a significant abundance gradient throughout the entire halo globular cluster population (Parmentier et al., 2000), a notable decrease in the radial component of the velocity ellipsoid of the stellar halo beyond the solar circle (Sommer-Larsen et al., 1997), and the detection of a possible spread in cluster and stellar ages within the outer halo (Sarajedini, Chaboyer, & Demarque, 1997; Rosenberg et al., 1999; Stetson et al., 1999). In addition, some studies have uncovered evidence of kinematic and chemical sub-clustering within the globular cluster population of the Andromeda galaxy which may point to accretion remnants (Ashman & Bird, 1993; Saito & Iye, 2000). However, it is possible that some degree of fragmentation might arise in an infall scenario due to thermal and gravitational instabilities within the collapsing proto-galactic gas cloud. A better understanding of the fragment properties including chronology, chemistry and, in particular, kinematics would help us to identify the origin of sub-clustering and to differentiate between the various formation models.
It has been noted often that globular clusters (GCs) provide us with ideal probes of galaxy structure and formation mechanisms. As the oldest galactic stellar systems, globular clusters hold the key to uncovering the formation record of their host environments. Correlations between chemical content (which points to chronology) and the kinematics of globular clusters allow us to investigate the early formative stages of a galaxy and, to some extent, probe its ongoing evolution.
The M31 globular cluster system provides an obvious and desirable target of observation: (i) its proximity makes it the most accessible large system outside of the Milky Way; (ii) with confirmed candidate members (Barmby et al., 2000), the M31 GCS is sufficiently populous that it provides a statistically significant sample size; (iii) unlike the Milky Way GCS, the M31 population can be observed over the full extent of the galaxy with less severe effects of line-of-sight contamination; (iv) all of the M31 clusters lie at essentially the same distance, and thus are not subject to such large individual distance uncertainties as are the Milky Way globulars. However, the proximity of M31 introduces certain issues of contamination within the cluster sample, such as a difficulty in distinguishing between GC candidates and star-forming regions in many photometric surveys. Furthermore, faint globular clusters can easily be missed against the bright galaxy background.
Previous studies of the Milky Way and M31 globular cluster systems have revealed that these two populations exhibit some remarkable similarities. Zinn (1985) found that the Galactic GCS demonstrated clear evidence for bimodality in its metallicity distribution, and proposed that it could be considered as two distinct subsystems: a flattened, metal-rich, rapidly rotating, kinematically cold disk system, and a spherical, metal-poor halo with lower net rotation and higher velocity dispersion. Signs of bimodality have been found in the M31 metallicity distribution (Ashman & Bird, 1993) and in metallicity-sensitive color distributions (Barmby et al., 2000). Separating the M31 clusters into metallicity sub-systems along the same lines as the Milky Way GCS, Huchra, Brodie, & Kent (1991) found that the metal-rich clusters within form a rapidly rotating ( km s-1) disk-like system, whereas the metal-poor clusters within this radius exhibit no net rotation. Beyond this radius, they were unable to distinguish the metal-rich from metal-poor populations on the basis of kinematics. Later studies have provided additional evidence supporting the view that M31 has a rapidly rotating system of metal-rich globular clusters (Ashman & Bird, 1993; Barmby et al., 2000).
Armandroff (1989) confirmed the presence of a modest metallicity gradient within the system of disk clusters in the Milky Way. In the first extensive spectroscopic survey of the M31 GCS, van den Bergh (1969) found no significant metallicity gradient with position but did report a wide range of abundances at any given radius. More recently, Huchra et al. (1982, 1991) and Sharov (1988) have shown that there is evidence for a weak but measurable metallicity gradient with projected radius in the M31 cluster system. A similar finding was reported by Barmby et al. (2000) based on their large sample of metal-sensitive colors. Huchra, Brodie, & Kent (1991) found a mean M31 GC metallicity of , slightly higher than that for the Milky Way.
There remains a lack of persuasive evidence that would allow us to distinguish between halo formation models — or indeed to suggest a clear hybrid of (or alternative to) the classical formation scenarios. It is clear that an extensive database of high-precision data for the kinematic and chemical tracers of a large number of host galaxies is required in order to help solve this currently intractable problem of galaxy formation. Only then can the samples be examined for clear evidence of kinematic anomalies, metallicity gradients and sub-structure which, if present, may point to the formation and enrichment processes which have occurred in the galaxy. With this objective, we present spectroscopic results for M31 cluster candidates, adding a large number of new observations to the database.
This paper will take the following form: Section 2 contains a description of the target selection and coordinate determinations. In Section 3, we provide a summary of the data acquisition and reduction procedure along with a description of the velocity and metallicity determinations. We incorporate these new results into the broader sample of available M31 cluster data to provide an analysis of the abundance distribution of the globular cluster system of our nearest large spiral galaxy neighbor in Section 4. In Section 5, we examine the kinematics of the cluster system and provide a mass estimate for the galaxy. A summary and discussion of the results of this study are presented in Section 6.
2 Target Selection and Coordinates
The list of targets was selected from the catalogue of Battistini et al. (1987), with some additional central targets from unpublished CCD photometry by J. Huchra. Cluster positions accurate to were determined from Automatic Plate Measuring (APM) scans of deep photographic plates of a area around M31. The accuracy of the APM cluster coordinates represent a marked improvement over existing M31 GCS positions, which have typically been measured to the nearest arcsecond.
Galactocentric coordinates for the GCs were computed relative to an adopted M31 central position of , (B1950):
| (1) | |||||
where and . The coordinate represents the position along the major axis of the galaxy increasing towards the north-east along the major axis. The coordinate is the distance from the major axis above and below the galactic plane, with positive values towards the north-west. The position angle (PA) of the major axis was taken to be (Kent, 1989).
Numerous groups have contributed to the identification of the globular cluster members of M31 (Hubble, 1932; Vetes̆nik, 1962; Sargent et al., 1977; Crampton et al., 1985; Battistini et al., 1980, 1987, 1993). The ultimate result of this combined effort is that most of the clusters are known by more than one name, a fact which has the potential to cause confusion. The letters preceding the identification number in the M31 cluster target names given hereafter indicate the relevant catalogue reference as provided in Table 1.
3 The WYFFOS Data
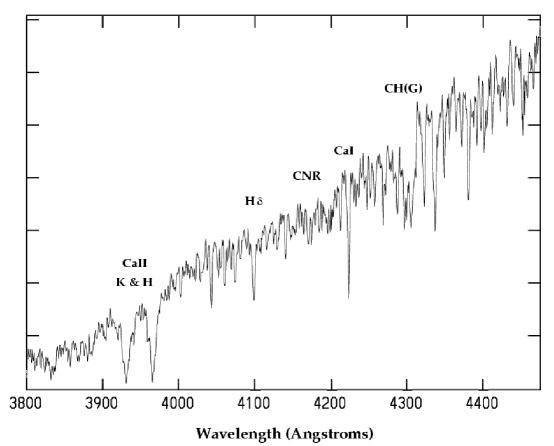
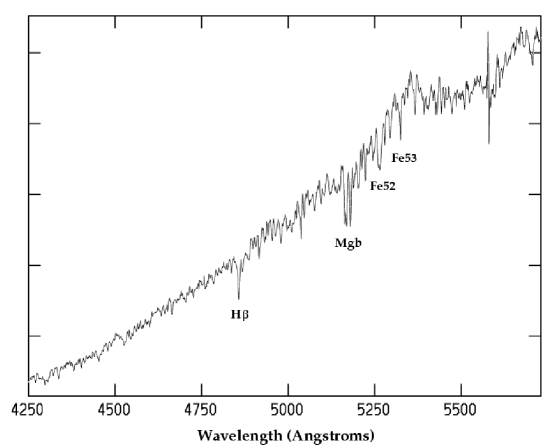
The data for this study were obtained at the William Herschel 4.2 m telescope111The William Herschel Telescope is operated on the island of La Palma by the Isaac Newton Group in the Spanish Observatorio del Roque de los Muchachos of the Instituto de Astrofisica de Canarias. (WHT) in La Palma, Canary Islands, during the nights of November 3 to 6, 1996. The WYFFOS Wide Field Fibre Optic Spectrograph (Bridges, 1998) was used with two gratings to provide a total spectral coverage of Å. The H2400B 2400-line grating yielded a dispersion of 0.8 Å/pixel and a spectral resolution of 2.5 Å over the range Å. This wavelength range was selected to investigate the CN feature at 3883 Å, the H & K lines of calcium, H, the CH G-band and the 4000 Å continuum break. The R1200R 1200-line grating observations had a dispersion of 1.5 Å/pixel and a resolution of 5.1 Å over the spectral range Å to add absorption features such as H, the Mgb triplet and two iron lines near 5300 Å.
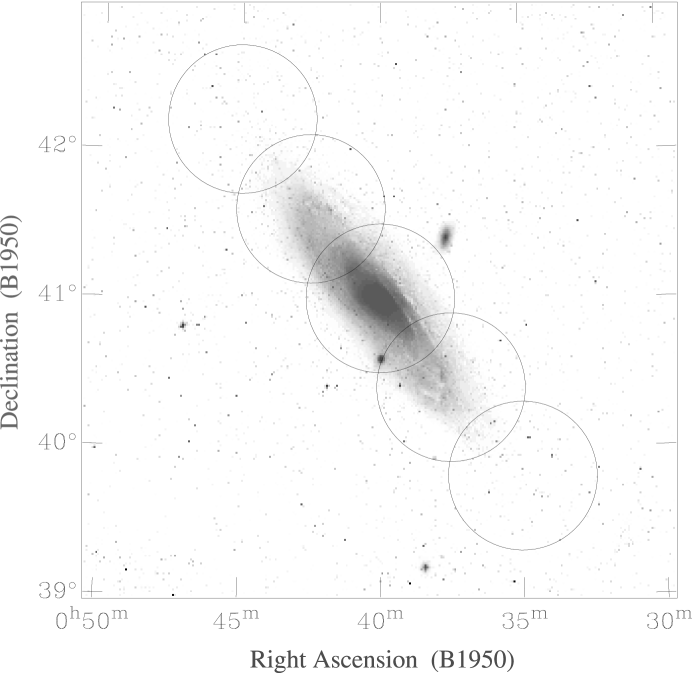
Six different fibre configurations were selected to target a total of 288 globular cluster candidates over the full extent of the major axis of M31. An overlay of the WYFFOS target fields is shown superimposed on a Digitized Sky Survey image of the galaxy in Figure 1. A record of the observations is provided in Table 2, which includes the coordinates of the field centers, observation dates and exposure times. Regrettably, minor axis fields were not observed during this run due in part to a loss of time from poor weather.
Spectra of twilight flats, argon arc lamps, and velocity template stars were also obtained during the same nights of observation as the targets. The data reduction — including fibre throughput corrections, spectral extraction, sky subtraction and wavelength calibration — was accomplished using the wyf_red WYFFOS Multi-fiber IRAF222Image Reduction and Analysis Facility, distributed by the National Optical Astronomical Observatories, which is operated by AURA under contract with the NSF. package written by Jim Lewis. Ensemble median RMS values for the wavelength calibration were typically Å for the H2400B grating images and Å for the R1200R grating.
Most of the globular clusters in the M31 fields are superimposed on a relatively bright, non-uniform background of galaxy light. For the central WYFFOS fibre configurations, roughly 20 blank-sky fibres were arranged in a regular pattern across the field to characterize the background intensity. The outer fields contained more dedicated sky fibres thanks to a lower density of targets in the area. Spectra obtained through the dedicated background sky fibres were averaged to form a composite sky spectrum which was then subtracted from each target. Attempting to match one or a few nearby sky fibres to each target spectrum (i.e. to associate the local sky level with each cluster) did not prove advantageous, since the resulting losses in signal-to-noise largely outweighed any gains in compensating for background variability even within the central fields. Examples of reduced spectra obtained using both gratings are shown in Figures 2 and 3 with the absorption features of interest labelled.
3.1 Radial Velocities
Radial velocities for the M31 globular clusters were calculated by performing standard Fourier cross-correlations of each target spectrum with the high signal-to-noise spectra of template stars of known velocity (Tonry & Davis, 1979). Two spectra were acquired for each target, obtained using each of the R1200R and H2400B gratings. Two template stars, HD12029 (K2 giant) and HD23169 (G2 dwarf), were also observed during the run to yield four cross-correlation combinations for the derivation of velocities for each cluster target. We required that each target yield a minimum of two satisfactory cross-correlations with peak values to qualify as a successful result (a result of would indicate a perfect correlation). A mean of the cross-correlation results, weighted by the associated Tonry & Davis R-value and corrected for solar motion, was used to calculate heliocentric radial velocities for a total of 202 M31 clusters candidates in the sample. The remainder represent:
-
1.
Confirmed non-clusters (foreground stars, background galaxies, HII regions, open clusters etc.) identified by spectral features grossly atypical of globular clusters or radial velocities that were significantly beyond reasonable limits for the M31 GC population ( where km s-1). The status of these objects is noted in the final column of Table 3.
-
2.
Target spectra with insufficient signal-to-noise to generate reliable velocities.
-
3.
Seven objects with inaccurate coordinates due to misidentifications or saturation on the APM scans.
The radial velocities obtained from the WYFFOS spectra are provided in Table 3. Over half (109) of the M31 GCs for which velocities were obtained had no previously published spectroscopic data. The majority of the remaining clusters (72) had published velocities with large uncertainties of km s-1, and the remainder (21) had modest to high-precision velocities with errors km s-1. The positions of the WYFFOS targets in each of these categories are shown schematically in Figure 4.
Robust fits revealed no significant differences between the velocities determined using either template object with a given grating. A comparison of the velocities calculated for a given target from the two gratings showed only slightly larger differences; the derived velocities found using the R1200R grating data, for example, were at worst km s-1 larger than those determined from the spectra obtained using the H2400B grating. An uncertainty of km s-1 is adopted here for the M31 clusters in our sample based on the RMS of the velocity deviations for 28 targets observed in multiple fields. On average, this represents an overestimate of the true uncertainty since it incorporates certain internal systematic errors as well as statistical errors.
Figure 5 shows a comparison of those radial velocities in the present study that overlap with other samples from the literature. A linear fit, weighted by the inverse square of the published velocity uncertainties, yields km s-1. Overall, there is good agreement between the WYFFOS velocities derived herein and those of other studies within the adopted errors. Encouragingly, the RMS residuals of independent fits to the separate velocity samples were particularly low for the clusters which overlap with the high-precision echelle studies of Peterson (1989: km s-1 with km s-1 for 8 objects) and Dubath & Grillmair (1997: km s-1 with km s-1 for 5 objects). Note that the only high-precision result that deviates significantly from our fit is for B29, a cluster for which Peterson (1989) notes her velocity may be incorrect. This GC was not used in the calculation of the weighted fit or RMS, and it is circled in Figure 5.
There are two other points in Figure 5 which deviate significantly from the fit, and thus deserve mention. The open diamond above the best fit line represents the M31 globular cluster B301-S22: Barmby et al. (2000) obtained km s-1, in poor agreement with the value of km s-1 measured in the current study. The Barmby et al. coordinates match well with the APM coordinates for this object as provided in Table 3, so the velocity deviation does not appear to be due to a target misidentification in either study. This cluster was also measured by Federici et al. (1993), who obtained a velocity of km s-1, in good agreement with the WYFFOS result. The Barmby et al. sample also had the largest RMS residuals in the comparison fits: km s-1 for 16 objects, not including B301-S22. The reasons for this large discrepancy are not known. The open upright triangle which deviates from the fit in Figure 5 represents B109-S170, for which Huchra, Brodie, & Kent (1991) measured a velocity of km s-1 (compared to km s-1 from the WYFFOS results). Again, the coordinates for this object match well between both studies and the deviation does not appear to be due to a target misidentification.
3.2 Absorption and Reddening Corrections
Each spectrum was corrected for the effects of atmospheric absorption and for reddening in both the Milky Way and in M31 itself. Color excess values upon which the reddening calculations are based were determined using the slope () of the continuum between Å as tabulated in Crampton et al. (1985), where available:
| (2) |
The slope parameter has been shown to be a good estimator of reddening, and is not very sensitive to cluster metallicity (Elson & Walterbos, 1988).
Targets with published colors but with no slope parameters or intrinsic color estimates were de-reddened to a typical color of for M31 globular clusters at large galactocentric radii (Crampton et al., 1985). Clusters with no values (or colors) and those for which the calculated excess values were lower than a minimum foreground color excess of (due to errors in the slope parameter or in the photometry) were assigned this minimum value (Frogel, Persson, & Cohen, 1980; Elson & Walterbos, 1988).
3.3 Abundance Determinations
To rank the M31 clusters in the WYFFOS sample by metallicity, we have measured the strengths of various absorption features in their integrated spectra. Line indices were calculated to measure the signal in a wavelength-delineated region centered on each spectral feature relative to the signal in the blue and red continuum zones flanking the feature. In light of the fact that no flux standard star spectra were obtained during the WYFFOS observing run, it was not possible to convert photon counts directly into flux for these targets. Our motivation, however, was to obtain a metallicity ranking of the globular clusters in M31; relative flux calibration was not essential as its absence will not significantly affect narrow features and mean count ratios were used instead. Our line and continuum bandpasses were defined as shown in Table 4 (Burstein et al., 1984; Brodie & Hanes, 1986; Brodie & Huchra, 1990).
Each target spectrum was shifted to zero radial velocity to define consistent line index wavelengths in the rest frame. The velocity dispersion of the M31 globular cluster system is roughly km s-1, a spread which translates into a nominal range of km s-1 in velocity. This would correspond to a wavelength shift of Å at Å, a significant fraction of the width of most of the bandpasses selected for measurement. Thus, metallicity determinations were not pursued for target spectra which had yielded no velocity cross-correlations.
The generalized feature index is defined as
| (3) |
where , and represent the mean count levels in the feature bandpass and associated continuum bandpasses and as given by (Brodie & Hanes, 1986; Brodie & Huchra, 1990). The continuum break feature is a measure of the discontinuity in the continuum due to Fraunhofer line-blanketing shortward of 4000 Å. This feature is somewhat more vulnerable to errors in the reddening and absorption corrections, as it spans a broad range in wavelength and is asymmetric.
Figure 6 shows a comparison of our line indices with published M31 globular cluster [Fe/H] values from various sources (Bònoli et al., 1987; Huchra, Brodie, & Kent, 1991; Barmby et al., 2000). The RMS differences between the line indices calculated from spectra observed in more than one field through different fibres were used to estimate the internal errors for each feature, and these are shown in the second column of Table 5. The results of linear fits in the form weighted by are provided in columns 3 and 4 of Table 5. Note that only spectroscopic metallicities for overlapping targets were considered in the calibration and hence the Bònoli et al. (1987) near-infrared photometric metallicities were not used in the fits. In column 5 of Table 5, we provide the RMS residuals of the fit and in column 6 we list the strength of the coefficient, a measure of the linear correlation between the line indices and published metallicities.
To best represent the metal abundances of the WYFFOS targets observed, a line index was selected to contribute to the calibration if it met the following four criteria:
-
1.
The uncertainties associated with the line index did not exceed of the full range of observed values. The Fe52 index did not satisfy this condition and was thus rejected from the calibration.
-
2.
The linear correlation coefficient exceeded a minimum level of .
-
3.
Numerical experimentation demonstrated that the feature strength was stable in the presence of significant changes in the adopted value of cluster reddening (e.g. in comparison with any adopted reddenings which differed from unpublished M31 values from Barmby et al. (2000)). The continuum break was found to be susceptible to reddening uncertainties and was thus rejected.
-
4.
Only one line index that characterizes a given spectral feature was incorporated in the estimate. In the case of the magnesium triplet, the indices MgG, Mg2 and Mgb all provided an acceptable measure of essentially the same absorption feature. Of these, the Mgb index demonstrated the highest correlation coefficient and a relatively low RMS uncertainty and was therefore selected for use over the others.
Line indices which met the above criteria include the CH (G-band) feature, Mgb to characterize the strength of the magnesium triplet, and the Fe53 iron line. Final cluster metallicities have been determined from an unweighted mean of the [Fe/H] values calculated from the CH(G), Mgb and Fe53 line strengths for 202 of the WYFFOS targets. These metallicities and their associated errors are provided in columns 7 and 8 of Table 3. A plot of the correlation between our [Fe/H] values and those in other samples from the literature is presented in Figure 7. The best-fit of the data in Figure 7 has a slope of and the RMS of the fit residuals is . The median value of the formal errors on our WYFFOS metallicities is dex.
3.4 The Best Current Sample
In the subsequent analysis, our results were merged with the velocities and [Fe/H] values from other sources in order to produce the best available sample of spectroscopic data. Wherever data from other publications overlapped with our WYFFOS sample and demonstrated smaller associated uncertainties, these data superseded the WYFFOS results; such cases are noted in the final column of Table 3. In this final sample, 191 WYFFOS velocities and 189 metallicities were combined with data from Peterson (1989), Huchra, Brodie, & Kent (1991), Federici et al. (1993), Dubath & Grillmair (1997), and Barmby et al. (2000) to yield a total M31 globular cluster spectroscopic database comprising 321 velocities and 301 metallicities.
Barmby et al. (2000) identify the following targets as having spectral properties which are inconsistent with globular clusters: B55-S116 (stellar), B308 (galaxy), B341-S81 (stellar) and B392-S329 (stellar). We concur with the identification of B308 as a definite non-cluster and with that of B392-S329 as a probable non-cluster, and do not carry these through the remainder of the analysis. We do not find any clear abnormalities in the spectra of the other targets and thus cannot at present reject these as confirmed non-clusters.
In an effort to verify that there are no obvious biases in the metallicity sample studied here, we examine the color distribution of our sample and compare it to that of the overall M31 GCS. The mean estimated intrinsic color of 412 M31 globular clusters with data from Barmby et al. (2000) was , while that for the sample of those with [Fe/H] values used in the metallicity analysis presented herein (264 clusters with colors) was determined to be . Based on this and a comparison of the color histograms for the metallicity sample and the overall GCS (Figure 8), we conclude that there are no significant population biases with respect to the color of the metallicity sample presented herein. A Kolmogorov-Smirnov two-sample test on the distributions in Figure 8 confirms what the eye suggests: the color distribution of the metallicity sample is drawn from the same parent population as the overall color sample at a high confidence level (99.5%).
Clearly, the globular clusters at small galactocentric radii will suffer from more severe effects of incompleteness due to obscuration by the disk and bulge of M31. Depending on the color/metallicity distribution as a function of position within the galaxy, this observational effect will conceivably bias the observed metallicity sample. We will return to this point in Section 4.1.
4 M31 Cluster Metallicities
The metal abundance properties of M31’s globular clusters are of interest as they bespeak the galaxy’s formative processes and enrichment history. The metallicity distribution for the M31 GCS is presented in Figure 9, along with a similar plot for the Milky Way GCS for comparison. The mean metallicity of the full complement of 301 M31 globular clusters is , comparable to the value of obtained for the Milky Way GCS (based on data supplied in Harris (1996), revised 1999). However, a Kolmogorov-Smirnov test reveals that the Galactic and M31 globular clusters have [Fe/H] distributions which are drawn from the same parent population at only the 55% confidence level.
As is frequently the case with binned data, the appearance of the histogram can be ambiguous and potentially misleading, and thus a more robust method of analysis is desirable. In order to examine the shape of the metallicity distribution without relying on binning methods, we turned to the KMM algorithm used by Ashman, Bird, & Zepf (1994). KMM mixture modeling operates under the assumption that the data is independently drawn from a parent population which consists of a mixture of Gaussian distributions. The KMM test has previously been applied to the M31 globular cluster metallicity distribution by Ashman & Bird (1993), albeit with a significantly smaller data sample.
A bimodal distribution was tested against the assumption of a unimodal shape (the null hypothesis) for the GCS metallicities. Since there is no obvious reason to assume that both [Fe/H] groups in a bimodal fit would exhibit a common covariance, heteroscedastic fitting was applied such that the covariances for the two distributions were not constrained to be identical. The KMM results revealed that this 2-group fit demonstrated a marginal improvement over a single group fit, although Ashman, Bird, & Zepf (1994) cautioned that the output probability in the heteroscedastic case is more difficult to interpret and may, in and of itself, be suspect. We repeated the KMM test on more than 1500 simulations with bootstrap resampling and found that the bimodal case was preferred over the unimodal distribution at a median confidence level of higher than . The bimodal test returned Gaussian fits characterized by means at () for the metal-poor distribution and at () for the metal-rich clusters. The a posteriori probabilities of group membership returned by KMM assigned 231 clusters to the metal-poor distribution and 70 to the metal-rich population.
In their analysis, Elson & Walterbos (1988) treated the M31 GCS as comprising three distinct metallicity sub-populations: metal-poor, intermediate, and metal-rich. We employed the KMM test to ascertain whether a trimodal distribution was also consistent with the measured [Fe/H] values for the M31 cluster system. The trimodal KMM results with bootstrap resampling demonstrated that a 3-group fit was indeed preferred over a single Gaussian distribution at a relatively high confidence level (96%). The output population means obtained for the best 3-group fit were located at (), () and (). The numbers of clusters assigned to each group were 153, 76 and 72, respectively.
In light of the variation in the magnitude of [Fe/H] uncertainties quoted within the WYFFOS sample and others, it is appropriate to test the effects of these uncertainties on the inferred shape of the distribution. There are 229 GCs with metallicity uncertainties lower than 0.45 dex, a value roughly equal to the variance of one of the populations as determined from the bimodal results. We applied the KMM test to this higher-precision sample to test the stability of our earlier conclusions. The bimodal case was again found to represent a statistically significant improvement over the unimodal assumption with peaks similar to those found when we incorporated the complete sample. The input assumption of three peaks, however, did not return adequate fits: the a posteriori probabilities of group membership in the trimodal case allocated only two clusters to the intermediate population.
There is an unavoidable smearing of the metallicity distribution due to metallicity calibration uncertainties, absorption and reddening of bulge/disk clusters and other line-of-sight problems, or errors incurred as a result of combining different datasets. As a further test, simulations were run in which we shuffled the high-precision [Fe/H] sample by a random fraction of their associated uncertainties. This returned a result of marginal significance (median p-value ) for the 2-group case, and an insignificant result (p-value ) for the 3-group heteroscedastic trial. Note that the shapes of the 2-group Gaussian fits were once again consistent with those of the original bimodal test using the full sample.
In light of these KMM results, we tentatively reject the possibility of a trimodal GC metallicity distribution for the purposes of the analysis which follows. While it may yet be reasonable to separate the cluster system into more than two populations — say, by culling out the intermediate targets with group membership probabilities between 0.4 and 0.6 in the bimodal case — we elect not to do so here, as it is not clear that these represent a bona fide intermediate population. Based on the available data, we argue that the metallicity distribution of the M31 globular cluster system is not unimodal and better resembles a bimodal distribution similar in general shape to that of the Milky Way (Zinn, 1985). Therefore, “metal-poor” and “metal-rich” populations shall refer to those objects separated into two groups based on the a posteriori probabilities returned from the 2-group heteroscedastic KMM test with the complete available sample. Each population was independently fit using an adaptive kernel smoothing procedure333Adaptive kernel smoothing code kindly provided by Karl Gebhardt. and the results are shown in Figure 10.
The positions of our adopted metallicity peaks ( and ) differ only slightly from those quoted by Barmby et al. (2000), who found a bimodal distribution in M31 GC metallicities and metallicity-sensitive colors with peaks at and . Our peaks are also similar to the values of and obtained by Ashman & Bird (1993) using the KMM test on an earlier sample of 144 M31 globular clusters; their study yielded a ratio of metal-rich to metal-poor globular clusters of 49:95, in comparison with a ratio of 70:231 found in the current study.
4.1 Spatial Distribution
The projected spatial distributions of the metal-poor and metal-rich cluster populations are shown in Figure 11. The metal-rich population is clearly more centrally concentrated, an effect which has been demonstrated previously with a smaller dataset (Huchra, Brodie, & Kent, 1991). In the Milky Way, the metal-rich clusters have been ascribed as belonging to a thick disk system (Zinn, 1985; Elson & Walterbos, 1988; Armandroff, 1989). Later work has suggested that this is better described as a bulge/bar cluster system (Minniti, 1995; Côté, 1999; Forbes, Brodie & Larsen, 2001). The spatial concentration and distribution of the metal-rich clusters in M31 appear to be consistent with the latter interpretation.
There is a notable deficit of metal-poor clusters in the innermost radial bins shown in Figure 12. The already strong central concentration in the metal-rich population might mask any analogous deficit in this population. A similar lack of central clusters was reported by Elson & Walterbos (1988) within the inner of the GCS and is at least partially attributable to sampling restrictions towards the middle of the galaxy, as well as to observational biases incurred as a result of obscuration by the bulge and disk. The cluster sample at large galactocentric radii is bound to be more complete at faint magnitudes due to the lower degree of absorption as compared with the inner cluster system.
Examination of Figure 13 reveals a modest lack of clusters fainter than within the inner or so of the GCS. We attempt to estimate the incompleteness at small radii in the following manner. Using available photometry (Barmby et al., 2000), we plot the observed luminosity functions (LFs) for the metal-rich and metal-poor clusters beyond a galactocentric radius of . These outer LFs are normalized to the same scale as the distributions within the inner by summing under the brighter end of the inner and outer histograms ( mag) and multiplying by the ratio of these values. The observed histograms for the inner metal-rich and metal-poor clusters are shown by the solid lines in Figure 14, and the scaled outer histograms are represented by the dotted lines. Note that this method provides only a very crude estimate of the number of missing clusters at as it presumes, perhaps falsely, that the shape of the globular cluster LF does not change within the inner region of the galaxy. Dynamical destruction will have a more severe effect on the inner clusters and will thus change the overall shape of the luminosity function. Evidence for this effect has previously been noted by Kavelaars & Hanes (1997).
From the scaled outer LFs in Figure 14, we infer that there are possibly missing metal-poor clusters at , whereas there may be only faint, metal-rich clusters which are missing within the inner of the galaxy. Therefore, sample incompleteness is a reasonable explanation for the dip in the central bins of the metal-poor radial profile.
Comparing simple counts of the cluster populations within quadrants centered on the major and minor axes reveals that there is a slight enhancement in the minor axis fields for the metal-rich population: 40 clusters in the East-West sectors versus 30 in the North-South. If one takes into account only the inner of the GCS, this enhancement largely vanishes for the metal-rich clusters: 28 clusters are found within the major axis sectors compared to 26 along the minor axis. Based on their photometric metallicity estimates, Elson & Walterbos (1988) discovered that their sample of clusters classified as metal-rich defines a flattened system with an ellipticity of within a major axis radius of . Our cluster counts are not consistent with such a large degree of flattening of the metal-rich system in this region. At present, we cannot provide reasonable limits on the flattening of the metal-poor cluster distribution, since the arrangement of the WYFFOS fields has resulted in a selection bias in favor of clusters in major axis sectors at radii beyond .
4.2 Metallicity Gradient
Several previous works have suggested the presence of a weak metallicity gradient in the M31 cluster system out to radii of kpc (Sharov, 1988; Huchra, Brodie, & Kent, 1991). In Figure 15, we plot the metallicity of the M31 globular clusters as a function of galactocentric radius for the full sample and the separate metallicity sub-populations. The large scatter in these plots is due at least in part to the fact that we can only measure projected positions, but nonetheless we find that the mean [Fe/H] does indeed decrease with radius.
A sliding bin method was used to fit the mean metallicity in bins centered on each data point, with results shown in Figure 15. Robust estimates of the mean metallicity in radial bins are consistent with the presence of a modest gradient in [Fe/H] within the full sample. Separating the data into sub-populations reveals no clear evidence for a gradient in the metal-rich GCS, although the spread in metallicity does seem to increase towards the center of the galaxy. There is an apparent trend towards decreasing metallicity within both the full sample and the inner metal-poor cluster system, with gradients of roughly and , respectively. Relatively poor sampling of the clusters at large radii makes it difficult to comment decisively on the results beyond a radius of about , although the metal-poor sample appears to level off at a lower mean metallicity beyond this distance.
5 GCS Kinematics
The maximum likelihood value for the mean cluster radial velocity is km s-1, somewhat higher than M31’s systemic velocity of km s-1 (RC3). The globular clusters have an overall velocity dispersion of km s-1. The kinematics of metal-rich and metal-poor GCS populations will be discussed later in this section. First, we examine the global kinematic properties of the M31 GCS.
5.1 GCS Rotation
A histogram of the cluster line-of-sight velocities is presented in Figure 16. There is strong evidence for bimodality in the velocity distribution, a feature which is attributable to the fact that the cluster system is rotating with respect to our line of sight. Considering, for the moment, a purely rotating disk population of globular clusters in the reference frame of the galaxy:
where is the rotation velocity of the population, is the inclination of the rotation axis to the line of sight (), is the angle about the angular momentum axis, is an arbitrary phase offset, and incorporates the velocity dispersion plus random measurement errors. The combined probability distribution for the M31 globular cluster radial velocities is the convolution of with . The probability distribution is Gaussian and is uniform, thus is given by:
| (5) | |||||
This represents a bimodal distribution with maxima at about the systemic velocity of the population. The peaks of the (unshifted) velocity histogram in Figure 16 lie at and km s-1, yielding an estimated rotation amplitude of km s-1.
The fact that M31 is rotating has been established by various studies (see Hodge, 1992, and references therein). Using a sample of M31 clusters as dynamical tracers, Huchra, Brodie, & Kent (1991) noted a rapid rotation of the handful of inner () clusters in their sample with (see also Huchra, Stauffer, & Van Speybroeck (1982)). Huchra, Brodie, & Kent (1991) discovered that the metal-poor population had no rotation signature within the inner galaxy, but shared a moderate rotation of km s-1 with the bulk of the GCS beyond this radius. With our increased sample of 321 velocities, we can now provide a more comprehensive look at the kinematics of the M31 globular cluster system.
Perhaps not surprisingly, there appears to be no significant rotation of the GCS about the major axis of M31 as shown in the left panel of Figure 17. A robust fit to the targets within the inner along the minor axis (dropping 11 objects at large radii) gives km s-1, where is the distance along the minor axis in arcminutes. Such a small deviation from a slope of zero may simply be due to statistical imprecision or variation in the position angle for the galaxy (Hodge & Kennicutt, 1982).
A plot of the observed cluster radial velocities as a function of projected distance along the major axis of M31 is shown in the right panel of Figure 17. A basic culled robust linear fit to the velocities along the major axis reveals that the globular cluster system indeed has a significant rotational component about the minor axis. This rotation will now be investigated in more detail.
We used an adaptive binning technique to generate the GCS rotation curve shown in Figure 18. Before fitting the rotation curve, the globular cluster coordinates were transformed into the reference frame of the galaxy and the data were folded about each axis. The function was fit to the radial velocities of the clusters within radial bins outwards from the galaxy center (Kissler-Patig & Gebhardt, 1998). The angle represents the position angle of the target object in the projected frame of the galaxy, and is the mean velocity of the cluster system. The kinematic properties were determined in a series of annuli centered on each cluster and encompassing a specified number of data points (79 points, with a minimum of 39 at the extrema). With this method, we obtain a rotation amplitude of km s-1 where the curve flattens off beyond .
We then employed the robust biweight estimators of location and scale (Beers, Flynn, & Gebhardt, 1990; Hoaglin, Mosteller, & Tukey, 2000) as measures of mean velocity and dispersion in 10 arcminute bins along the major axis of the galaxy. The biweight results and their 90% confidence intervals (based on bootstrap errors) are presented in Figure 19 for the full sample and the two metallicity sub-populations. Based on the appearance of these plots, it seems reasonable to approximate the shape of the curve as consisting of solid-body rotation within the central , with a flattening beyond this radius. One-half of the velocity difference between the flat regions of the curve in Figure 19 yields a rotation amplitude of km s-1 for the full sample.
Significant differences between the kinematic properties of the metal-rich and metal-poor clusters may indicate that these populations underwent dissimilar formation mechanisms. The maximum likelihood value for the mean velocity of the 70 clusters in the metal-rich sample is km s-1 with a dispersion of km s-1. For comparison, the larger metal-poor sample of 231 clusters demonstrates a somewhat lower mean velocity of km s-1 and a slightly higher dispersion of km s-1, although these values are still consistent with those of the higher metallicity sample within the quoted errors. From the fits of the biweight results, we determine a rotation amplitude of km s-1 for the metal-rich population. This value is somewhat larger than the metal-poor amplitude of km s-1, although these values are also not inconsistent within their formal errors.
For each cluster, the projected position angle was determined as the angle of maximum positive rotation obtained from the maximum likelihood sinusoid fits (Kissler-Patig & Gebhardt, 1998). Plots of the variation of position angle with radius for the full sample and metallicity sub-populations are presented in Figure 20. The input GC positions already incorporate a de-rotation of for the galaxy and, all else being equal, one would expect to find that the PA for the cluster system is roughly zero. Despite the sizeable spread at low radius in the full sample, there is a relatively clear increase in PA within the central region of the metal-poor cluster system. This effect is consistent with studies of the central bulge and inner disk region of M31 which demonstrate a similar increase in PA (Hodge & Kennicutt, 1982; Kent, 1989). The M31 GCS shows a notable decrease in the PA of the rotation axis beyond about . Interestingly, the metal-rich clusters seem to be rotating about an axis that is tilted at a slightly lower PA with respect to the major axis throughout the full radial extent of the population.
5.2 The Mass of M31
The kinematics of M31’s GCS provide us with a dynamical probe of the underlying mass distribution of the host galaxy (Federici et al., 1990, 1993). The projected mass estimator (PME) was used to place constraints on the underlying mass of the system (Bahcall & Tremaine, 1981; Heisler, Tremaine, & Bahcall, 1985):
| (6) |
where is the number of bodies, G is the gravitational constant, is the projected galactocentric radius and is the radial velocity of the body relative to the systemic velocity of the galaxy. The factor depends on the assumptions made regarding the distribution of orbits, and is equal to and for isotropic and radial orbits, respectively.
Admittedly, this projected mass estimate is hampered by our limited sample size and coverage, as well as a lack of detailed understanding of the cluster orbits. Recent work by Evans & Wilkinson (2000) has shown that the dynamical tracers in the M31 halo exhibit a predominantly isotropic velocity dispersion. Applying the PME to the available cluster data and assuming isotropic orbits within an extended mass distribution, we estimate a mass of using 319 dynamical targets out to a radius of from the galaxy center ( kpc at a distance of 770 kpc). This result is comparable to previous mass estimates obtained out to similar radii as summarized in Table 6 of Evans & Wilkinson (2000), and to the mass of found by Huchra, Brodie, & Kent (1991) based on their sample of 150 globular clusters. In the (unlikely) case of purely radial orbits, our mass estimate would be increased to twice the value quoted above.
6 Discussion and Conclusions
We have presented a sample of new spectroscopic observations of M31 globular clusters, contributing high-precision velocities and [Fe/H] values for what represents a large fraction of the dynamical tracers of the galaxy. A comprehensive analysis of the kinematics and abundance properties of M31’s GCS demonstrates some interesting similarities and differences when compared with the Milky Way’s globular cluster population.
The Galactic and M31 globular cluster systems have comparable mean metallicities of to , although a Kolmogorov-Smirnov test provides no conclusive evidence that the two distributions are drawn from the same parent population. A KMM mixture-modeling test reveals that the M31 GCS metallicity distribution can convincingly be separated into two groups, a bimodality which is analogous to that found in the Milky Way GCS. The peaks in the M31 metallicity distribution lie at and . A KMM test on the Milky Way GCS metallicities from the McMaster catalogue (Harris, 1996) returns peaks at and , indicating that the metal-poor Galactic globulars have, on average, a somewhat lower metal abundance than their M31 counterparts. Of the 301 M31 globular clusters with available metallicities, KMM assigns 70 to the metal-rich peak. This represents a somewhat smaller fraction of high-metallicity clusters than is found in the Milky Way system, for which 45 of 145 are identified with the metal-rich population.
M31’s metal-rich globular clusters appear to constitute a distinct kinematic subsystem that is quite spatially concentrated, consistent with membership in a bulge population akin to the inner metal-rich clusters of the Milky Way (Minniti, 1995). Furthermore, the velocity dispersion of the metal-rich cluster system, km s-1, is indistinguishable from the mean bulge dispersion of km s-1 as determined from the kinematics of faint planetary nebulae (Lawrie, 1983; van den Bergh, 1991). The mean metallicity of this population is quite similar to their Milky Way counterparts and demonstrates no obvious abundance gradient with galactocentric radius. Contrary to observations in the Milky Way, however, we find no clear signs of flattening in the metal-rich component of the M31 GCS despite our relative oversampling of major axis fields in the current spectroscopic sample. We find that the rotation axis of the metal-rich cluster population is tilted at a slightly lower position angle: it is offset by about with respect to that of the minor axis of M31 and the bulk of its GCS. This observation may point to a disparate origin for these clusters. Further searches for potential cluster candidates hidden by the bulge of M31 will be helpful in providing a clearer understanding of the kinematics and nature of this inner system.
In M31, there are more than three times the number of metal-poor clusters as there are metal-rich. It is not clear if it is possible (or even necessary) to further separate this larger, more spatially distended metal-poor population into sub-components. If the metal-poor cluster distribution does indeed incorporate a thick disk component in addition to halo clusters, this would account for the relatively high net rotation amplitude and large velocity dispersion observed therein. While grouping the clusters based on metallicity remains an instructive exercise, [Fe/H] alone is not an adequate discriminator of membership in the spatially- or kinematically-defined components of the galaxy. This is primarily a result of the substantial spread and measurable gradient in [Fe/H] within the metal-poor cluster system. The task of assigning globular clusters to their appropriate component (e.g. bulge, thin or thick disk, inner or outer halo) remains somewhat simpler within the Milky Way GCS, since here we have three-dimensional spatial information rather than projected positions.
We find evidence for a radial metallicity gradient () in the metal-poor population of M31 out to about from the galaxy center. Despite a notable lack of cluster data beyond this radius, it does seem that mean metallicity levels off, although the scatter remains large. This gradient in the metal-poor clusters is not inconsistent with a single collapse scenario, yet we recognize that a metallicity gradient, in and of itself, is not sufficient to confirm an early dissipational collapse. Such a gradient could be mimicked by a hierarchical halo formation if the metallicity of the accreting fragments correlates with their mass and mean density (Freeman, 1996). The search for substructure in position/velocity/metallicity parameter space is clearly of interest to investigate the accretion history of the galaxy. An analysis of potential sub-clustering within the M31 GCS will follow in a subsequent paper.
A comprehensive investigation of the kinematics of the dynamical tracers in M31 would not be complete without the addition of planetary nebulae data. Fortunately, a study of a large sample of M31 is currently underway (Halliday et al., in preparation. Moreover, these data can be combined with the globular cluster sample to better probe the underlying mass distribution of the galaxy (Wilkinson et al., in preparation). An analysis of M31 cluster ages is also in progress (T. Bridges, private communication) which should provide a better sense of the chronology of GC formation within the galaxy. Despite its long and rich history of investigation, there is little doubt that there are missing globulars in M31’s database which are awaiting discovery and identification. Continuing searches and surveys for M31 cluster candidates (Lee et al., 2001) promise to help remedy this situation and to further fuel this “booming industry”. It is clear that detailed studies of the kinematics, metallicities and ages of the globular cluster systems of a large sample of galaxies can provide us with the clues necessary for a more complete understanding of the mechanisms which form and evolve galaxies of all kinds.
7 Acknowledgments
This work was supported in part by operating grants to DAH from the Natural Sciences and Engineering Research Council of Canada. JPB and JPH acknowledge funding support from the National Science Foundation. The authors wish to extend their thanks to Jim Lewis, Karl Gebhardt and Tim Beers for making their software available, and to Pauline Barmby for providing unpublished reddenings. The authors are also very grateful to the anonymous referee for the helpful comments and to the kind staff at WHT for their support during the observations.
References
- Armandroff (1989) Armandroff, T. E. 1989, AJ, 97, 375
- Ashman & Bird (1993) Ashman, K. M., & Bird, C. M. 1993, AJ, 106, 2281
- Ashman & Zepf (1998) Ashman, K. M., & Zepf, S. E. 1998, Globular Clusters (New York: Cambridge Univ. Press)
- Ashman, Bird, & Zepf (1994) Ashman, K. M., Bird, C. M., & Zepf, S. E. 1994, AJ, 108, 2348
- Baade & Arp (1964) Baade, W., & Arp, H. 1964, ApJ, 139, 1027
- Bahcall & Tremaine (1981) Bahcall, J. N., & Tremaine, S. 1981, ApJ, 244, 805
- Barmby et al. (2000) Barmby, P., Huchra, J. P., Brodie, J. P., Forbes, D. A., Schroder, L. L., & Grillmair, C. J. 2000, AJ, 119, 727
- Battistini et al. (1980) Battistini, P., Bònoli, F., Braccesi, A., Fusi Pecci, F., & Malagnini, M. L. 1980, A&AS, 42, 357
- Battistini et al. (1987) Battistini, P., Bònoli, F., Braccesi, A., Federici, L., Fusi Pecci, F., Marano, B., & Börngen, F. 1987, A&AS, 67, 447
- Battistini et al. (1993) Battistini, P. L., Bònoli, F., Casavecchia, M., Ciotti, L., Federici, L., & Fusi Pecci, F. 1993, A&A, 272, 77
- Beers, Flynn, & Gebhardt (1990) Beers, T. C., Flynn, K., & Gebhardt, K. 1990, AJ, 100, 32
- Bònoli et al. (1987) Bònoli, F., Delpino, F., Federici, L., & Fusi Pecci, F. 1987, A&A, 187, 25
- Bridges (1998) Bridges, T. J. 1998, in Fibre Optics in Astronomy III, ASP Conf. Ser. 152, eds. S. Arribas, E. Mediavilla and F. Watson, 104
- Brodie & Hanes (1986) Brodie, J. P., & Hanes, D. A. 1986, ApJ, 300, 258
- Brodie & Huchra (1990) Brodie, J. P., & Huchra, J.P. 1990, ApJ, 362, 503
- Burstein et al. (1984) Burstein, D., Faber, S., Gaskell, M., & Krumm, N. 1984, ApJ, 287, 586
- Cole et al. (2000) Cole, S., Lacey, C. G., Baugh, C. M., & Frenk, C. S. 2000, MNRAS, 319, 168
- Côté (1999) Côté, P. 1999, AJ, 118, 406
- Côté, Marzke, & West (1998) Côté, P., Marzke, R. O., & West, M. J. 1998, ApJ, 501, 554
- Crampton et al. (1985) Crampton, D., Cowley, A. P., Schade, D., Chayer, P. 1985, ApJ, 288, 494
- de Vaucouleurs et al. (1991) de Vaucouleurs, G., de Vaucouleurs, A., Corwin Jr., H.G., Buta, R. J., Paturel, G., & Fouque, P., Third Reference Catalogue of Bright Galaxies, 1991, Version 3.9 (RC3)
- Dubath & Grillmair (1997) Dubath, P., & Grillmair, C. J. 1997 A&A, 321, 379
- Eggen, Lynden-Bell, & Sandage (1962) Eggen, O. J., Lynden-Bell, D., & Sandage, A. R. 1962, ApJ, 136, 748
- Elson & Walterbos (1988) Elson, R. A. W., & Walterbos, R. A. M. 1988, ApJ, 333, 594
- Evans & Wilkinson (2000) Evans, N. W., & Wilkinson, M.I. 2000, MNRAS, 316, 929
- Federici et al. (1990) Federici, L., Fusi Pecci, F., & Marano, B. 1990, A&A, 236, 99
- Federici et al. (1993) Federici, L., Bònoli, F., Ciotti, L., Fusi Pecci, F., Marano, B., Lipovetsky, V. A., Neizvestny, S. I., & Spassova, N. 1993, A&A, 274, 87
- Forbes, Brodie, & Grillmair (1997) Forbes, D. A., Brodie, J. P., & Grillmair, C. J. 1997, AJ, 113, 1652
- Forbes, Brodie & Larsen (2001) Forbes, D. A., Brodie, J. P., & Larsen, S. S. 2001, ApJ, 556, L83
- Freeman (1996) Freeman, K. C. 1996, in Formation of the Galactic Halo…Inside and Out, ASP Conf. Ser. 92, eds. H. Morrison and A. Sarajedini, 3
- Frogel, Persson, & Cohen (1980) Frogel, J. A., Persson, S. E., & Cohen, J. G. 1980, ApJ, 240, 785
- Harris (1996) Harris, W. E. 1996, AJ, 112, 1487 (McMaster catalogue, revised June 1999) http://physun.physics.mcmaster.ca/Globular.html
- Heisler, Tremaine, & Bahcall (1985) Heisler, J., Tremaine, S., & Bahcall, J. N. 1985, ApJ, 298, 8
- Hoaglin, Mosteller, & Tukey (2000) Hoaglin, D. C., Mosteller, F. & Tukey, J. 2000, Understanding Robust and Exploratory Data Analysis (New York: Wiley & Sons)
- Hodge (1992) Hodge, P. 1992, The Andromeda Galaxy, (Dordrecht: Kluwer), Ch. 7
- Hodge & Kennicutt (1982) Hodge, P. W., & Kennicutt, R. C. 1982, AJ, 87, 264
- Hubble (1932) Hubble, E. 1932, ApJ, 76, 44
- Huchra, Stauffer, & Van Speybroeck (1982) Huchra, J. P., Stauffer, J., & Van Speybroeck, L. 1982, ApJ, 259, L57
- Huchra, Brodie, & Kent (1991) Huchra, J. P., Brodie, J. P., & Kent, S. M. 1991, ApJ, 370, 495
- Kavelaars & Hanes (1997) Kavelaars, J., & Hanes, D. A. 1997, MNRAS, 285, 31
- Kent (1989) Kent, S. 1989, AJ, 97, 1614
- Kissler-Patig & Gebhardt (1998) Kissler-Patig, M., & Gebhardt, K. 1998, AJ, 116, 2237
- Lawrie (1983) Lawrie, D. G. 1983, ApJ, 273, 562
- Lee et al. (2001) Lee, M. G., Kim, S. C., Geisler, D., Seguel, J., Sarajedini, A., & Harris, W. E. 2001, in Extragalactic Star Clusters, IAU Symp. Ser. 207, eds. E. Grebel, D. Geisler, and D. Minniti, in press
- Minniti (1995) Minniti, D. 1995, AJ, 109, 1663
- Parmentier et al. (2000) Parmentier, G., Jehin, E., Magain, P., Noels, A., & Thoul, A. A. 2000, A&A, 363, 526
- Peterson (1989) Peterson, R. 1989, in Dynamics of Dense Stellar Systems, ed. D. Merritt (Cambridge: Cambridge Univ. Press), 161
- Rosenberg et al. (1999) Rosenberg, A., Saviane, I., Piotto, G., & Aparicio, A. 1999, AJ, 118, 2306
- Rubin & Ford (1970) Rubin, V. C., & Ford, W. K. Jr. 1970, ApJ, 159, 379.
- Saito & Iye (2000) Saito, Y. & Iye, M. 2000, ApJ, 535, L95
- Sargent et al. (1977) Sargent, W. L. W., Kowal, C. T., Hartwick, F. D. A., & van den Bergh, S. 1977, AJ, 82, 947
- Sarajedini, Chaboyer, & Demarque (1997) Sarajedini, A., Chaboyer, B., & Demarque, P. 1997, PASP, 109, 1321
- Searle & Zinn (1978) Searle, L., & Zinn, R. 1978, ApJ, 225, 357
- Sharov (1988) Sharov, A. S. 1988, SvA, 14, L339
- Sommer-Larsen et al. (1997) Sommer-Larsen, J., Beers, T. C., Flynn, C. Wilhelm, R. & Christensen, P. R. 1997, ApJ, 481, 775
- Stetson et al. (1999) Stetson, P. B., Bolte, M., Harris, W. E., Hesser, J. E., van den Bergh, S., VandenBerg, D. A., Bell, R. A., Johnson, J. A., Bond, H. E., Fullton, L. K., Fahlman, G. G., & Richer, H. B. 1999, AJ, 117, 247
- Tonry & Davis (1979) Tonry, J., & Davis, M. 1979, AJ, 84, 1511
- van den Bergh (1969) van den Bergh, S. 1969, ApJS, 171, 145
- van den Bergh (1991) van den Bergh, S. 1991, PASP, 103, 1053
- Vetes̆nik (1962) Vetes̆nik, M. 1962, BAC, 13, 180
- Zepf & Ashman (1993) Zepf, S. E., & Ashman, K. M. 1993, MNRAS, 264, 611.
- Zinn (1985) Zinn, R. 1985, ApJ, 293, 424
| Code | Reference |
|---|---|
| B | Battistini et al. (1980, 1987) |
| S | Sargent et al. (1977) |
| BA | Baade & Arp (1964) |
| BoD | Battistini et al. (1987) Table VI |
| DAO | Crampton et al. (1985) |
| NB | Battistini et al. (1993) |
| V | Vetes̆nik (1962) |
| Field ID | Night | UT | Exp (Sec) | Grating | ||
|---|---|---|---|---|---|---|
| Central 1 | 00:40:00.18 | +40:59:59.9 | Nov. 3/4 | 21:00 | 6 1800 | H2400B |
| Central 1 | 00:40:00.43 | +41:00:00.5 | Nov. 3/4 | 00:43 | 3 1200 | R1200R |
| Northeast 1 | 00:42:29.88 | +41:36:02.0 | Nov. 4/5 | 21:52 | 6 1800 | H2400B |
| Northeast 1 | 00:42:29.88 | +41:36:01.1 | Nov. 4/5 | 01:22 | 3 1200 | R1200R |
| Southwest 1 | 00:37:30.15 | +40:24:01.7 | Nov. 5/6 | 19:32 | 3 1200 | R1200R |
| Southwest 1 | 00:37:30.51 | +40:24:00.0 | Nov. 5/6 | 20:42 | 4 1800 | H2400B |
| Northeast 2 | 00:44:59.97 | +42:11:53.4 | Nov. 5/6 | 23:43 | 5 1800 | H2400B |
| Northeast 2 | 00:45:00.70 | +42:11:56.3 | Nov. 5/6 | 02:40 | 3 1200 | R1200R |
| Central 2 | 00:39:59.20 | +41:00:05.2 | Nov. 6/7 | 19:26 | 3 1200 | R1200R |
| Central 2 | 00:39:59.34 | +41:00:03.7 | Nov. 6/7 | 20:38 | 4 1800 | H2400B |
| Southwest 2 | 00:34:59.80 | +39:47:54.6 | Nov. 6/7 | 23:33 | 5 1800 | H2400B |
| Southwest 2 | 00:35:00.56 | +39:47:54.6 | Nov. 6/7 | 02:25 | 4 1200 | R1200R |
| GC | RA (B1950) | Dec (B1950) | X (′) | Y (′) | (km s-1) | [Fe/H] | Notes |
|---|---|---|---|---|---|---|---|
| (Complete table available in published version) | |||||||
| Index | C1 | I | C2 |
|---|---|---|---|
| HK | 3910.00 – 3925.00 | 3925.00 – 3995.00 | 3995.00 – 4015.00 |
| CNR | 4082.00 – 4118.50 | 4144.00 – 4177.50 | 4246.00 – 4284.75 |
| CaI | 4200.00 – 4215.00 | 4215.00 – 4245.00 | 4245.00 – 4260.00 |
| CH(G) | 4268.25 – 4283.25 | 4283.25 – 4317.00 | 4320.75 – 4335.75 |
| 3800.00 – 4000.00 | 4000.00 – 4200.00 | ||
| H | 4829.50 – 4848.25 | 4849.50 – 4877.00 | 4878.25 – 4892.00 |
| MgH | 4897.00 – 4958.25 | 5071.00 – 5134.75 | 5303.00 – 5366.75 |
| Mg2 | 4897.00 – 4958.25 | 5156.00 – 5197.25 | 5303.00 – 5366.75 |
| MgG | 5125.00 – 5150.00 | 5150.00 – 5195.00 | 5195.00 – 5220.00 |
| Mgb | 5144.50 – 5162.00 | 5162.00 – 5193.25 | 5193.25 – 5207.00 |
| Fe52 | 5235.50 – 5249.25 | 5248.00 – 5286.75 | 5288.00 – 5319.25 |
| Fe53 | 5307.25 – 5317.25 | 5314.75 – 5353.50 | 5356.00 – 5364.75 |
| Line | RMS | ||||
|---|---|---|---|---|---|
| H&K | 0.10 | 0.51 | 0.16 | 0.12 | 0.37 |
| CNR | 0.06 | 0.18 | 0.11 | 0.08 | 0.51 |
| CaI | 0.06 | 0.00 | -0.01 | 0.06 | -0.05 |
| CH(G)∗ | 0.08 | 0.25 | 0.09 | 0.06 | 0.68 |
| 0.20 | 1.31 | 0.24 | 0.14 | 0.70 | |
| H | 0.02 | 0.03 | -0.05 | 0.05 | -0.34 |
| MgH | 0.04 | 0.13 | 0.02 | 0.04 | 0.52 |
| Mg2 | 0.05 | 0.20 | 0.11 | 0.05 | 0.72 |
| MgG | 0.03 | 0.13 | 0.06 | 0.02 | 0.75 |
| Mgb∗ | 0.04 | 0.20 | 0.09 | 0.03 | 0.80 |
| Fe52 | 0.04 | 0.11 | 0.05 | 0.02 | 0.61 |
| Fe53∗ | 0.03 | 0.09 | 0.04 | 0.02 | 0.66 |
Note. — Features marked with an asterisk were used in the final [Fe/H] calibration.