Distortion of secondaries in semi-detached binaries and the cataclysmic variable period minimum
Based on SPH simulations, we quantify the geometrical distortion effect due to tidal and rotational forces on polytropic secondaries in semi-detached binaries. The main effect is an expansion of the polytropic star, with an effect on the radius of 5%-12%, depending on the polytropic index and the mass ratio. We apply such distortion effects to the secular evolution of secondaries in cataclysmic variable systems. We focus on systems below the 2-3h period gap and that approach the minimum period. We find a significant increase of the predicted minimum period ( 4% if changes in the secondary’s thermal relaxation are approximately taken into account). Though an improvement, the effect is not big enough to solve the mismatch between predicted and observed minimum period at 80 min.
Key Words.:
binaries: close — stars: low-mass, brown dwarfs — stars: evolution — cataclysmic variables1 Introduction
The description of close binary systems is usually based on the Roche model which defines the shape of a binary component distorted by tidal and rotational forces. In the framework of the Roche model one assumes that the binary components (the primary and the secondary) either are point masses, or are corotating and have a spherically symmetric mass distribution irrespective of their proximity or mass ratio (Kopal 1959, 1978). In a semi–detached system, one of the components fills its critical equipotential lobe defined by the potential of the inner Lagrangian point, and which determines the maximum extent of a star in a close binary. This is the so–called Roche lobe within the Roche model. Cataclysmic variables (hereafter CVs), composed of a white dwarf as the primary and a low–mass star or a brown dwarf as the secondary, belong to this type of systems: the secondary fills its critical lobe and transfers mass towards the primary. When applying the Roche model to problems of binary evolution one makes implicitly the following assumptions (among others). First, the Roche potential is a good approximation of the true potential that one would obtain by solving the Poisson equation. Second, the effects of tidal and rotational forces on the internal structure of the star are negligible, i.e. that they result in only small corrections compared to stellar models assuming spherical geometry. Third, that for the purpose of evolutionary computations involving one–dimensional stellar models the lobe–filling star may be replaced by a spherical star of the same volume. This is tantamount to assuming that though tidal and rotational forces change the shape of a star they leave its volume invariant. The radius of the lobe–filling star then only depends on the geometry of the system, and can be calculated by means of simple analytical fits (Paczyński 1971, Eggleton 1983). The main purpose of the present paper is to examine in some detail the third and to some extent also the second of the above assumptions, both of which have so far not been tested.
Recent 3D simulations (Rezzolla et al. 2001; Motl & Frank, priv. comm.) confirm that, at least in the case of a semi-detached system, the Roche potential is a good approximation if the lobe-filling star is sufficiently centrally condensed, i.e. if the effective polytropic index is 3/2. The analysis of Rezzolla et al. (2001) is based on numerical models of semi-detached binaries that account for the finite size of the secondary star, thus relaxing the first assumption inherent in the Roche model. With the validity of this approximation for the determination of the potential, they also show that such effects hardly affect gravitational quadrupole radiation. Moreover, a comparison between the angular momentum loss and mass-transfer timescales predicted by the Roche model and their numerical models shows small differences. They thus conclude that finite size effects cannot account for the mismatch between the observed minimum period at 80 min of CV systems and the theoretical value . The latter is indeed 15% shorter than the observed value, according to recent calculations based on improved stellar physics (see Kolb & Baraffe 1999). Since Rezzolla et al. (2001) do not consider thermal relaxation effects in their calculations, they can only determine a differential correction to when going from Roche model to self-consistent potential. However, in doing so, the second and third assumptions mentioned above remain untested. The main purpose of our paper is thus to explore the consequences of making these two assumptions.
Our main goal is to determine quantitatively the departure from spherical symmetry of the secondary in semi-detached binaries and to analyse the consequences on the mass transfer rates and orbital period in CV systems. We use smoothed particle hydrodynamics (SPH) techniques to study equilibrium configurations of semi-detached binaries and estimate for different mass ratios the geometrical deformation of the secondary as it fills its critical lobe. The numerical models and results are described in §2. In §3, we analyse some of the consequences of the tidal and rotational forces on the secular evolution of the low mass donor on grounds of models constructed by Kolb & Baraffe (1999) and Baraffe & Kolb (2000). We focus on the problem of the minimum period and the discrepancy between observations and models (see e.g King 1988 and Kolb 2001 for a review on the properties of CV systems). A discussion and conclusions follow in §4.
2 Numerical models of semi-detached binary systems
2.1 The method
We used a SPH code, originally developed and kindly provided by Willy Benz (see details in Benz et al. 1990) to perform numerical simulations of a close binary system composed of a point mass (primary) and a polytropic star (secondary). The SPH method has been described extensively in the literature (see Monaghan 1992 and references therein) and is often applied to the study of close binary systems (e.g Benz et al. 1990; Lai et al. 1994; Rasio & Shapiro 1995; Segrétain et al. 1997)
In all our simulations, the primary is a 1 point-like mass. The secondary is described by a polytropic equation of state , where is the pressure and the density. The polytropic constant is fixed for a given index by the mass and radius of the spherical secondary. We adopt two polytropic indices, i.e. = 3/2, which provides a good description of fully convective objects such as low mass stars, and = 3 characteristic of solar type stars with . For the particular case of CVs, systems below the period gap are well described by = 3/2 polytropes, whereas = 3 applies to systems with periods 6 h and typical masses around 1 . The two values of thus represent limiting cases for the description of CV secondaries. Assuming that remains constant in space applies well to fully convective objects with a fully adiabatic structure, and implies a chemically homogeneous structure (constant molecular weight) for the standard models with = 3. This is a reasonable approximation for the present study.
The simulations use 15000 particles. In order to check the accuracy of our results, we ran a limited number of simulations with 57000 particles. We find that 15000 particles is a good compromise between computational demand and accuracy. The particles are initially uniformly distributed on a hexagonal close-packed lattice. The initial number density of particles is constant throughout the volume of the sphere describing the initial configuration of the secondary. The particle masses are proportional to the local mass density. This provides a good spatial resolution near the stellar surface, which is crucial for our problem of critical lobe determination where surface effects are predominant. The simulations are performed in a corotating reference frame with the origin at the center of mass of the system. The initial separation of the two components is arbitrarily fixed at four times the separation required for the secondary to fill its Roche-lobe , estimated from the Eggleton (1983) fit. For such a separation, tidal and rotational effects on the secondary are negligible. The orbital separation is decreased with the arbitrary constant rate , so that the total timescale of the simulation is 1000 times the typical hydrodynamical relaxation time of the secondary. The simulation is stopped when the secondary fills its critical lobe i.e. when the first particles from the secondary reach the inner saddle point of the potential 111defined as in the Roche potential. This marks the onset of mass transfer. Once the critical separation is reached, we check that the model has reached an equilibrium configuration, starting from such critical separation and letting it relax in a non rotating reference frame.
Our goal is to estimate the deformation effects on the secondary due to tidal and rotational forces as it fills its critical lobe. The deformation can be measured in terms of the ratio of the final to initial stellar radius . is the radius of the unperturbed spherical polytrope. is an effective radius defined as the radius of the sphere with the volume of the secondary filling its critical lobe. is provided by our SPH simulation at the onset of mass transfer. The method to estimate is described in Appendix A.
2.2 Results
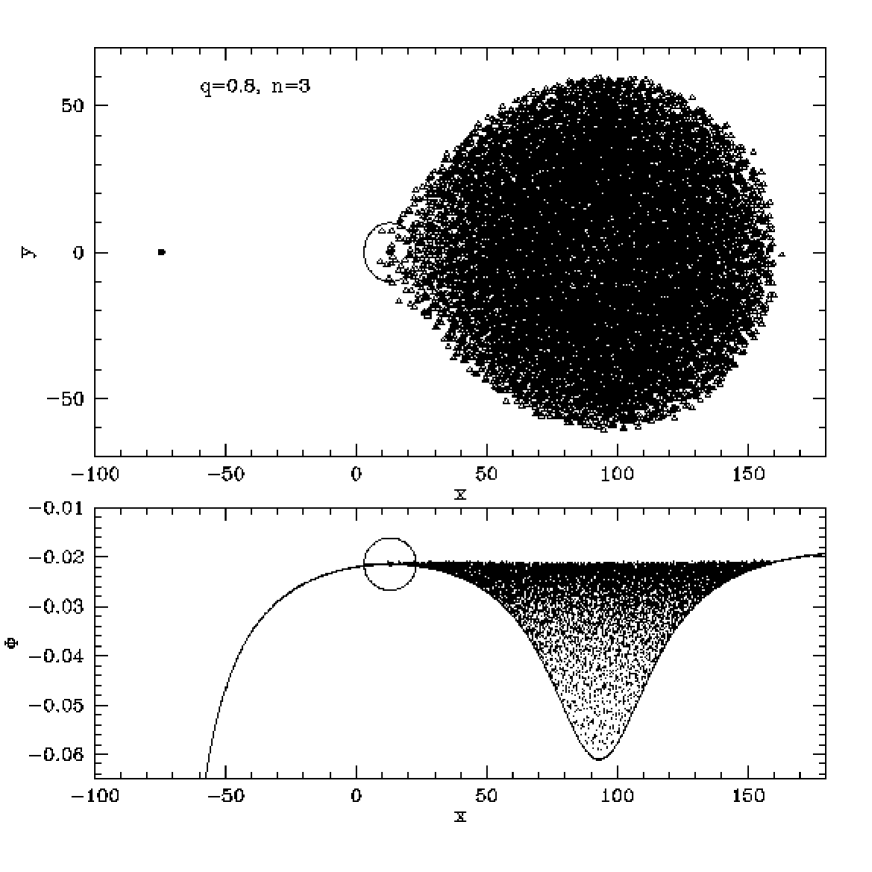
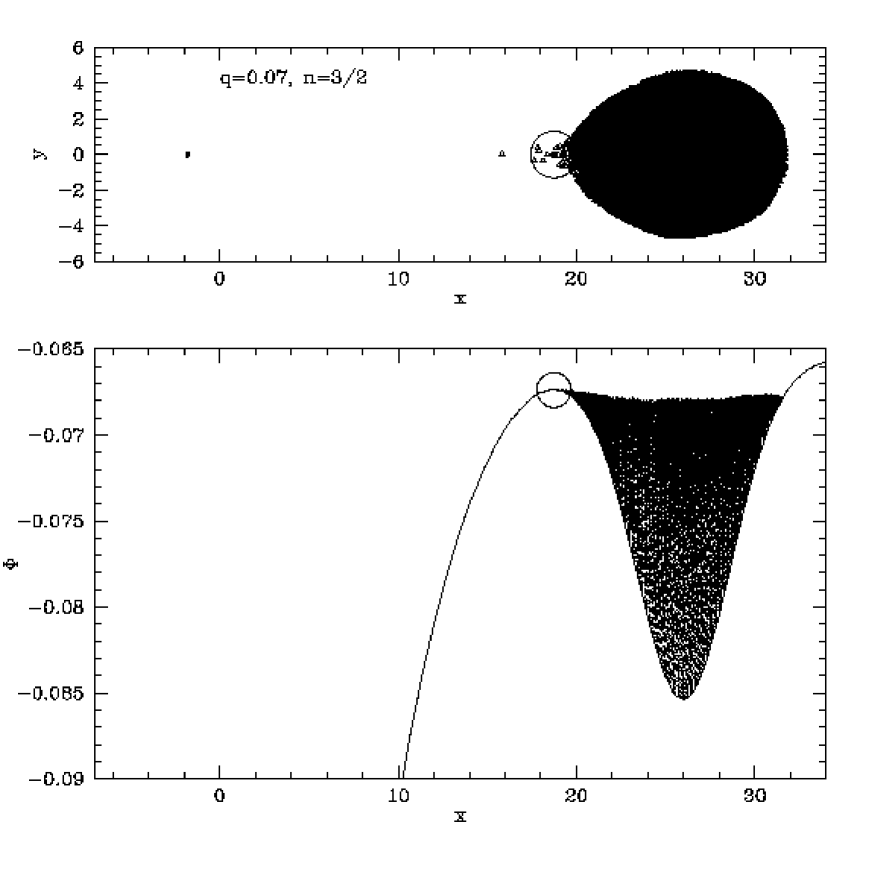
We ran a grid of simulations for various mass ratios between the secondary and the primary. Typically, CV systems with periods from 10 h down to the minimum period cover a range of between 1 and 0.06. Fig. 1 displays the final configuration of a = 3 polytrope with mass ratio = 0.8. This illustrates the case of CV systems with periods 6 h (see Baraffe & Kolb 2000). Fig. 2 shows the results for the case = 3/2 and = 0.07, characteristic of secondaries approaching the period bounce (Kolb & Baraffe 1999). We note that in the case = 3/2 (Fig. 2, lower panel), the surface value of is not constant. We did not find any satisfactory explanation for such behavior. This feature has already been noted in some cases by Rasio and Shapiro (1995) and interpreted in terms of number density of SPH particles being not exactly constant around the surface of a star with large tidal deformation. Increasing the number of particles from 15000 to 57000 and double-checking that the models have reached an equilibrium configuration do not solve the problem. We do not expect that this affects the accuracy of our final results, since our deformation calculations are in excellent agreement with similar calculations by other authors (see below).
The resulting deformations as a function of are summarized in Table 1 for = 3 and = 3/2. As expected, tidal and rotational distortion yields an expansion of the secondary’s volume with respect to the unperturbed spherical configuration. In terms of effective radius, the expansion is typically 11% for = 3 and 5% for = 3/2. The dependence of on can be understood in terms of the compressibility = , which is larger for = 3 than for = 3/2. The larger the compressibility, the larger the deformation.
| 0.06 | - | 1.06 |
| 0.07 | - | 1.06 |
| 0.1 | - | 1.05 |
| 0.2 | 1.12 | 1.05 |
| 0.3 | 1.12 | 1.05 |
| 0.4 | 1.12 | 1.04 |
| 0.5 | 1.12 | 1.04 |
| 0.6 | 1.11 | 1.04 |
| 0.7 | 1.11 | 1.04 |
| 0.8 | 1.11 | 1.04 |
| 0.9 | 1.11 | 1.04 |
| 1.0 | 1.10 | 1.04 |
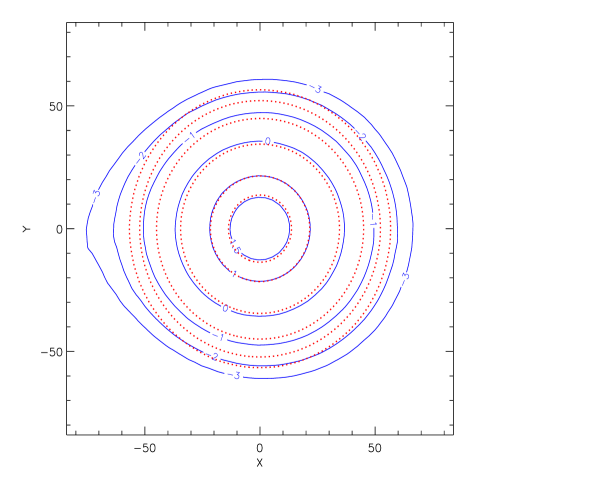
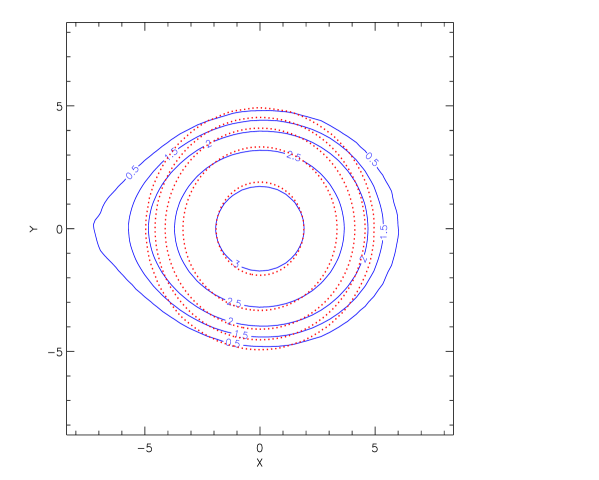
In order to visualize the deformation of the secondary compared to the spherical case, Fig. 3 displays lines of constant density for = 3 and = 3/2. An inspection of Fig. 3 shows that the largest departure from spherical symmetry is observed in the outermost layers of the polytropic star, whereas the central regions are only slightly affected. The results displayed in Table 1 are in excellent agreement with the work of Uryu & Eriguchi (1999), based on a different numerical method. Indeed, for = 3/2 they found distortion effects of 4% for 0.1 1. They however did not analyse the case = 3. A comparison of the numerical ratio , where is the orbital separation, and the ratio given within the Roche model according to Eggleton (1983) shows small differences (less than 2%), in agreement with the results of Rezzolla et al. (2001) and confirming indeed that the Roche potential is a good approximation in the present case (the so-called first assumption, see §1).
3 Application to cataclysmic variable evolutionary models
In order to analyse the consequences of the distortion effects found in the previous section on period and mass transfer rate in CV systems, we follow the secular evolution of the secondary using the same models and input physics as described in Kolb & Baraffe (1999) and Baraffe & Kolb (2000). We focus on systems below the 2-3 h period gap and specifically on the minimum period discrepancy between observations and models. Although distortion effects seem to be more important for systems above the period gap ( h) (see Tab. 1), their consequences are difficult to quantify given the large uncertainties of evolutionary models describing such systems, such as the magnetic braking law and the resulting mass transfer rate, the evolutionary stage of the secondary at onset of mass transfer or the mixing length parameter. Below the period gap, such uncertainties are fortunately considerably reduced (see Baraffe & Kolb 2000; Kolb et al. 2001 for details).
3.1 Geometrical effects
In the following, we only consider the effects of distortion on the geometry of the system. The orbital properties, e.g. the orbital period and separation, and the mass transfer rate will be indeed affected by the larger effective radius of the donor, estimated in §2, compared to the undistorted case. However, for the moment, we ignore the rotational and tidal effects on the thermal structure of the star, assuming that its inner structure is unaffected and determined by the unperturbed stellar structure equations in spherical symmetry. A rough estimate of the thermal effects on the secondary’s properties resulting from its expansion is derived in the next section (§3.2).
We analyse an evolutionary sequence with an initial donor mass of 0.21 , a primary mass of 0.6 , and gravitational radiation (GR) as angular momentum loss mechanism (see Kolb & Baraffe 1999). From the radius obtained from integration of the standard stellar structure equations, and the mass ratio , which varies along the sequence of evolution, the effective radius is derived according to Tab. 1. The mass transfer rate is then calculated as a function of the difference between effective donor radius and Roche radius, following Ritter (1988).
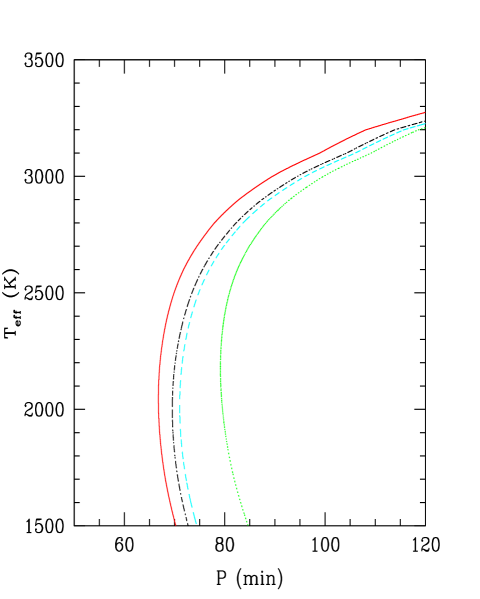
The comparison between sequences without distortion (solid line) and with distortion (dashed line) is shown in the orbital period - effective temperature diagram (Fig. 4). Although reducing the discrepancy with the observed , distortion effects provide an increase of the minimum period of only 6% (or 4-5 min), compared to the undistorted case. This is slightly less than what is naively expected from the period - radius relation . An increase of the radius by 6%, as expected from distortion effects near the minimum period (see Tab. 1), should indeed yield 9% increase of . The smaller effect found on stems from the dependence of angular momentum loss driven by GR on the secondary radius . Consequently, the larger radius in the distorted sequence implies a decrease of , and thus a smaller mass transfer rate . As shown below depends on the ratio of the secondary’s Kelvin–Helmholtz time and the mass transfer time . The decrease of thus yields a decrease of , implying less departure from thermal equilibrium and thus a smaller . Because depends explicitly on the mass of the primary, does also depend on it, but only weakly, as shown by Paczyński & Sienkiewicz (1983), who found that . In fact our computations show that varies from 71 min for = 0.6 to 74 min for = 1.2 , when distortion effects are included.
3.2 Thermal relaxation
In the numerical computations discussed in the previous section, we have not taken into account changes in the thermal reaction of the secondary which must result from its inflation due to tidal and rotational forces. A fully consistent treatment of the distortion effects would imply solving the multi-dimensional stellar structure equations. Rather than doing this we shall in the following derive a rough estimate of the thermal relaxation effects and explore their consequences for the minimum period of CV systems. We indeed expect that the changed surface area of the more distended secondary, as a result of the distorsion effects, will affect its surface luminosity, and thus its thermal properties.
We denote by the quantities of the donor star which result from assuming a pure potential, and by the corresponding quantities of the spherical equivalent of the critical lobe–filling star. Obviously we have
| (1) |
where is the deformation factor for a polytropic index determined in §2.2 (see Table 1). We thus have for the orbital separation and the orbital period
| (2) |
and
| (3) |
Since mass transfer below the period gap is assumed to be driven by loss of angular momentum via gravitational radiation alone, the mass transfer rate can be written as (see e.g. Ritter 1996)
| (4) |
Here is the effective mass radius exponent of the donor star, and the mass radius exponent of the volume–equivalent critical lobe radius222 is equivalent to the mass radius exponent of the Roche radius in the Roche model (see e.g. Ritter 1996). Because
| (5) |
we have
| (6) |
assuming that is the same.
Because of the larger radius of the critical lobe–filling star, its surface is larger, thereby affecting its luminosity, effective temperature and Kelvin–Helmholtz time
| (7) |
Consequently, its thermal relaxation, i.e. its gravo–thermal luminosity will also be different.
In order to estimate the change of , we need to determine the change in with radius . Since donor stars below the period gap are fully convective, we can apply the theory of the Hayashi–line, as described by Kippenhahn and Weigert (1990). Accordingly we get
| (8) | |||||
Here and , where is the photospheric opacity. Typically, for very low–mass stars with atmospheric opacities dominated by molecular absorption, we have and . Therefore
| (9) |
We can now use (1) together with (9) in (7) and obtain
| (10) |
We note that in deriving (10) we have applied in (7) the factor only to the –dependence coming from the luminosity . Indeed, the in the denominator of (7) comes from the gravitational binding energy of the star which is related via the Virial theorem to its thermal energy, i.e. essentially to its central temperature. Since the central regions of the star are expected to be hardly affected by the distortion of the outer layers (cf. Fig. 3), it is not appropriate to also propagate the factor to the remaining factor .
Let us now examine the conditions at the period . For a polytope of index losing mass the effective mass radius exponent can be written as (e.g. Ritter 1996)
| (11) |
where
| (12) |
is the adiabatic mass radius exponent and
| (13) |
is the mass loss time scale. Because at the donor star is characterized by and 333this follows directly from Kepler’s 3rd law, the fact that for , and we obtain from (11) and (12)
| (14) |
at , or
| (15) |
With (cf. Table 1) (15) yields
| (16) |
Eq. (16) means that the 3D–effects, i.e. the reduced mass loss rate and the increased surface luminosity of the more distended star, result in a smaller deviation from thermal equilibrium at . Hence the star is systematically less inflated by the effects of thermal disequilibrium, and this, in turn, compensates at least partially for the systematic increase of the orbital period due to the factor .
A quantitative estimate of the decrease of suggested from (16) can be derived by recomputing the evolutionary sequences including the effect of distortion, as done in §3.1, and by artificially increasing the radiating surface of the donor in the Stefan–Boltzmann law by a factor , as suggested from (10). Note that this is equivalent to increasing the radiating surface by a factor , and to reducing the surface gravity in the integration of the stellar atmosphere by the same factor. The result of such a numerical experiment is displayed in Fig. 4 (dash-dotted line) and shows a slight decrease of by 2-3% compared to the case with pure geometrical effects (dashed line). These results fully confirm the expectation derived from (16), namely that the value of is reduced by taking into account the effects of the changed thermal relaxation.
4 Discussion and conclusions
Although reducing the discrepancy between observed and predicted minimum period, distortion effects seem insufficient to provide a satisfactory solution of the mismatch between calculated and observed minimum period. A combination of distortion effects as estimated in §2 and an angular momentum loss rate of 2–2.5 can reconcile with the observed 80 min value (see dotted line in Fig. 4). Note that without distortion effects, one would need 4 to reach min, as estimated in Kolb & Baraffe (1999). The more modest increase of required according to our calculations is also in better agreement with Patterson’s (1998) estimate based on space density considerations. Additional physical processes can also result in an inflation of the secondary, e.g. irradiation from the primary (Ritter et al. 2000) or star spots (Spruit & Ritter 1983). A rough estimate of irradiation effects or star spots can be derived by following Ritter et al. (2000), i.e. by reducing the effective radiating surface of the star by a factor ). Adopting in our secular evolution calculation a factor and yields a sequence very similar to the one obtained with deformation (dashed line in Fig. 4). If the result resembles the sequence with deformation and (dotted line in Fig. 4). In order to know whether such values of , yielding effects comparable to the distortion effects, are reasonable requires a sophisticated treatment of star spots or irradiation. An investigation of irradiation effects on non-gray stellar atmospheres is in progress (Barman 2001). We stress however that even if distortion, irradiation, star spots or additional sources of are possible solutions for removing the mismatch between observed and predicted minimum period, the so-called period spike problem still remains. A period spike which is a consequence of the accumulation of systems near (where ) is indeed predicted by all models for which or are assumed to be the same for all systems. Even if they are not, it is very difficult to “smear out” the period spike in a population of systems with different individual bounce periods (Barker & Kolb, in preparation). Such a period spike is, however, not observed (see Kolb & Baraffe 1999).
Finally, we note that Kolb & Baraffe (1999) obtained negligible effects on the secondary structure and evolution when applying tidal and rotational corrections to the 1D stellar structure equations, on the basis of the scheme by Chan & Chau (1979). The effect on the total radius in Kolb & Baraffe (1999) is much smaller (%) than that found from the present SPH simulations. Since two different numerical methods, on the one hand the work by Uryu & Eriguchi (1999) and on the other hand the present work, predict the same quantitative deformation effects, we are confident that the results of our SPH simulation are accurate. Although in the SPH simulations we do not take into account the thermal reaction of the star to its inflation and deal with polytropes, on the basis of our simple estimate given in §3.2 we do not expect the thermal effects to significantly reduce the radius of the deformed star. A possible reason for the discrepancy between the calculations by Chan & Chau (1979) and the present results could be the limitation of the former 1D scheme to describe multi-dimensional effects. Figure 3 shows strong effects in the outermost layers which may be difficult to account for with such a scheme. In any case, both approaches have their shortcomings, but they both provide the same conclusion regarding the mismatch of the observed and predicted minimum period.
To conclude, our SPH simulations suggest that tidal and rotational distortion effects on the secondary in semi-detached binaries may not be negligible, and may reach observable levels of 10% on the radius for specific cases of polytropic index and mass ratio. Although this effect yields an increase of the predicted minimum period for CV systems, it remains too small to explain the observed value of 80 min. Additional effects such as irradiation, star spots or extra sources of angular momentum loss still seem to be required, leaving the problem of the minimum period of CV systems unsettled.
Acknowledgements.
We thank W. Benz and H-C. Thomas for valuable discussions. I.B thanks the Max-Planck Institut for Astrophysik in Garching for hospitality during elaboration of this work. The calculations were performed using facilities at Centre d’Etudes Nucléaires de Grenoble.References
- (1) Baraffe, I., Kolb, U. 2000, MNRAS, 318, 354
- (2) Barman, T.S. 2001, in The Physics of Cataclysmic Variables and Related Objects, eds. B. Gänsicke et al., ASP Conf. Series, in press
- (3) Benz, W., Bowers R. L., Cameron A. G. W., Press W. H. 1990, ApJ, 348, 647
- (4) Chan, K.L., Chau, W.Y. 1979, ApJ, 233, 950
- (5) Eggleton, P.P. 1983, ApJ, 268, 368
- (6) King A.R. 1988, QJRAS, 29, 1
- (7) Kippenhahn, R., Weigert, A. 1990, Stellar Structure and Evolution, ed. M. Harvit, R. Kippenhahn, V. Trimble and J.P Zahn
- (8) Kolb, U. 2001, in The Physics of Cataclysmic Variables and Related Objects, eds. B. Gänsicke et al., ASP Conf. Series, in press (astro-ph/0110253)
- (9) Kolb, U., Baraffe, I. 1999, MNRAS, 309, 1034
- (10) Kolb, U., King, A.R., Baraffe, I. 2001, MNRAS, 321, 544
- (11) Kopal, Z. 1959, in Close Binary Systems (New York: Wiley)
- (12) Kopal, Z. 1978, in Dynamics of Close Binary Systems (Dordrecht: Reidel)
- (13) Lai, D., Rasio, F.A., Shapiro, S.L. 1994, ApJ, 423, 244
- (14) Monaghan, J.J. 1992, ARA&A, 30, 543
- (15) Paczyński, B. 1971, ARA&A, 9, 183
- (16) Paczyński, B., Sienkiewicz, R. 1983, ApJ, 268, 825
- (17) Patterson, J. 1998, PASP, 110, 1132
- (18) Press, W. H., Teukolsky S.A., Vetterling W.T., Flannery B.P., 1992, Numerical Recipes in fortran, Cambridge Univ. Press
- (19) Rasio, F.A., Shapiro, S.L. 1995, ApJ, 438, 887
- (20) Rezzolla, L., Uryu, K., Yosida, S. 2001, MNRAS, in press (gr-qc/0107019)
- (21) Ritter, H. 1988, A&A, 202, 93
- (22) Ritter, H. 1996, in Evolutionary Processes in Binary Stars, Proceedings of the NATO Advanced Study Institute, Cambridge, Eds. R. Wijers and M. Davies, Vol. 477, 223
- (23) Ritter, H., Zhang, Z.Y., Kolb, U. 2000, A&A, 360, 969
- (24) Spruit, H.C., Ritter, H., 1983, A&A, 124, 267
- (25) Uryu, K., Eriguchi, Y. 1999, MNRAS, 303, 329
- (26) Segrétain, L., Chabrier, G., Mochkovitch, R. 1997, ApJ, 481, 355
Appendix A Determination of the volume in the SPH calculation
To estimate the final volume of the secondary at the onset of mass transfer in our SPH simulations, we proceed as follows. We first determine the smallest rectangular box containing the secondary star. This box with volume is then filled with points following a Sobol sequence of pseudo-random numbers. Such a sequence is self-avoiding, i.e. the points are spread out randomly but in a uniform way (see Press et al. 1992), allowing a more uniform filling of a volume than a standard random method. Each point within twice the smoothing length of a particle is counted, otherwise it is discarded. The number of points fulfilling such condition determines the volume of the star:
The radius of the star is then defined as the radius of the sphere of same volume:
This method has been tested on spherical and elliptical structures of known volumes. According to these tests, it provides the radius within the size of one particle . Typically, for , we have
Our method thus determines the radius of a star within a systematic error of 4%. Although rough for a precise determination of a stellar radius, the uncertainty is much smaller on the ratio of the radius of the same star at two different times of the simulation. This is the case for the deformation which is the main quantity of interest in our analysis. If is the absolute error on the radius, and the stellar radii at respectively time and , one can write:
For the specific case of distortion calculation, is the radius of the unperturbed polytrope and the radius of the polytrope filling its critical lobe. We find typical values of 12% (see Tables 1) with 4%. Thus the first-order term in our last equation provides a correction of at most 0.5%. Consequently, our method used for estimating the volume is accurate enough for the present study. Note that the test simulations done with 57000 particles give the same distortion factor (by less than 1%) than calculations with 15000 particles.