The Dwarf Irregular/Wolf-Rayet Galaxy NGC 4214: I. A New Distance, Stellar Content, and Global Parameters††thanks: Based on observations made with the NASA/ESA Hubble Space Telescope, obtained at the Space Telescope Science Institute, which is operated by the Association of Universities for Research in Astronomy, Inc., Under NASA contract NAS 5-26555
Abstract
We present the results of a detailed optical and near-IR study of the nearby star-forming dwarf galaxy NGC 4214. We discuss the stellar content, drawing particular attention to the intermediate-age and/or old field stars, which are used as a distance indicator. On images obtained with the Hubble Space Telescope WFPC2 and NICMOS instruments in the equivalents of the , , , and bands, the galaxy is well resolved into stars. We achieve limiting magnitudes of in the WF chips and in the NIC2. The optical and near-infrared color-magnitude diagrams confirm a core-halo galaxy morphology: an inner high surface-brightness young population within ( kpc) from the center of the galaxy, where the stars are concentrated in bright complexes along a bar-like structure; and a relatively low-surface-brightness, field-star population extending out to at least (7 kpc). The color-magnitude diagrams of the core region show evidence of blue and red supergiants, main-sequence stars, asymptotic giant branch stars and blue loop stars. We identify some candidate carbon stars from their extreme near-IR color. The field-star population is dominated by the “red tangle”, which contains the red giant branch. We use the -band luminosity function to determine the distance based on the tip-of-the-red-giant-branch method: Mpc. This is much closer than the values usually assumed in the literature, and we provide revised distance dependent parameters such as physical size, luminosity, Hi mass and star-formation rate. From the mean color of the red giant branch in and , we estimate the mean metal abundance of this population as [Fe/H] dex, with a large internal abundance spread characterized by dex.
1 Introduction.
Recent advances in the study of starburst galaxies at high redshift emphasize the importance of investigating the starburst phenomenon in the local Universe. Lyman-break galaxies (LBGs), for instance, were discovered via a pronounced Lyman break seen in the spectra of galaxies whose far-UV spectra are dominated by emission from massive, young stars (Steidel et al., 1996a). LBGs indeed show many spectroscopic similarities, from the far-UV throughout the optical range, with star-forming galaxies locally (cf. also, Pettini et al., 2001). Steidel et al. (1996 a,b) compared rest-frame UV spectra of LBGs with the UV spectrum of the central star-forming region (NGC 4214-i) in the local Irregular/Wolf-Rayet galaxy NGC 4214 (Leitherer et al., 1996), and point out the striking likeness.
We here present a detailed study of the stellar populations in NGC 4214. This galaxy is spatially so well resolved with the HST that individual stars can be directly observed and placed on a color-magnitude diagram (CMD), the observer’s analog of the Hertzsprung-Russell diagram. This paper is devoted to the characterization of the stellar content of NGC 4214, and to the derivation of its distance via the tip-of-the-red-giant-branch (TRGB) method (Lee et al., 1993). We also make some general inferences about the star-formation history (SFH) of this galaxy.
NGC 4214 is a high optical surface brightness Magellanic Irregular galaxy (see NED) toward the Canes Venatici cloud (de Vaucouleurs, 1975). It is moderately metal-deficient, with a nebular abundance (Kobulnicky & Skillman, 1996), or about using from Grevesse & Sauval (1998) for the Sun’s Oxygen abundance. Morphologically, it consists of multiple blue star formation regions along a central bar-like structure surrounded by a large disk of gas which is seen in radio Hi-observations as having a diameter of up to (Allsopp, 1979). The star-formation regions give the impression of a multi-arm spiral structure (see Fig. 1), but whether NGC 4214 is a dwarf Spiral remains unclear considering its complex velocity field (McIntyre, 1997). NGC 4214 is relatively gas rich even for a Magellanic Irregular galaxy (Sargent & Filippenko, 1991), and it has unusually blue colors (, NED).
NGC 4214 has been studied extensively in the last few years. Two main star-formation regions have been identified in the central parts of the galaxy: the larger NGC 4214-i and the smaller, slightly younger NGC 4214-ii (Fig. 3; Maíz-Apellániz et al. 1999 and references therein). NGC 4214-i is also known as the NW complex, and NGC 4214-ii, as the SE complex. These complexes are rich in Wolf-Rayet stars of both the WN and WC sub-types, which trace very recent star formation (Sargent & Filippenko, 1991; Mas-Hesse & Kunth, 1999). Spectral synthesis models suggest that the nuclear starburst, NGC 4214-i, is about 4 Myr old while NGC 4214-ii is about Myr younger (Leitherer et al., 1996; Mas-Hesse & Kunth, 1999). Thronson et al. (1988) used near- and far-infrared continuum and CO emission line observations to study the star-formation properties of the galaxy, and suggested that its present rate, , is somewhat higher than that averaged over a Hubble time. These conclusions are in agreement with FUV Ultraviolet Imaging Telescope observations by Fanelli et al. (1997).
Past distance estimates for NGC 4214 based on its recession velocity have varied from 3.6 to 7 Mpc (Allsopp, 1979; Thronson et al., 1988; Leitherer et al., 1996; Martin, 1998). Makarova et al. (1997) resolved the brightest blue supergiants (BSG) in a small outlying stellar complex of NGC 4214 with ground-based optical imaging, and derived a distance of 4.1 Mpc. It is well known that such distance estimates suffer from large uncertainties. The new shorter distance derived in this paper, on the other hand, is based on the numerous and well resolved red-giant-branch (RGB) stars. Hopp et al. (1999) first used near-IR photometry of RGB stars with HST/NICMOS to revise the distance of NGC 4124 downward, to about 2 Mpc. An uncertainty in their distance determination came from the lack of a calibration for the infrared tip of the RGB (TRGB) as a distance indicator. However, a small distance to NGC 4214, 2.7 Mpc, also resulted when Drozdovsky et al. (2001) employed the well-calibrated I-band TRGB method based on HST/WFPC2 data. Maíz-Apellániz et al. (2002) confirmed the results from the I-band TRGB method when they determined a distance of Mpc based on a similar set of HST/WFPC2 data. In this paper, we combine optical and near-IR HST data to investigate the location of the TRGB in NGC 4214, to revisit the question of the calibration of the near-IR TRGB as a distance indicator, and to propose a distance of Mpc for NGC 4214. We emphasize that the new distance, 2.7 Mpc, results in a substantial revision in all distance-dependent parameters of NGC 4214.
We present and discuss a deep optical-infrared study of the stellar populations of NGC 4214. We use data from two HST instruments, NICMOS and WFPC2. Multi-color stellar photometry provides us with the opportunity to study directly the resolved stellar populations of different masses, ages and chemical abundances. The analysis of the stellar distribution on CMDs is the most powerful way to investigate population fractions and their spatial variations, to estimate the galaxy distance, and to provide clues to its star formation history.
2 Observations and reductions.
We combine single-star photometry in the optical and near-IR to investigate the distance and stellar content of NGC 4214. Figure 1 shows the location of the WFPC2 and NICMOS fields considered in this study superimposed on a color reproduction of an archival Isaac Newton Telescope image. The Holmberg radius of NGC 4214 is (Allsopp, 1979). Therefore, the stellar halo probably spreads even farther than the field in Figure 1.
The , NICMOS observations were gathered as part of a proposal by our team aimed at studying any putative older stellar populations in star-forming dwarf galaxies. The advantage of using NICMOS to search for bright intermediate-age/old stars is that their spectral energy distributions peak in the near-IR. Another advantage is the smaller extinction of near-IR compared to optical or UV radiation. However, a drawback is that the field of the NIC2 camera, on which we concentrate here, is rather small. Figure 2 presents and band images of NGC 4214; these images cover the young star-forming region NGC 4214-ii.
We also make extensive use of archival WFPC2 observations in , , , , and iii. These data are precious because the -band TRGB is a well-calibrated distance indicator, and any interpretation of stellar content depends critically on an accurate knowledge of the distance. We furthermore use the -band TRGB to bootstrap a calibration for the -band TRGB as an extragalactic distance indicator. The WFPC2 camera has a large field of view, and this allows us to compare spatial variations of different stellar populations. Figure 3 is a color image of NGC 4214 obtained with the WFPC2, made in a similar way as the Hubble Heritage team’s image of this galaxy111http://www.stsci.edu/$^∼$jmaiz/ngc4214E.html.
2.1 NICMOS
We obtained NICMOS observations of NGC 4214 on 1998 July 23 as a part of GO program 7859222 Information about the observations can be gleaned directly from the STScI WWW pages linked to the program ID.. The NICMOS instrument houses three cameras: NIC1, NIC2, and NIC3, in a linear arrangement. Due to its low sensitivity and very small field of view, the NIC1 camera produced images which contain few point sources. The NIC3 images exhibit several bright stars, but the stellar images are out of focus. Therefore, we discuss in this paper only the NIC2 data.
The NIC2 camera, which has a field of view of , was centered at (J2000) R.A. and Dec. on NGC 4214-ii, the smaller and younger of the two prominent star-forming regions. Total integration times were about 5376 s in , and 2688 s in .
We re-ran the STSDAS pipeline calibration with the latest improved calibration files and software available in the standard NICMOS CALNICA pipeline. This software performs bias subtraction, dark-count correction, flat-fielding, masking of bad pixels, and correction of defective columns (bars). Our NIC2 images are almost unaffected by what is known as the “pedestal” problem (an offset between the four quadrants of the camera), so we did not need to correct for this effect. We combined individual dithered images into a mosaic with the DitherII package, which performs a “drizzling” (a variable-pixel linear reconstruction), correction for geometric distortion and removal of cosmic rays (Fruchter & Hook, 2000).
Photometric processing was performed with the DAOPHOT and ALLSTAR programs (Stetson, 1987) run within MIDAS. We applied background-smoothing before conducting stellar photometry. A master frame was produced using both the and images. Two FIND/ALLSTAR/SUBSTAR passes were used to identify stars in this master frame. The resulting list of stellar coordinates was given to ALLSTAR to perform the photometry in the individual and frames using a PSF that quadratically varied with position in the each frame.
The NIC2 images exhibit diffraction rings around the stellar images (see Fig. 2). For the DAOPHOT photometry we made a PSF radius large enough to include all the visible diffraction rings, but used a fitting radius equal to the radius of the first Airy minimum.
We merged the two and star lists requiring a positional source coincidence of better than , or a two pixels box size. Figure 4 shows the error distributions for the photometry.
We derived an aperture correction to the standard aperture from the data. The final photometry uses the photometric zero-points in the HST Vegamag system as provided by the NICMOS team. Subsequent CMDs in the ground-system (, ) use the transformations which we derived in SHGC99 from the NICMOS team’s information about standard-star observations on their photometry WWW site.
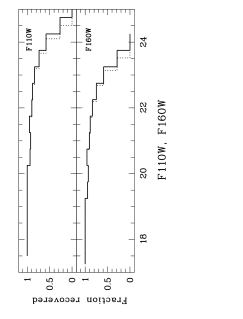
Completeness tests were performed using the usual procedure of artificial star trials (Stetson, 1987). A total of 1,500 artificial stars was added to the - and -band frames in several steps of 150 stars each. These had magnitudes and colors in the range and . Stars were considered as recovered if they were found in both and with magnitudes not exceeding brighter than the initial, injected ones. The outcome of the completeness tests is shown in Fig. 5.
2.2 WFPC2
The WFPC2 observations of program 6569††footnotemark: were obtained on 1997 July 22. The (, total exposure time 1200 s), (, 1000 s), and (, 1200 s), (; 1500 s), and ([iii], 1600 s) frames were centered on (J2000) R.A. and Dec. . WFPC2 consists of one PC chip and three chips, WF2, 3, 4. The center of NGC 4214-i was placed on the WF3 chip, and NGC 4214-ii was located on the WF2 chip. There is spatial overlap between the WF2 and NIC2 pointings, which we capitalize on for a multi-wavelength study of NGC 4214-ii.
The raw frames were processed with the standard WFPC2 pipeline. The processed frames were then separated into images for each individual CCD, and trimmed of the vignetted regions using the boundaries recommended in the WFPC2 Handbook. The locations of bright stars were then measured on each set (one for each combination of filter, position and CCD) to evaluate any systematic changes in position during the sequence of observations. None were found. To check for possible saturation of the brightest supergiants we also reduced and performed photometry on short exposure time (100 s) frames in the and bands. Comparison with the long exposure frames showed a good agreement. Unfortunately, the WFPC2 observations were performed without dithering, so we were unable to enhance the stellar PSF, using the drizzling procedure. We combined the images after cleaning them for bad pixels and cosmic-ray events.
The , , images were processed with DAOPHOT/ALLSTAR. To avoid contamination by nebular emission, we performed -band photometry on -subtracted images, and we performed -band photometry on -subtracted images. Transformation to STMAG was made using header keywords (WFPC2 photometry cookbook). We used Holtzman et al. (1995) to transform instrumental magnitudes into the standard , , and system. Figure 6 shows the error distributions for the photometry.
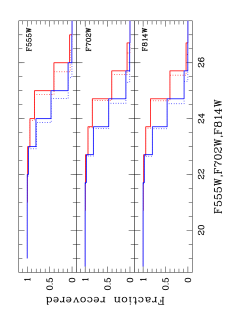
We performed completeness tests with the goal of assessing the accuracy of the TRGB distance determination. We used only those areas on the WFPC2 chips which are outside of the star-forming regions, and the completeness tests are consequently only relevant to those areas. For the WFPC2 completeness tests, we added a total of 5,000 artificial stars to the , and frames of NGC 4214. We added artificial stars with magnitudes and colors in the range , or , in several steps of 500 stars each. The completeness curves for red stars are shown in Fig.7.
3 Results
3.1 Extinction and foreground contamination
The Galactic coordinates of NGC 4214 are . In the maps of Burstein & Heiles (1982), the extinction is , but in the IRAS/DIRBE map of Schlegel et al. (1998) it is . We adopt the latter value. With and the extinction law of Cardelli et al. (1989), Galactic foreground extinction is: , , , , and .
Internal extinction is very uncertain for the central part of NGC 4214. There are large discrepancies in the values derived with different spectroscopic methods (e.g. Maíz-Apellániz et al., 1998; Mas-Hesse & Kunth, 1999). Using the continuum slope of the ultraviolet spectrum and assuming that Galactic foreground extinction is negligible, Leitherer et al. (1996) found a color excess of for NGC 4214-i. After correction for Galactic extinction from Schlegel et al. (1998) this value corresponds to . But optical spectroscopic measurements of Balmer emission lines give an internal reddening for NGC 4214-i/ii from (Sargent & Filippenko, 1991) up to (Mas-Hesse & Kunth, 1999).
According to these data, dust appears concentrated near the boundaries of the ionized NGC 4214-i region, affecting mainly nebular emission lines, while the stellar continuum itself is located in a region relatively free of dust and gas (MacKenty et al., 2000). The less affection by extinction of the stellar component than the ionized gas seems to be common for some of WR/Irregular galaxies (Kunth & Schild, 1986)
The WFPC2 images clearly show several dust lanes, which are more pronounced across the bright NGC 4214-i complex. Unfortunately, WFPC2 observations in the -band were not deep enough to derive stellar photometry we could use to estimate the extinction toward field stars. Therefore, we have not attempted to correct these data for internal extinction.
Thanks to its high galactic latitude, we expect the number of foreground stars toward NGC 4214 to be very small. This has been verified using Ratnatunga & Bahcall (1985), who determined the Galactic stellar density toward globular clusters. The nearest cluster to NGC 4214 is Pal 4 (, ). The number of stars expected down to a limiting magnitude is 7 stars arcmin-2. WFPC2 covers arcmin2, so the model predicts Galactic stars. For the NIC2 image we predict less than one star for the entire field down to the limiting magnitude. We found a few background galaxies in the WFPC2 frames, and rejected them from the star list.
3.2 Colour-magnitude diagrams
3.2.1 NICMOS
A CMD of the near-IR photometry is displayed as Fig. 8, in terms of magnitudes in the VegaMAG system. There are stars detected in both the and filters with ALLSTAR parameters in the intervals and . The CMDs are characterized by a strong red plume and a weak blue plume. Most of the stars in the red plume appear at faint magnitudes; this is the red tangle which contains the RGB. Above this tangle is a population of possible asymptotic giant branch (AGB) and RSG stars. Note the pronounced fall off in the number of stars redder than , an almost vertical “border”. We saw a similar feature in our data and modeling for Mrk 178 (Schulte-Ladbeck et al., 2000).
3.2.2 WFPC2
The optical CMDs which result from single-star photometry on the WFPC2 chips are shown in Fig. 9, in terms of magnitudes in the STMAG system. In determining the distance and metallicity based on the TRGB method, we rely on the assumption that as we go away from the star-forming regions of NGC 4214, star counts become less contaminated by young and intermediate-age stars. Such stars can overlap the RGB above its tip and tend to smear out the TRGB “edge” in the luminosity function (LF; Sakai & Madore 1999). Figure 10 illustrates how we chose areas outside of the star-forming regions based on H-isophotes. These areas also exhibit less crowding and less internal extinction than the regions of active star formation. The CMDs of these “field” regions corrected for Galactic extinction are shown in Fig. 11. There are stars detected in both the and filters in all four WFPC2 frames with and ALLSTAR parameters in the intervals and . About 23,000 point sources are detected after merging the and star lists, and applying the same selections.
3.2.3 Optical and near-IR data combined
The NIC2 images are situated well within the WF2 images of NGC 4214. We cross-identified sources found in both cameras by transforming the WF2 coordinates into the NIC2 system. We then merged our photometry lists requiring a positional source coincidence of better than , and investigated the distribution of stars on a variety of two-color diagrams and CMDs (Fig. 12). There are stars in the [,] CMD, and stars in the [,] CMD.
Few simultaneous optical–near-IR stellar CMDs of external galaxies are available to date. Comparing our data with those of VII Zw 403 (SHGC99) reveals a great deal of similarity. Note that the red plume continues to dominate in the [,] CMD, but the blue and red plumes are about equally well populated in the [,] CMD. The [,] CMD has a color baseline of 8 mag, and shows a pronounced separation of the blue and red plumes.
We also show the distribution of stars on the , two-color diagram. The effect of differential reddening could in principle be detected on a two-color diagram, but the distribution of stars in these particular colors corresponds closely with the direction of the reddening vector. Recall that the observations in did not provide useful photometry.
4 Discussion
4.1 Distance and metallicity
| Band | ||
|---|---|---|
| Source | Error |
|---|---|
| NICMOS | |
| Residuals from PSF fitting | |
| Tip measurement in VII Zw 403 | |
| Tip measurement in NGC 4214 | |
| Galactic extinction | |
| Internal extinction | |
| Total random errors | |
| RR Lyrae distance | |
| Absolute magnitude of TRGB | |
| Transformation to and | |
| Photometric zero points | |
| Total systematic errors | |
| WFPC2 | |
| Residuals from PSF fitting | |
| Tip measurement | |
| Galactic extinction | |
| Internal extinction | |
| Total random errors | |
| RR Lyrae distance scale | |
| Absolute magnitude of TRGB | |
| Transformation to | |
| Photometric zero points | |
| Total systematic errors |
The absolute magnitude of the TRGB gives an estimate of distance with precision and accuracy similar to that of the Cepheid method (Lee et al., 1993; Bellazzini et al., 2001). It is slightly dependent on metallicity. A metallicity determination is made to correct for this dependence. The -band TRGB method has been successfully applied to a wide range of dwarf galaxies, using both ground-based and HST photometry. We first present a distance to NGC 4214 based on this well established technique. It is also desirable, in some cases, to be able to extend the TRGB method to the near-IR. In SCHG99, we combined , , , photometry obtained with HST WFPC2 and NIC2 in order to bootstrap a calibration for the near-IR TRGB from the optical TRGB for the case of the metal-poor Blue Compact Dwarf galaxy VII Zw 403. The location of the TRGB in and depends more strongly on metallicity than does the location of the TRGB in . Furthermore, color is not a good indicator of metallicity. The second part of this section involves deriving a distance to NGC 4214 from the calibrations which we derived for VII Zw 403. This assumes that the RGB of NGC 4214 has a low metallicity similar to that of VII Zw 403. Indeed, the distance so derived agrees with that determined from the optical TRGB. Finally, we also derive an independent calibration for the NGC 4214 -band TRGB using as input the -band TRGB and the metallicity derived from color. We discuss the dependence of the -band TRGB on metallicity in the following subsection.
The location of the TRGB is commonly found by computing a luminosity function (LF) along the red plume, and then applying an edge-detecting Sobel filter (Sakai et al., 1996). Fig. 13 shows the LFs and Sobel-filtered LFs in , , and . We computed the LFs by counting stars lying inside a bin of . The central value was varied in steps of to reduce the dependence of our results on the particular choice of bin center.
For the near-IR LFs, we selected all stars in the color interval . In the optical, our selection proceeded as follows. The photometric limits in the [,] CMD are deeper than in the [,] CMD, while the color resolution is better in . Therefore, while we used the [,] CMD for deriving the metallicity, we selected stars on the [,] CMD for deriving the position of the TRGB. To obtain the magnitude of the TRGB we used the LF of the stars in the color interval . Note that only the “field” regions which are free of ionized gas emission are used for the optical TRGB determination. Finally, an edge-detecting Sobel filter was applied to the LFs; the position of the TRGB is identified with the highest peak in the respective filter output function. The TRGB magnitudes so derived are listed in Table 1.
The color of the TRGB is necessary to calculate the bolometric correction to be used in the -distance calibration. It is taken as the median color index of the stars with . We find which, when corrected for external extinction, yields . For the RGB stars the average stellar metallicity can be obtained from the index , which is the color index of the RGB half a magnitude below the TRGB (see Da Costa & Armandroff, 1990; Lee et al., 1993; Bellazzini et al., 2001). We believe that the TRGB is at (see below). The median color between and , which we use to determine , is . Using the calibration by Lee et al. (1993), we obtain a metallicity [Fe/H] dex (), and an internal abundance spread with a total range of -1.0 dex from the intrinsic color width of the RGB. This width could result from metallicity or age variations in an evolving RGB population, but other factors such as internal extinction might also contribute.
Using the calibration by Lee et al. (1993), we obtain . We then derive a distance modulus , corresponding to Mpc. The error budget is given in Table 2. Note that we estimate the error in foreground extinction adopting a 16% accuracy of the Schlegel et al. (1998) maps. For the error in internal extinction, for which we have no direct measurement, we estimate 0.1 mag. Our total error is (random & systematic) or Mpc.
The near-IR distance modulus of NGC 4214 may be derived using the calibration which was established for VII Zw 403 in Schulte-Ladbeck et al. (1999, SHGC99),
and
where the first error is the statistical error and is dominated by how well we can determine the location of the TRGB in VII Zw 403, and the second one is the systematic error primarily due to the RR Lyrae distance calibration of the TRGB (see Schulte-Ladbeck et al., 1998, SCH98).
Using this calibration, we determine the following distance moduli for NGC 4214
and
.
The error budget is again listed in Table 2.
The RGB stars of NGC 4214 have a mean metallicity that is close to that of VII Zw 403, [Fe/H]=-1.7 -1.9, respectively (both are based on color). Therefore, we expect the near-IR TRGB to be close to the optical TRGB. This is indeed observed.
We also note that a purely theoretical calibration of the TRGB method was presented by Cassisi & Salaris (1997), who used evolutionary models of stars. If we adopt this calibration instead of that of Lee et al. (1993), we obtain , and thus a distance modulus of . This corresponds to a distance of 3.0 Mpc, about 10% farther.
As discussed above, distance estimates to NGC 4214 have been a matter of some debate. A comprehensive discussion of the distance to NGC 4214 was given in Makarova et al. (1997), who adopt a value of 4.1 Mpc based on ground-based photometry of the brightest blue stars, but they noted that this value is an upper limit. The average magnitude of the three brightest stars in a galaxy is a simple, frequently used method to estimate the distance. However, the brightest supergiants method has large errors. For illustrative purposes, we derive the distance to NGC 4214 by this method also. The HST data resolve the supergiant populations somewhat better than the ground-based data do, and hence the apparent magnitudes of the brightest stars should decrease (because of less blending), as should the distance modulus. The mean apparent magnitude of the brightest blue stars can be estimated from our photometry (using now the CMD of all 4 WFPC2 chips, not just that of the “field” regions). In order to make a direct comparison with Makarova et al. (1997), we used the transformation obtained from blue [] standard stars of Landolt (1992). Applying this to the stars with ,the mean apparent magnitude of the three brightest BSGs is . Using the standard relation from Karachentsev & Tikhonov (1994), an extinction , and the total apparent blue magnitude from the RC3, , we get . This is close to the TRGB distance. However, using the magnitude of three brightest red supergiants (RSG), and the calibration of Karachentsev & Tikhonov (1994), , we derive , which is about 1 mag larger than the distance modulus via the TRGB method or more than 50% larger in distance.
4.2 Calibrating the -band TRGB
In this section, we use the new data on NGC 4214 to provide an additional calibration of the absolute -band magnitude at the TRGB as a distance indicator. This study began in SHGC99, and continued in Hopp et al. (2001). Fig. 14 represents an update, with the data point for NGC 4214 included.
Knowing the location of the optical TRGB of NGC 4214, we can predict where we should have found the -band TRGB. The transformed magnitude at the TRGB using the transformations from SHGC99 is
m = 218 01.
Given that the distance modulus based on the well-established -band TRGB method is , we predict the absolute magnitude at the TRGB to be
M
This is the new calibration included in Fig. 14.
The TRGB in offers the advantage of being about 2 mag brighter, on average, than the TRGB in . Unfortunately, theoretical stellar models indicate a complicated relationship between [Fe/H] and the TRGB in . The -band magnitudes from the Padova isochrones (Bertelli et al. 1994, see also Fagotto et al. 1994) for 15 Gyr old stars for the largest available metallicity range are shown in Fig. 14. We also compiled , data of globular clusters in the Milky Way and the LMC from the literature (see SHGC99). This yields an observational measure of the dependence of absolute -band TRGB magnitude on metallicity. The major difficulty of this approach is that frequently, the empirical RGBs of clusters are not sufficiently populated near the tip to provide a reliable tip magnitude.
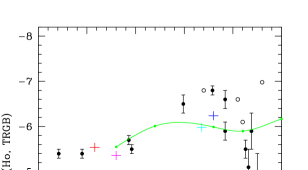
The release of the Two Micron All Sky Survey (2MASS) data made it possible to include near-IR data for field stars in the LMC and the SMC in our comparison (see also Hopp et al., 2001). The data for the LMC and the SMC were taken from the point source catalog of the second incremental data release333http://www.ipac.caltech.edu/2mass/releases/second. Figure 15 shows CMDs for the central fields ( radius) of the LMC and the SMC in the 2MASS system, which is similar to the CIT/CTIO system. The major advantage of this data set is that there are such large numbers of RGB stars detected that we need not worry about stochastic fluctuations in the luminosity functions near the TRGB due to small number statistics, but only about AGB contamination. Our best estimates for the TRGB magnitudes are for the LMC and for the SMC, with a read-off error of about .
The foreground extinction according to Schlegel et al. (1998) are A for the LMC, and A for the SMC, so that the extinction-corrected TRGB magnitudes are for the LMC, and for the SMC. In order to place these data points onto Fig. 14, we need distances and metallicities for the LMC and SMC.
The SMC and LMC distances have been a matter of some debate in the recent literature. Distances and metallicities of the LMC and SMC using single-star near-IR photometry were recently derived by Cioni et al. (2000). We decided to adopt their values here. They find m-M = ( formal, systematic) for the LMC, and m-M = ( formal, systematic) for the SMC. This results in M for the LMC and M for the SMC. We assume [M/H] = -0.7 for the LMC, and [M/H]= -0.82 for the SMC from Cioni et al. (2000) to represent the Fe/H values of the RGB stars in Fig. 14.
A comparison of empirical RGB-based distance and metallicity determinations of VII Zw 403, NGC 4214, the LMC and the SMC, with the 15 Gyr isochrones in the Padova library shows that there is excellent agreement between observation and theory. Fig. 14 supports our conclusion from SHGC99 and Hopp et al. (2001) that M is indeed a good approximation to use for deriving the distances of galaxies with very low metallicities.
4.3 Distance-dependent global parameters
The distance dependent global parameters of NGC 4214 are summarized in Table 3. At our newly determined distance of 2.7 Mpc, an angular scale of corresponds to a physical scale of 13 pc. The diameter of NGC 4214 (D25 from the RC3) is . This corresponds to a linear size of 6.7 kpc. The total apparent blue magnitude from the RC3, , translates into a total absolute magnitude of , or a blue luminosity of about L☉ (for MB,☉=5.41).
At our new distance, the Hi flux measured by Huchtmeier & Seiradakis (1985) corresponds to an Hi mass of . Note that the ratio of the Hi mass to the blue luminosity (in solar units) is 0.7; this value is typical compared with the compilation of dwarf-galaxy /LB ratios given in Huchtmeier et al. (1997). A total molecular mass for NGC 4214 estimated from flux by Walter et al. (2000) for the corrected distance gives .
The star formation rate (SFR) is one of the most important parameters for studying the evolution of galaxies. When individual young stars are unresolved the star formation properties of galaxies come from integrated light measurements in the ultraviolet (UV), far-infrared (FIR), 1.4 GHz-radio or nebular recombination lines (e.g. Condon, 1992; Kennicutt, 1998). These diagnostic methods are based on population synthesis modeling. MacKenty et al. (2000) measured the H fluxes of the prominent Hii-regions. We derive a total luminosity, corrected for foreground extinction only, of L(H) ergs s-1. A similar value is derived from Martin (1998). Following Hunter & Gallagher (1986), who adopt the Salpeter IMF from 0.1 to 100 , we find the SFR yr-1. Considering the unknown internal extinction and any emission outside the WFPC field of view, we regard this as a lower limit to the SFR. Using the calibration from Kennicutt (1998) instead, we derive a SFR of yr-1. These values are consistent with that derived by Gallagher et al. (1984), yr-1 (after rescaling to our distance).
Fanelli et al. (1997) used the total FUV 1500Å flux to estimate the SFR of NGC 4214. They used starburst models for two limiting cases: a 3 Myr burst with IMF slope = -1.35 and a mass range , ; and a continuous star formation model with the same parameters otherwise. Only correction for Galactic extinction was taken into account. We rescaled this SFR to the new distance and derive a value of yr-1, in good agreement with the value from the H flux. Using the 1.4 GHz flux of the central body from Allsopp (1979), mJy, and the calibration from Haarsma et al. (2000), we derive a SFR of yr-1. The IRAS m flux of 17.87 Jy, with the calibration of Cram et al. (1998), yields a SFR of yr-1.
| Parameter | Value | Ref. |
|---|---|---|
| Distance modulus | 1 | |
| Distance | 2.7 Mpc | 1 |
| Linear size (D) | 6.7 kpc | 2 |
| MB,total () | 2 | |
| LB (for M) | L☉ | 2 |
| 3 | ||
| 4 | ||
| L (FUV) | ergs s-1 Hz-1 | 5 |
| L (H) | ergs s-1 | 6,7 |
| L (1.4 GHz) | ergs s-1 Hz-1 | 8 |
| L (m) | ergs s-1 | 9 |
| SFR (H) | yr-1 | 10 |
| SFR (UV) | yr-1 | 11 |
| SFR (Radio) | yr-1 | 12 |
| SFR (FIR) | yr-1 | 13 |
How reliable are these SFRs? Apart from discrepancies that might arise from the applicability of the calibrating relationships from luminosity to SFR (e.g. Cram et al., 1998), the main factor causing differences in the derived SFRs of NGC 4214 is that fluxes in different wavelengths refer to different measurement beams or apertures, which in turn covered different galaxy areas. Numerous star formation complexes in NGC 4214 are traced out to large galactocentric distances. The radio and the IRAS data have the largest beam sizes and included a larger fraction of the galaxy body (and possibly some of external background sources too) than did the UV and the H measurements. Therefore, the fact that the total SFRs agree to within a factor of three suggests that the two main complexes, NGC 4214-i and ii, dominate the young stellar population of NGC 4214.
Evidence for large cavities in the interstellar medium of NGC 4214 around sites of massive star formation has been found from ionized and neutral hydrogen observations (Maíz-Apellániz et al., 1999; MacKenty et al., 2000; Walter et al., 2000). The cavities appear to have been created by stellar winds from young massive stars and supernova explosions. As was mentioned by Leitherer et al. (1996), this may cause an underestimate of the current SFR.
Another possible reason for differences in the derived SFRs is that each of the four indicators we use is associated with a different time scale. Therefore, a limitation, which is shared by all of the methods, is the dependence of the derived SFRs on the assumed star formation history (SFH). Most of these calibrations use a model of continuous SFR over a time scale of years or longer, and are not really acceptable for young starburst galaxies (Kennicutt, 1998). For example, burst models for a 9-million-year-old population yield SFRs that are 57% higher than those with the assumption of constant SFR (e.g. Leitherer et al., 1995).
Gallagher et al. (1984) explored the star formation history of NGC 4214 using three parameters that sample its SFR at different epochs: (1) the mass of a galaxy in the form of stars, which measures the SFR integrated over a galaxy’s lifetime; (2) the blue luminosity, which is dominated primarily by stars formed over the past few billion years; and (3) the Lyman continuum photon flux derived from H luminosity, which gives the current ( yr) SFR. They found that NGC 4214 is among the burst/postburst irregular galaxies and assumed a scenario of roughly constant star formation over the recent few hundred million years. In paper II, we shall present our own models of the SFH of NGC 4214 based on the photometry discussed in this paper. The data have good time resolution and will provide a detailed SFH for the past Gyr. In addition, we can also (weakly) constrain the birthrate parameter based on the modeled data. Note that the mere appearance of the CMDs of NGC 4214 is already very supportive of a quasi-continuous mode of star formation, as inferred by Gallagher et al. (1984).
Note that NGC 4214 contains sufficient neutral gas to maintain a rate of yr-1 for a Hubble time.
4.4 Stellar Content and its Spatial Variation
Figure 10 illustrates the spatial positions of the brightest blue and red stars. We selected the brightest stars as having and for the blue stars (for a total of 163 stars) and for the red stars (for a total of 313). The stellar populations in NGC 4214 show the younger stars to be spatially clumped. Overall, most of the brightest blue and red stars are concentrated in the two main star formation complexes. The largest stellar density occurs near the center of the H cavity, Super Star Cluster (SSC) I-A in MacKenty et al. (2000) notation. Photometry in this region has a low completeness, due to high crowding of the stellar images. NGC 4214 has a substantial young population also outside of its major star-forming complexes. Concentrations of bright stars are seen outside the central area, possibly tracing a continuation of the blue bar/arm-like structures seen in the Isaac Newton Image (Fig. 1).
To examine the stellar content and its spatial variations across the HST field of view, we use the H flux outer isophotes (see Figure 10) to separate the stellar populations into “field” regions which are free from ionized gas emission, and the more complicated regions inside the star-forming complexes.
Fig. 16 shows the [()0,] CMD of these “field” regions in terms of absolute magnitudes. This CMD has characteristics typical of the CMDs of other dwarf galaxies, with evidence for both old and young populations. The main feature of this CMD is the concentration of stars that extends between and . This corresponds to the “red tangle” which is anticipated to be populated by RGB, AGB and blue loop (BL) old and intermediate-age stars. There is also a considerable population of blue stars () in this CMD, suggesting that there are young stars in the field. Note that the object identified with the most luminous BSG is actually part of the field-star population, outside the H regions. This is also true for the most luminous RSGs. The dominant feature of the CMD is the red tangle, with a stellar density which is clearly higher than that in the blue plume and in the top of the red plume. In Fig. 16 we superimpose on the CMD the globular cluster ridgelines of Da Costa & Armandroff (1990). This serves to further illustrate the large width of this feature. In principle, the red tangle could contain stars with ages all the way up to a Hubble time. The dominance of the red tangle in the field of NGC 4214 suggests that the galaxy possesses an underlying sheet of intermediate-age and possibly ancient stars.
The NIC2 observations encompass NGC 4214-ii. Figure 17 shows the near-IR CMD transformed into and . Despite the fairly large uncertainty in such transformations (see SHG99) an advantage of transforming the data into the system is that our CMDs and LFs can be more readily compared with the few available ground-based data of similar galaxies in the near-IR (see § 4.2). We also overplot a selection of stellar evolutionary tracks. We find that a range of stellar phases is included in the CMD of this region. The track () provides an envelope to the blue and red supergiant populations detected in this region. However, the CMD also clearly shows the underlying older stars of NGC 4214, which we represent with tracks at and . In addition, there is a substantial population of AGB and thermally pulsing, or TP-AGB, stars. We give intermediate-mass tracks for , noting that they terminate at the first thermal pulse. Sources with are probable carbon-rich TP-AGB stars (carbon stars).
The [,] CMDs of the unsaturated stars lying in the complexes NGC 4214-i ( stars) and NGC 4214-ii ( stars) are shown in Fig. 18. A comparison of the CMDs inside the star-forming regions with the CMD of the field-star population indicates substantial similarities between the two. The most obvious difference is the almost complete absence of red tangle stars with colors between about 1 and 2 mags. in the CMDs of the complexes. This corresponds to a lack of stars between the low and high metallicity tracks for a star. We attribute this paucity of red tangle stars to severe crowding. Experience has shown that the red background sheet is not seen in the presence of high crowding inside star-forming regions (e.g. Schulte-Ladbeck et al., 1998). The CMD of NGC 4214-i is similar to that of NGC 4214-ii. Both show bright blue supergiants near . The track () is a good envelope to the distribution of the brightest stars on the optical CMD of NGC 4214-ii. This agrees with our finding from the near-IR. The CMD of NGC 4214-i exhibits a number of stars which are more luminous, and are located near the track (). However, since the total number of stars on the CMD of NGC 4214-i is higher than that on the CMD of NGC 4214-ii, the probability of finding rare, luminous stars is also higher here. We would not want to derive an age difference between the two regions based on the CMDs in Fig. 18 alone; a careful analysis of the crowding properties of the two regions would be necessary. In NGC 4214-i there are a few extremely red stars with , which are TP-AGB stars. Such extremely red stars appear to be missing in NGC 4214-ii. Again, since the TP-AGB phase is a short-lived phase of stellar evolution, a smaller number of stars in NGC 4214-ii is expected based on the smaller total number of stars on its CMD.
The work of MacKenty et al. (2000) allows us to give H-derived SFRs normalized to area for the two prominent SF complexes, NGC 4214-i and ii. For NGC 4214-i we derive yr-1 pc-2, and for NGC 4214-ii we determine yr-1 pc-2, using the calibration of Kennicutt (1998). These two complexes also resolve at 1.4 GHZ in the FIRST, Faint Images of the Radio Sky at Twenty centimeters Becker et al. (1995), database. For NGC 4214-i we find yr-1 pc-2, and for NGC 4214-ii we calculate yr-1 pc-2. The agreement between the two estimators is quite good. Both identify NGC 4214-ii as the complex with the higher SFR/area.
To summarize, we find that stars populate the CMD of NGC 4214 throughout all of the major phases of stellar evolution above our detection limits. The relative numbers of stars in different phases can in principle give the variation of the SFR with time and spatial location. However, this requires a detailed modeling of the CMDs, which is not included in this paper. Since all of the major stellar phases are represented on the CMDs, we conclude that the star formation was more or less continuous (gasping scheme, see Tosi, 2001) in recent times (last 1-2 Gyrs). Given that young stars are found in the field, we note that the star-formation activity is not exclusive to the high-surface-brightness, central complexes. The SFH can be traced back to at least 1-2 Gyr ago, the minimum age compatible in the Padova library with a distinct TRGB feature. Stars could have formed even earlier in the history of NGC 4214, but we cannot tell from the CMD. We can also use the spatial distribution of stars as an age tracer. RGB and AGB stars are seen throughout the entire visible disk of NGC 4124. While massive, young stars are also scattered throughout the disk of NGC 4214, there is a distinct concentration of luminous stars in the core, from which most of the H luminosity originates as well. Therefore, most of the on-going activity takes place near the center of the distribution of the older stars.
4.5 Environment

Our new distance estimate places NGC 4214 on the near side (or possibly in the foreground) of the CVn Cloud of galaxies. One of more prominent galaxies of the CVn Cloud, NGC 4214 has some possible nearby companions. The dwarf galaxy DDO 113, and the starforming irregular galaxy NGC 4190, have similar radial velocities as NGC 4214 and angular separations from NGC 4214 of . Allsopp (1979) suggests that since the Hi emissions of NGC 4214 and NGC 4190 extended towards each other, they might be experiencing a physical interaction.
The spatial structure of the CVn Cloud is poorly known. The distribution of galaxies within this complex is quite scattered, and it is not clear whether it is gravitationally bound (Karachentsev & Drozdovsky, 1998). Fig. 19 illustrates the three-dimensional distribution of potential CVn member galaxies on the sky. We obtained the catalog from Karachentsev (1999, private communication), and determined distances to the LG barycenter using photometric distances in the literature (Karachentsev & Tikhonov, 1994; Georgiev et al., 1997; Makarova et al., 1997, 1998; Tikhonov & Karachentsev, 1998; Karachentsev & Drozdovsky, 1998; Schulte-Ladbeck et al., 1999; Crone et al., 2000; Schulte-Ladbeck et al., 2000, 2001). The standard deviation in radial velocities of CVn cloud galaxies is about +65 km/s. The photometric distance estimates have a standard deviation of Mpc. More accurate distance determinations, similar to that which we presented in this paper for NGC 4214, are needed for the other possible member galaxies before we can provide more stringent constraints on the spatial structure and kinematics of the CVn cloud.
5 Concluding Remarks
We present , , , , photometry of resolved stars in the star-forming dwarf galaxy NGC 4214. The optical and near-IR data show stellar populations which are distinct in structure and color: a low-surface-brightness stellar population of intermediate-age/old stars which is co-spatial with a sparse young field-star population, and an inner ( kpc) high-surface-brightness young population which is co-spatial with the most prominent H-ii regions.
NGC 4214 has a complex physical structure. Whereas the spatial distribution of red stars is almost uniform and traces the large stellar disk, the distribution of brightest blue stars is clumpy and follows the central bar, along with arm-like chains of stellar associations and H-ii regions.
The CMDs are populated by stars in a range of evolutionary phases: young MS, BSG, and RSG stars, young and intermediate-age BL and AGB stars, TP-AGB stars (amongst them candidates for carbon stars), and intermediate-age and possibly old RGB, stars. These populations trace star formation back as much as 1-2 Gyr ago. In paper II, we shall present solutions for the SFH of NGC 4214 based on model CMDs. The appearance of the CMDs of NGC 4214 is suggestive of the “gasping”, rather than the “bursting”, mode of star formation.
Assuming that the red tangle outside of the most prominent regions of active star formation is dominated by old RGB stars, we derive a stellar metallicity of about ([Fe/H] dex). The ionized gas metallicity (O abundance) of about suggests some metallicity evolution. However, we note that the RGB of NGC 4214 has a substantial width, which could be due to a spread in metallicity or age, plus internal extinction.
We derive a distance of Mpc from the TRGB. Using the optical and near-IR CMDs we define more precisely the relationship between the metallicity of the RGB stars and their tip in the near-IR. For this we use our new results for NGC 4214, determinations of SHGC99 for VII Zw 403, and 2MASS data obtained for the Magellanic clouds. A comparison of empirical data with the 15 Gyr isochrones in the Padova library indicates that there is an excellent agreement between observation and theory.
Our distance estimate leads to a revision of all distance-dependent global parameters (Table 3). As our value is about 1.5 times closer than was adopted in many previous papers, absolute luminosity estimates should be reduced by a factor of . Given that its revised absolute blue magnitude is , NGC 4214 definitely qualifies as a dwarf galaxy. We find an H-based SFR of (MacKenty et al., 2000; Kennicutt, 1998) for NGC 4214-I-As, the complex used for the spectral comparison with Lyman-break galaxies (Steidel et al., 1996b). In conclusion, NGC 4214 exhibits global parameters that are rather typical for a dwarf Irregular galaxy. Its star formation properties are much less extreme than previously thought (e.g. Thronson et al., 1988; Fanelli et al., 1997), a fact that must be taken into account when it is compared with high-redshift galaxies.
References
- Allsopp (1979) Allsopp N.J., 1979, MNRAS, 188, 765
- Becker et al. (1995) Becker, R. H., White, R. L., Helfand, D. J. 1995, ApJ, 450, 559
- Bell & Kennicutt (2001) Bell E.F., & Kennicutt R.C.Jr., 2001, ApJ, 548, 681
- Bellazzini et al. (2001) Bellazzini M., Ferraro F.R., & Pancino E., 2001, ApJ, 556, 635
- Bertelli et al. (1994) Bertelli G., Bressan A., Chiosi C., Fagotto F., Nasi F., 1994, A&AS, 106, 275
- Burstein & Heiles (1982) Burstein D., & Heiles C., 1982, AJ, 87, 1165
- Cardelli et al. (1989) Cardelli J.A, Clayton G.C., Mathis J.S., 1989, ApJ, 345, 245
- Cassisi & Salaris (1997) Cassisi S., & Salaris M., 1997, MNRAS, 285, 593
- Cioni et al. (2000) Cioni M.-R.L., van der Marel R.P., Loup C., Habing H.J. 2000, A&A, 359, 601
- Cole et al. (2000) Cole A.A., Smecker-Hane T.A., Gallagher III J.S. 2000, AJ, 120, 1808
- Condon (1992) Condon J.J. 1992, ARA&A, 30, 575
- Condon (1998) Condon J.J. 1998, AJ, 115, 1693
- Crone et al. (2000) Crone M., Schulte-Ladbeck, R.E., Hopp, U., & Greggio, L., 2000, ApJL, 545, 31
- Cram et al. (1998) Cram L., Hopkins A., Mobasher B., & Rowan-Robinson M., 1998, ApJ, 507, 155
- Drozdovsky et al. (2001) Drozdovsky I.O., Schulte-Ladbeck, R.E., Hopp, U., Greggio, L., & Crone M., 2001, “Dwarf Galaxies and Their Environment”, eds. K.S. de Boer, R.-J. Dettmar, U. Klein, Shaker Verlag, 107
- Da Costa & Armandroff (1990) Da Costa G.S. & Armandroff T.E., 1990, AJ, 100, 162
- Fagotto et al. (1994) Fagotto F., Bressan A., Bertelli G., Chiosi C., 1994, A&AS, 104, 365
- Fanelli et al. (1988) Fanelli M.N., O’Connell R.W., Robert W., Thuan T.X., 1988, ApJ, 334, 665
- Fanelli et al. (1997) Fanelli M.N., Waller W.W., Smith D.A., Freedman W.L., Madore B., Neff S.G., O’Connell R.W., Roberts M.S., Bohlin R., Smith A.M., & Stetcher T.P., 1997, ApJ, 481, 735
- Fruchter & Hook (2000) Fruchter A.S., & Hook R.N., 2000, PASP, in press (astro-ph/9808087)
- Gallagher et al. (1984) Gallagher J.S., Hunter D.A., & Tutukov A.V., 1984, ApJ, 284, 544
- Georgiev et al. (1997) Georgiev Ts.B., Karachentsev I.D., & Tikhonov, N.A., 1997, AstL, 23, 514
- Grevesse & Sauval (1998) Grevesse N., & Sauval A.J., 1998, Space Science Reviews, 85, 161
- Haarsma et al. (2000) Haarsma D.B., Partridge R.B., Windhorst R.A., & Richards E.A., 2000, ApJ, in press, astro-ph/0007315
- Holtzman et al. (1995) Holtzman J.A., Burrows C.J., Casertano S., Hester J.J., Trauger J.T., Watson A.M., & Worthey G., 1995, PASP, 107, 1065
- Hopp et al. (1999) Hopp U., Schulte-Ladbeck R.E., Greggio L., Crone M.M., 1999, in ASP Conf.Series Proc., Vol. 192, 85
- Hopp et al. (2001) Hopp U., Schulte-Ladbeck R.E., Greggio L., Drozdovsky I.O., Crone M.M., 2001, Euro.-Conf. Granada 23-27.5.2000, ASpS, 277, 267-270
- Huchtmeier & Seiradakis (1985) Huchtmeier W.K., & Seiradakis J.H, 1985, A&A, 143, 216
- Huchtmeier et al. (1997) Huchtmeier, W.K., Hopp, U., & Kuhn, B. 1997, A&A, 319, 67
- Hunter & Gallagher (1986) Hunter D. A., Gallagher, J. S. 1986, PASP, 98, 5
- Kobulnicky & Skillman (1996) Kobulnicky H.A., & Skillman E.D., 1996, ApJ, 471, 211
- Karachentsev & Tikhonov (1994) Karachentsev I.D., & Tikhonov N.A., 1994, A&A, 286, 718
- Karachentsev & Drozdovsky (1998) Karachentsev I.D. & Drozdovsky I.O., 1998, A&AS, 131, 1
- Kennicutt (1998) Kennicut R.C.Jr., 1998, ARA&A, 36, 189
- Kunth & Schild (1986) Kunth D., & Schild H., A&A, 169, 71
- Landolt (1992) Landolt A.U., 1992, AJ, 104, 340
- Lee et al. (1993) Lee M.G., Freedman W.L., & Madore B.F., 1993, ApJ, 417, 553
- Leitherer et al. (1995) Leitherer C., Robert C., Heckman T.M., 1995, ApJS, 99, 173
- Leitherer et al. (1996) Leitherer C., Vacca W., Conti P.S. Filippenko A.V., Robert C., Sargent W.L.W., 1996, ApJ, 465, 717
- Maíz-Apellániz et al. (1998) Maíz-Apellániz J., Mas-Hesse J.M., Muñoz-Tuñón C., Vílchez J.M. & Castañeda H.O., 1998, A&A, 329, 409
- Maíz-Apellániz et al. (1999) Maíz-Apellániz J., Muñoz-Tuñón C., Tenorio-Tagle G., & Mas-Hesse J.M., 1999, A&A, 343, 64
- Maíz-Apellániz et al. (2002) Maíz-Apellániz J., Cieza L., & MacKenty J.W., 2002, AJ., in press (astro-ph/0111372)
- Makarova et al. (1997) Makarova L.N., Karachentsev I.D., Georgiev Ts.B., 1997, AstL, 23, 378
- Makarova et al. (1998) Makarova L., Karachentsev I., Takalo L.O., Heinaemaeki P. & Valtonen, M., 1998, A&AS, 128, 459
- MacKenty et al. (2000) MacKenty J.W., Maíz-Apellániz J., Pickens C.E., Norman C.A., & Walborn, 2000, AJ, 120, 3007
- Martin (1998) Martin C.L., 1998, ApJ, 506, 222
- Mas-Hesse & Kunth (1999) Mas-Hesse J.M., & Kunth D., 1999, A&A, 349, 765
- McIntyre (1997) McIntyre V.J., 1997, PASA, 14, 122
- McIntyre (1998) McIntyre V.J., 1998, PASA, 15, 157
- Pettini et al. (2001) Pettini, M., Shapley, A.E., Steidel C., Cuby, J.-G., Dickinson, M., Moorwod, A.F.M., Adelberger, K.L., Giavaliscoe, M., 2001, ApJ, 554,981
- Ratnatunga & Bahcall (1985) Ratnatunga K.U., & Bahcall J.N., 1985, ApJS, 59, 63
- Sakai et al. (1996) Sakai S., Madore B.F., & Freedman W.L., 1996, ApJ, 461, 713
- Sakai & Madore (1999) Sakai S., & Madore B.F., 1999, ApJ, 526, 599
- Sakai et al. (2000) Sakai S., Zaritsky D., & Kennicutt Jr., R.C. 2000, AJ, 119, 1197
- Sargent & Filippenko (1991) Sargent W.L.M., & Filippenko A.V., 1991, AJ, 102, 107
- Schlegel et al. (1998) Schlegel D.J, Finkbeiner D.P., Davis M., 1998, ApJ, 500, 525
- Schulte-Ladbeck et al. (1998) Schulte-Ladbeck R.E, Crone M.M., & Hopp U., 1998, ApJ, 493, L23, SCH98
- Schulte-Ladbeck et al. (1999) Schulte-Ladbeck R.E, Hopp U., Greggio L., & Crone M.M., 1999, AJ, 118, 2705, SHGC99
- Schulte-Ladbeck et al. (2000) Schulte-Ladbeck R.E, Hopp U., Greggio L., Crone M.M., 2000, AJ, 120, 1713
- Schulte-Ladbeck et al. (2001) Schulte-Ladbeck R.E, Hopp U., Greggio L., Crone M.M., & Drozdovsky I.O., 2001, AJ, 121, 3007
- Soifer et al. (1989) Soifer B.T., Boehmer L., Neugebauer G., & Sanders D.B., 1989, AJ, 98, 766
- Steidel et al. (1996a) Steidel, C.C., Giavalisco, M., Pettini, M., Dickinson, M., Adelberger, K.L. 1996a, ApJL, 462, 17
- Steidel et al. (1996b) Steidel, C.C., Giavalisco, M., Dickinson, M., Adelberger, K.L. 1996b AJ, 112, 352
- Stephens (2000) Stephens A.W., Frogel J.A., Ortolani S., Davies R., Jablonka P., Renzini A., & Rich R.M., 2000, AJ, 119, 419
- Stetson (1987) Stetson P.B., 1987, PASP, 99, 191
- Thronson et al. (1988) Thronson H.A., Jr., Hunter D.A., Telesco C.M., Greenhouse M., & Harper D.A., 1988, ApJ, 334, 605
- Tikhonov & Karachentsev (1998) Tikhonov N.A., & Karachentsev I.D., 1998, A&AS, 128, 325
- Tosi (2001) Tosi M., 2001, “Dwarf Galaxies and Their Environment”, eds. K.S. de Boer, R.-J. Dettmar, U. Klein, Shaker Verlag, 169
- de Vaucouleurs (1975) de Vaucouleurs, 1975, Stars Stellar Systems, IX, 557
- Walter et al. (2000) Walter F., Taylor C.L., Hüttemeister S., Scoville N., & McIntyre V., 2001, AJ, 121, 727
- White & Rees (1978) White S.D.M., & Rees M.J., 1978, MNRAS, 183, 341