e-mail: dmg@astrax.fis.ucm.es
Multiwavelength optical observations of chromospherically active binary systems
We present high resolution echelle spectra taken during four observing runs from 1999 to 2001 of the recently X-ray/EUV selected chromospherically active binary BK Psc (2RE J0039+103). Our observations confirm the single-lined spectroscopic binary (SB1) nature of this system and allow us to obtain, for the first time, the orbital solution of the system as in the case of a SB2 system. We have determined precise radial velocities of both components: for the primary by using the cross correlation technique, and for the secondary by using its chromospheric emission lines. We have obtained a circular orbit with an orbital period of 2.1663 days, very close to its photometric period of 2.24 days (indicating synchronous rotation). The spectral type (K5V) we determined for our spectra and the mass ratio (1.8) and minimum masses () resulting from the orbital solution are compatible with the observed K5V primary and an unseen M3V secondary. Using this spectral classification, the projected rotational velocity (, of 17.1 km s-1) obtained from the width of the cross-correlation function and the data provided by Hipparcos, we have derived other fundamental stellar parameters. The kinematics and the non- detection of the Li i line indicate that it is an old star. The analysis of the optical chromospheric activity indicators from the Ca ii H & K to Ca ii IRT lines, by using the spectral subtraction technique, indicates that both components of the binary system show high levels of chromospheric activity. H emission above the continuum from both components is a persistent feature of this system during the period 1999 to 2001 of our observations as well as in previous observations. The H and H emission seems to arise from prominence-like material, and the Ca ii IRT emission from plage-like regions.
Key Words.:
stars: individual: BK Psc – stars: activity – stars: binaries: spectroscopic – stars: chromospheres – stars: late-type – stars: rotation| 2.2 m-FOCES 1999/07 | INT-MUSICOS 2000/08 | NOT-SOFIN 2000/11 | 2.2 m-FOCES 2001/09 | |||||||||||||||
| Day | UT | Exp | S/N | Day | UT | Exp | S/N | Day | UT | Exp | S/N | Day | UT | Exp | S/N | |||
| (s) | H | (s) | H | (s) | H | (s) | H | |||||||||||
| 26 | 02:45 | 2400 | 87 | 11 | 04:19 | 4000 | 36 | 6 | 01:03 | 3600 | 84 | 24 | 01:17 | 1600 | 32 | |||
| 28 | 03:36 | 2000 | 68 | 12 | 04:14 | 4000 | 64 | 6 | 23:06 | 3600 | 79 | 24 | 22:45 | 1600 | 57 | |||
| 30 | 03:11 | 2000 | 75 | 13 | 04:39 | 4000 | 62 | 8 | 00:28 | 3600 | 88 | |||||||
| 14 | 04:36 | 3600 | 49 | 8 | 23:30 | 3600 | 96 | |||||||||||
1 Introduction
This paper is a part of our ongoing project on multiwavelength optical observations aimed at studying the chromosphere of active binary systems. For this purpose we use the information provided by several optical spectroscopic features that are formed at different heights in the chromosphere (see Montes et al. 1997, Paper I; Montes et al. 1998, Paper II; Montes et al. 2000, Paper III). In addition to study stellar activity, the high resolution spectroscopic observations we use in this project allow us to determine radial velocities and to obtain and improve fundamental stellar parameters.
In this paper we focus our attention on the X-ray/EUV selected chromospherically active binary BK Psc (2RE J003939+103925, BD+09 73, G 1-10, LHS 1118). It is a high proper-motion star with photometry reported by Stephenson (1986), Sandage & Kowal (1986) and Weis (1991) (=10.5; = 0.97; = 1.17; = 0.73; = 0.60). Bidelman (1985) gives a K5 spectral type for this star that was confirmed later by Jeffries et al. (1995), but Stephenson (1986) listed it as K4:p. Due to a blue excess in the () color index the presence of a white dwarf companion has been suggested by Weis (1991) and Cutispoto et al. (1999). Radial velocity variations indicate that it is a binary system (Jeffries et al. 1995; Cutispoto et al. 1999), but no orbital solution has been determined until now. BK Psc was detected as an extreme ultraviolet (EUV) source by the ROSAT Wide Field Camera all-sky survey (Pounds et al. 1993; Pye et al. 1995). The chromospheric activity of this star was detected in the optical identification program of ROSAT EUV Sources by Mason et al. (1995) ((H)=1.1 Å and (Caii K)=2.7 Å) and Jeffries et al. (1995) (strong H emission above the continuum, (H)=1.0 Å). Finally, Cutispoto et al. (1999) found that the best fit for their observed colors (=10.43; = 0.92; = 1.16; = 0.73; = 1.49) and Hipparcos distance ( pc) is obtained by assuming a K5V or K6V primary, a M4V secondary and a possible white dwarf (WD). These authors also confirm the optical variability of this star (photometric period days), previously reported in the SAAO Annual report (1993) ( days).
In this paper we present high resolution echelle spectra of BK Psc, obtained at different epochs, that allow us to measure radial and rotational velocities by using the cross-correlation technique. With these observations we confirm the binary nature (SB1) of this system and determine its orbital solution for the first time. We have obtained an orbital period of 2.17 days, very close to the photometric period of 2.24 days, indicating nearly synchronous rotation. Furthermore, we have applied the spectral subtraction technique to study the chromospheric excess emission in the Ca ii H & K, Ca ii IRT, H and other Balmer lines from the primary and secondary components of the system. Preliminary results for this system can be found in Gálvez et al. (2001) and Montes et al. (2001a).
In Sect. 2 we give the details of our observations and data reduction. In Sect. 3 the procedures to obtain the stellar parameters and the orbital determination of the binary system are described in more detail and the results are discussed. The individual behavior of the different chromospheric activity indicators is described in Sect. 4. Finally in Sect. 5 we give the conclusions.
| Tsp | SB | V | α cos | δ | ||||||
|---|---|---|---|---|---|---|---|---|---|---|
| (days) | (days) | (km s-1) | (mas) | (mas/yr) | (mas/yr) | |||||
| K5/6:V/M4:V + WD | 1 | 10.43 | 1.16 | 0.73 | 2.1663 | 2.24 | 17.1 | 30.521.79 | 524.92.1 | -198.02.1 |
1 values determined in this paper
2 Observations and data reduction
The spectroscopic observations of BK Psc were obtained during four observing runs:
1) 2.2 m-FOCES 1999/07
This run took place on 24-29 July 1999 using the 2.2 m
telescope at the German Spanish Astronomical
Observatory (CAHA) (Almería, Spain).
The Fibre Optics Cassegrain Echelle Spectrograph (FOCES)
(Pfeiffer et al. 1998)
was used with a 2048x2048 (15) LORAL11i CCD detector.
The wavelength range covers from
3910 to 9075 Å in 84 orders.
The reciprocal dispersion ranges from 0.03 to 0.07 Å/pixel
and the spectral resolution,
determined as the full width at half maximum (FWHM)
of the arc comparison lines, ranges from 0.09 to 0.26 Å.
2) INT-MUSICOS 2000/08
This run was done on 11-14 August 2000, with the 2.5 m
Isaac Newton telescope (INT) at the
Observatorio del Roque de Los Muchachos (La Palma, Spain) using the
ESA MUSICOS Spectrograph. This is a fibre-fed cross-dispersed echelle
spectrograph (Baudrand & Bohm 1992) and developed as a part of
MUlti-SIte COntinuous Spectroscopy (MUSICOS) project.
During this observing run, a 2148x4148 pixel EEV10a (EEV4280)
CCD detector was used.
The wavelength range covers from 4000 to 10000 Å in 87 orders. The
reciprocal dispersion ranges from 0.03 to 0.08 Å/pixel
and the spectral resolution (FWHM) from 0.06 to 0.24 Å.
3) NOT-SOFIN 2000/11
This run took place on 6-9 November 2000 using the 2.56 m
Nordic Optical Telescope (NOT).
The Soviet Finnish High Resolution Echelle Spectrograph (SOFIN) was
used with an echelle grating (79 grooves/mm), camera ASTROMED-3200 and a
1152x298 pixel EEV P88100 CCD detector. The wavelength range covers from
3900 to 8400 Å in 37 orders.
The reciprocal dispersion ranges from 0.06 to 0.14 Å/pixel
and the spectral resolution (FWHM) from 0.15 to 0.42 Å.
4) 2.2 m-FOCES 2001/09
The last run took place on 21-24 September 2001 using the 2.2 m telescope
at the German Spanish Astronomical
Observatory (CAHA) (Almería, Spain).
In this run, the FOCES spectrograph (Pfeiffer et al. 1998)
was used with a 2048x2048 (24) SITE1d CCD detector.
The wavelength range covers from
3450 to 10700 Å in 112 orders.
The reciprocal dispersion ranges from 0.04 to 0.13 Å/pixel
and the spectral resolution (FWHM) ranges from 0.1 to 0.34 Å.
In Table 1 we give the observing log. For each observation we list date (Day), universal time (UT), exposure time (Exp), and the signal to noise ratio (S/N) measured in the H line region.
The spectra have been extracted using the standard reduction procedures in the IRAF111IRAF is distributed by the National Optical Observatory, which is operated by the Association of Universities for Research in Astronomy, Inc., under contract with the National Science Foundation. package. The wavelength calibration was obtained by taking spectra of a Th-Ar lamp. Finally, the spectra have been normalized by a polynomial fit to the observed continuum.
3 Stellar parameters of the binary system
The adopted stellar parameters of BK Psc are given in Table 2. Spectral type and the photometric data (, , , ) are taken from Cutispoto et al. (1999). Orbital period () and projected rotational velocity () have been determined in this paper (see below). The astrometric data (parallax, , proper motions, α and δ) are from Hipparcos (ESA 1997) and Tycho-2 (Hg et al. 2000) catalogues.
3.1 Spectral types
In order to obtain the spectral type of this binary sytem we have compared our high resolution echelle spectra, in several spectral orders free of lines sensitive to chromospheric activity, with spectra of inactive reference stars of different spectral types and luminosity classes observed during the same observing run. This analysis made use of the program starmod developed at Penn State University (Barden 1985) and modified later by us. With this program a synthesized stellar spectrum is constructed from artificially rotationally broadened, radial-velocity shifted, and weighted spectra of appropiate reference stars. We have obtained the best fit between observed and synthetic spectra when we use a K5V primary component without any contribution from a secondary component. As reference stars we have used the K5V stars HD 154363 for the first run, 61 Cyg A for for the other three runs. This spectral classification is in agreement with K5 spectral type reported by Bidelman (1985) and Jeffries et al. (1995), and the K5/6:V + M4:V classification given by Cutispoto et al. (1999), where the M4V secondary has no apreciable contribution to the spectra.

3.2 Rotational velocity
The projected rotational velocity () of this star has been previously estimated as km s-1 (Jeffries et al. 1995) and 182 km s-1 by Cutisposto et al. (1999).
By using the program starmod we have obtained the best fits for each observing run, with values around 15-18 km s-1. In order to determine a more accurate rotational velocity of BK Psc we have made use of the cross-correlation technique in our high resolution echelle spectra by using the routine fxcor in IRAF. When a stellar spectrum with rotationally broadened lines is cross-correlated against a narrow-lined spectrum, the width of the cross-correlation function (CCF) is sensitive to the amount of rotational broadening of the first spectrum. Thus, by measuring this width, one can obtain a measurement of the rotational velocity of the star.
The observed spectra of BK Psc were cross-correlated against the spectrum of a template star (a slowly rotating star of similar spectral type) and the width (FWHM) of CCF determined. The calibration of this width to yield an estimation of is determined by cross-correlating artificially broadened spectra of the template star with the original template star spectrum. The broadened spectra were created for spanning the expected range of values by convolution with a theoretical rotational profile (Gray 1992) using the program starmod. The resultant relationship between and FWHM of the CCF was fitted with a fourth-order polynomial. We have tested this method with stars of known rotational velocity, obtaining a good agreement. The uncertainties on the values obtained by this method have been calculated using the parameter defined by Tonry & Davis (1979) as the ratio of the CCF height to the rms antisymmetric component. This parameter is computed by the task fxcor and provides a measure of the signal to noise ratio of the CCF. Tonry & Davis (1979) showed that errors in the FWHM of the CCF are proportional to and Hartmann et al. (1986) and Rhode et al. (2001) found that the quantity provide a good estimate for the 90 confidence level of a measurement. Thus, we have adopted as a reasonable estimate of the uncertainties on our measurements.
As template stars for BK Psc we have used the slowly rotating K5V stars above mentioned in the spectral type classification. We have determined by this method in all the spectra of BK Psc available and the resulting weighted means in each observing run are 16.22.1, 16.40.7, 19.50.8, and 15.01.0km s-1 respectively. The weighted mean for all the observing runs is 17.10.5 km s-1, which is the value given in Table 2.
| Obs. | HJD | Primary | Secondary | |
|---|---|---|---|---|
| Vhel | Vhel | |||
| (km s-1) | (km s-1) | |||
| 1992 (J95)1 | 48845.581 | 2.9 2.0 | - | |
| 1992 (J95)1 | 48851.540 | -56.9 2.0 | - | |
| 1995 (C99)2 | 49956.718 | -26.3 4.0 | - | |
| 1995 (C99)2 | 49958.774 | -40.6 4.0 | - | |
| 2.2 m 1999 | 51385.615 | -29.80 0.29 | 31.924.3 | |
| 2.2 m 1999 | 51387.650 | -9.67 0.46 | -9.674.5 | |
| 2.2 m 1999 | 51389.633 | 16.51 0.47 | -57.654.5 | |
| INT 2000 | 51767.692 | -29.98 0.13 | 36.794.1 | |
| INT 2000 | 51768.689 | 22.71 0.11 | -70.234.1 | |
| INT 2000 | 51769.706 | -52.42 0.13 | 55.934.4 | |
| INT 2000 | 51770.703 | 37.91 0.09 | -93.274.1 | |
| NOT 2000 | 51854.551 | -6.84 0.21 | -6.844.2 | |
| NOT 2000 | 51855.470 | 3.06 0.17 | -46.554.2 | |
| NOT 2000 | 51856.527 | -32.54 0.14 | 31.004.1 | |
| NOT 2000 | 51857.486 | 27.93 0.78 | -75.804.8 | |
| 2.2 m 2001 | 52176.554 | -56.65 0.23 | 71.824.2 | |
| 2.2 m 2001 | 52177.448 | 16.25 0.10 | -57.804.1 |
1 J95: Jeffries et al. (1995),
2 C99: Cutispoto et al. (1999).
3.3 Radial velocities and orbital parameters
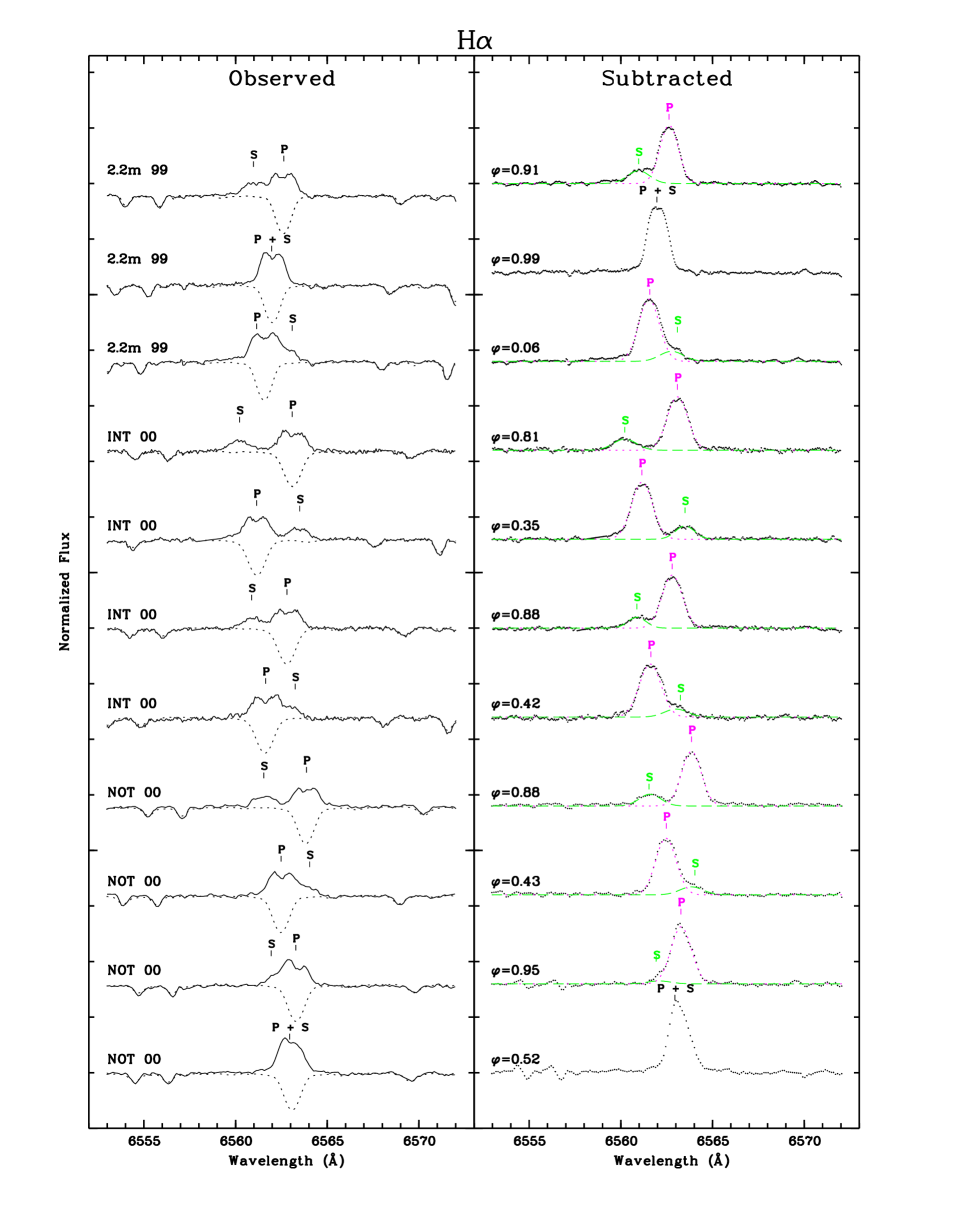
Recently, Jeffries et al. (1995) and Cutispoto et al. (1999) have noted that BK Psc is a single-lined spectroscopic binary (SB1), but they provided only four radial velocity measurements. The detailed analysis of our spectra and our radial velocities measurements. confirm the SB1 nature of this system. In our spectra only the photospheric absorption lines coming from the primary component are observed throughout all the spectral range. On the contrary, the chromospheric emission lines from both components are detected in our spectra (see Fig. 2), and thereby it has been possible to measure the radial velocity of the secondary and in this way to obtain the orbital solution of the system as in the case of a double-lined spectroscopic binary (SB2).
For the primary component of BK Psc the heliocentric radial velocities have been determined by using the cross-correlation technique. The spectra of BK Psc were cross-correlated order by order, by using the routine fxcor in IRAF, against spectra of radial velocity standards with similar spectral type taken from Beavers et al. (1979). The radial velocity was derived for each order from the position of the cross-correlation peak, and the uncertainties were calculated by fxcor based on the fitted peak height and the antisymmetric noise as described by Tonry & Davis (1979). In Table 3 we list, for each spectrum, the heliocentric radial velocities () and their associated errors () obtained as weighted means of the individual values deduced for each order. Those orders that contain chromospheric features and prominent telluric lines have been excluded when determining the mean velocity.
For the secondary component, we have used the information provided by the chromospheric emissions that are detected for both components in the H, Ca ii H & K and other Balmer lines. The contribution of each component to the observed profile has been deblended by mean of a two Gaussian fit (see Fig. 2) and the relative wavelength separation of the secondary component with respect to the primary has been used to determine its heliocentric radial velocity (listed in Table 3).
We have computed the orbital solution of BK Psc using our eleven data of radial velocities (for both component) and the four values given (only for the primary) by Jeffries et al. (1995) and Cutispoto et al. (1999) (see Table 3). The radial velocity data (Table 3) are plotted in Fig. 1. Solid circles represent the primary and open circles represent the secondary. The curves represent a minimum fit orbit solution. The orbit fitting code uses the Numerical Recipes implementation of the Levenberg-Marquardt method of fitting a non-linear function to the data and weights each datum according to its associated uncertainty (Press et al. 1986). The program simultaneously solves for the orbital period, , the epoch of periastron passage, , the longitude of periastron, , the eccentricity, , the primary star’s radial velocity amplitude, , the heliocentric center of mass velocity, , and the mass ratio, . The secondary star’s radial velocity amplitude, , is . The orbital solution and relevant derived quantities are given in Table 4. In this Table we give as the heliocentric Julian date on conjunction with the hotter star behind, in order to adopt the same criteria used by Strassmeier et al. (1993) in their catalog of chromospherically active binary stars. We have used this criterion to calculate the orbital phases of all the observations reported in this paper.
| Element | Value | Uncertainty | Units |
|---|---|---|---|
| 2.1663 | 0.0015 | days | |
| 2451383.32 | 0.20 | HJD | |
| 84.88 | 0.61 | degrees | |
| 0.0025 | 0.0074 | ||
| 52.70 | 0.73 | km s-1 | |
| 95.09 | 2.66 | km s-1 | |
| -10.95 | 0.32 | km s-1 | |
| 1.80 | 0.04 | ||
| sin | 1.57 | 0.02 | 106 km |
| sin | 2.83 | 0.08 | 106 km |
| sin | 4.40 | 0.08 | 106 km |
| ” | 0.0294 | AU | |
| ” | 6.33 | R⊙ | |
| sin | 0.466 | 0.027 | |
| sin | 0.258 | 0.015 | |
| 0.0328 | 0.0013 | ||
| 0.1917 | 0.0025 |
This binary system results in a circular orbit ( = 0.0025) with an orbital period of 2.1663 days, which is very similar to its rotational period derived from the photometry ( = 2.24 days) indicating nearly synchronous rotation.
3.4 Other derived quantities
For the K5V spectral type of the observed primary component we can adopt from Landolt-Börnstein tables (Schmidt-Kaler 1982) a primary mass = 0.67 . According to the mass ratio ( = 1.80) from the orbital solution we estimate for the secondary a mass = 0.37 which corresponds (Schmidt-Kaler 1982) to a M3V star. With these spectral types the difference in bolometric magnitudes between both components is 2.5 and the difference in visual magnitudes is 3.9 which is in agreement with an unseen secondary component and the spectral classification reported by Cutispoto et al. (1999).
We have estimated the radius of the primary component by using the parallax (30.52 mas) given by Hipparcos (ESA 1997) and the unspotted magnitude, taken as the brightest magnitude (10.43) of the values given by Cutispoto et al. (1999). This magnitude is very close to the value given by Hipparcos ( that corresponds to ). As the system is relatively close, to calculate the absolute magnitude , no interstellar reddening was assumed. The bolometric correction () corresponding to the K5V primary from (Schmidt-Kaler 1982) has been used to compute the bolometric magnitude, and luminosity, . Assuming that the contribution of the secondary to this total luminosity is very small, we have used this and the effective temperature ( K) corresponding to a K5V to determine a radius (we called ) for the primary . The errors in these derived quantities are dominated by the error in the parallax ( mas) given by Hipparcos and in the ( K). This radius can be compared with an independent determination of the minimum radius (). Taking as rotational period the photometric period (2.24 days) given by Cutispoto et al. (1999) and the rotational velocity determined by us we found . The error in this case is dominated by the uncertainty in . This value of should be smaller than , but we have found a value slightly larger. Within the errors, however, the agreement between both radii is acceptable. In addition, the radius for a K5V in Schmidt-Kaler (1982), , is halfway between and . This low value of also suggests that the magnitude we have used can be effected by cool spots on the stellar surface. Using the measured minimum radius and the effective temperature ( K) corresponding to a K5V we obtain a low limit of the of the stellar luminosity () and brightness (). Using this luminosity and the the mass-luminosity relation for main sequence stars we obtain an estimate of the mass of the primary (0.594 ) that is compatible with the mass of a K5V-K7V. With this mass and the minimum mass obtained from the orbital solution the mass for the secondary is = 0.33 which correspond to a M3V star, similar to the result obtained with the first method described above.
We can summarize the adopted and derived quantities of the primary and secondary components of BK Psc as follows:
The inclination of the system is = 62.4o if we compare the minimum mass of the primary ( sin=0.466 ) deduced from the orbit with the mass adopted for a K5V. The minimum inclination angle for eclipses to occur () is given by . Using the radii adopted for the primary and secondary components and the semi-mayor axis of the orbit () lead to . Since the photometric observations show no evidence of eclipses, the inclination of BK Psc must be lower than 80.1o, which is in agreement with the previous estimation of .
3.5 Kinematics and age
BK Psc is a high proper-motion star included in the studies of Stephenson (1986), Sandage & Kowal (1986) and Weis (1991). It is a relatively nearby star (d = 32.8 pc) with astrometric data measured by Hipparcos (ESA 1997) and Tycho-2 (Hg et al. 2000) catalogues (see Table 2).
We have computed the galactic space-velocity components (, , ) using as radial velocity the center of mass velocity () (for details see Montes et al. 2001b). The resulting values and associated errors are given in Table 5.
| (km s-1) | (km s-1) | (km s-1) | (km s-1) |
| -55.23 3.38 | -63.27 3.35 | -25.66 2.04 | 87.82 |
The large total velocity and the , , velocity components that lie clearly outside the young disk population boundaries in the (, ) and (, ) diagrams (Eggen 1984, 1989; Montes et al. 2001b) indicate that BK Psc is an old disk star.
The spectral region of the resonance doublet of Li i at 6708 Å is included in all our spectra of BK Psc. The detailed analysis of the spectra indicates that this line is not detected in this star. As it is well known, this spectroscopic feature is an important diagnostic of age in late-type stars. In addition, it is also known that a large number of chromospherically active binaries shows Li i abundances higher than other stars of the same mass and evolutionary stage (see Paper II, III and references therein). Therefore, non- detection of the Li i line in this active star indicates that it is an old star which is in agreement with its kinematics.
4 Chromospheric activity indicators
The echelle spectra analysed in this work allow us to study the behaviour of the different indicators from the Ca ii H & K to the Ca ii IRT lines, which are formed at different atmospheric heights. The chromospheric contribution in these features has been determined by using the spectral subtraction technique described in detail by Montes et al. (1995a) and Paper I, II, and III. The synthesized spectrum was constructed using the program starmod. Taken into account the stellar parameters derived in Sect. 3 we have used only a K5V primary component without any contribution from a secondary component. The inactive K5V stars used as reference stars are HD 154363 for the first observing run, and 61 Cyg A for the other three runs.
In Table 6 we give the excess emission equivalent width () (measured in the subtracted spectra) for the Ca ii H & K, H, H, H, H, H, and Ca ii IRT (8498, 8542, 8662) lines. When the emission features from both components can be deblended, we give the for the hot and cool (H/C) components. The uncertainties in the measured were estimated taking into account: a) the typical internal precisions of starmod (0.5 - 2 km s-1 in velocity shifts, and 5 km s-1 in ), b) the rms obtained in the fit between observed and synthesized spectra in the spectral regions outside the chromospheric features (typically in the range 0.01-0.03) and c) the standard deviations resulting in the measurements. The final estimated errors are in the range 10-20%.
The measured s given in Table 6 have been corrected for the relative contribution of each component to the total continuum determined by means of the radii and temperatures assumed in Sect. 3. For instance, in the H line region the relative contributions are for the hot component and for the cool component, and the corrected s for the hot and cool components are obtained multiplying by a factor and , respectively. Finally, these corrected s have been converted to absolute surface fluxes by using the empirical stellar flux scales calibrated by Hall (1996) as a function of the star colour index. In our case, we have used the index and the corresponding coefficients for Ca ii H & K, H and Ca ii IRT, using the same as Ca ii H & K for H, and derived the H, H and H fluxes by making an interpolation between the values of Ca ii H & K and H. The logarithm of the obtained absolute flux at the stellar surface (logFS) for the different chromospheric activity indicators is given in Table 7.
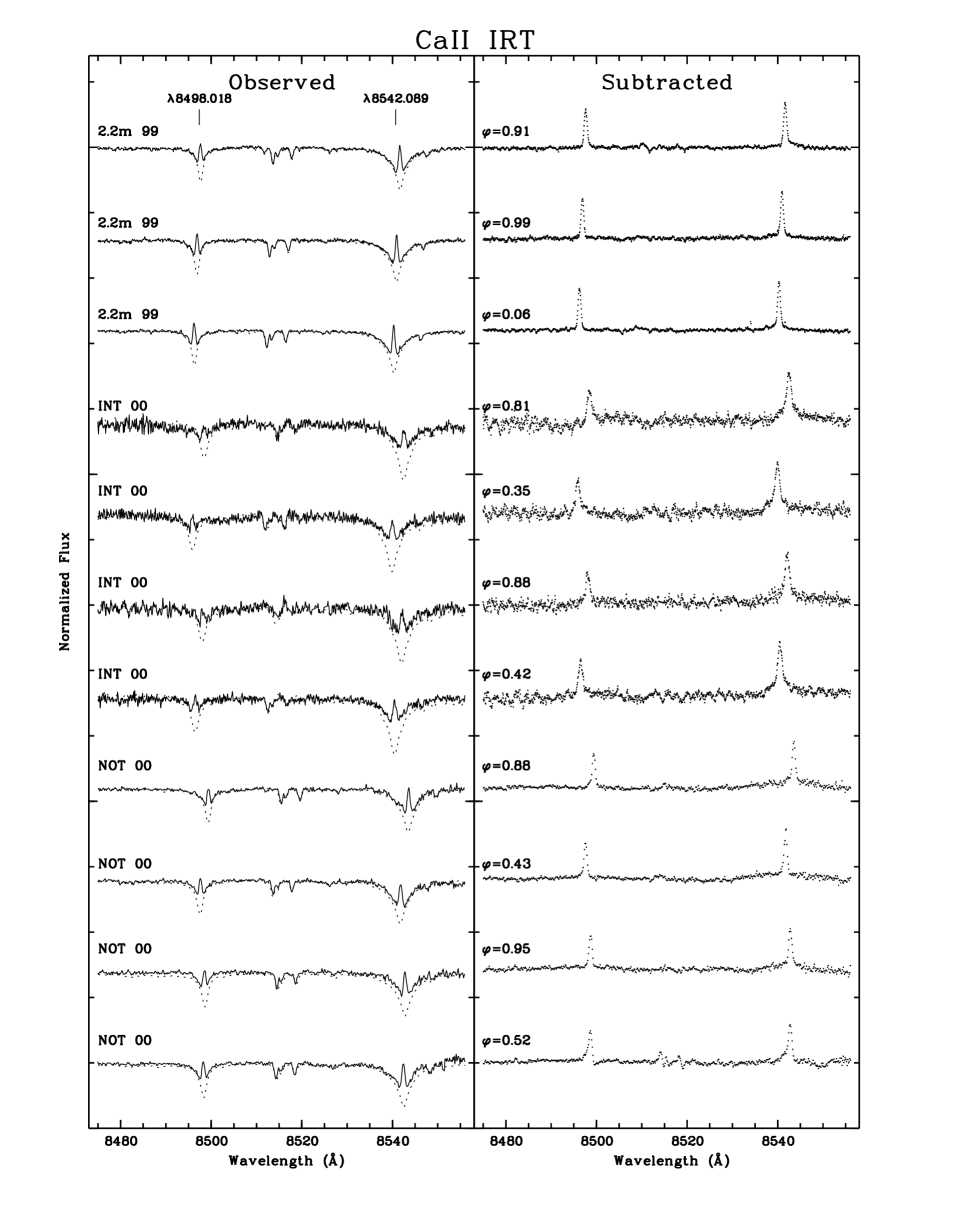
In Figs. 2 and 5 we have plotted for each observation in the H and Ca ii IRT , line region the observed spectrum (solid-line) and the synthesized spectrum (dashed-line) in the left panel, and the subtracted spectrum (dotted line), in the right panel. The observing run and the orbital phase () of each spectrum are also given in these figures. The observed spectra in the Ca ii H & K line region are plotted in Fig.4, and representative subtracted spectra in the H, H and H line regions are plotted in Fig. 3.
4.1 The H line
The H line region is included in our spectra in the four observing runs. In all cases we have detected, in the observed spectra (see Fig. 2 left panel), strong H emission above the continuum coming from the primary component and a small H emission coming from the secondary component. In all the spectra, except two which are very close to conjunction, we were able to deblend the emission coming from both components by using a two-Gaussian fit to the subtracted spectra (see Fig. 2 right panel).
The H emission of the primary exhibits a central self-absorption similar to that observed in many M active stars (Stauffer & Hartmann 1986) and some K active stars like the dK5e binary V833 Tau (Montes et. al. 1995b) and the K4V single star V834 Tau (Montes et. al. 2001c). This self-absorption feature is a consequence of the line formation process in the chromosphere of very active stars (Houdebine & Doyle 1994).
The H emission of BK Psc is persistent during the period of time covered by our observations (from 1999 to 2001). In addition, strong H emission above the continuum from the primary component was also detected in previous spectra of this system taken in 1992 with (H) = 1.0 Å (Jeffries et al. 1995) and (H)=1.1 Å (Mason et al. 1995). These s are lower than the s determined by us because these authors determined the s in the observed spectra and our s have been measured in the subtracted spectra, after eliminating the photospheric contribution. This persistent H emission detected in BK Psc indicates that it is a very chromospherically active binary system similar to some RS CVn systems like V711 Tau, UX Ari, HU Vir, and DM UMa, and some BY Dra systems like BY Dra itself, and YY Gem, which always show H emission above the continuum.
The detection of H emission from the cool secondary component (M3V) of BK Psc indicates that this star has a very strong H emission, since its photospheric contribution to the observed continuum is practically negligible. Strong H emission is typical of the group of M type stars called dMe stars, some of which also show a scaled-up version of solar flares and are known as flare stars of UV Cet type stars. These latter stars are characterized by dramatic increases in the Hydrogen Balmer emission lines. However, this seems not to be the case for the secondary component of BK Psc since the H emission we have detected has a similar intensity in the four observing runs.
The H emission of the primary component shows small variations with the orbital phase, for instance, in the first run the changes from 1.7 to 1.1 Å. Seasonal variations are also detected, with larger (H) in 1999 than in 2001.
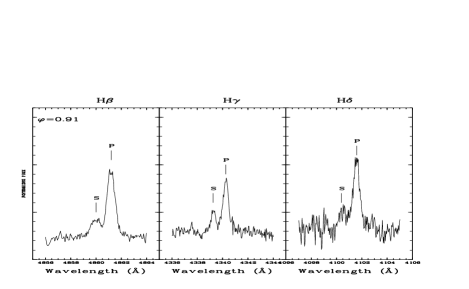
4.2 The H, H and H lines
The other three Balmer lines included in all our spectra (H, H and H) also show evidence of chromospheric activity. After applying the spectral subtraction, clear excess emission from both components is detected (see Fig. 3). When the S/N is high enough we have deblended the emission coming from both components by using a two-Gaussian fit to the subtracted spectra (see Table 6). The three lines show small seasonal and orbital phase variations with the same trend that the H line.
We have also measured the ratio of excess emission in the H and H lines, , and the ratio of excess emission with the correction:
given by Hall & Ramsey (1992) that takes into account the absolute flux density in these lines and the color difference in the components. We have obtained for the primary component in the range of 3 to 4 in all our spectra. These values indicate, according to Buzasi (1989) and Hall & Ramsey (1992), the presence of prominence-like material at the stellar surface.
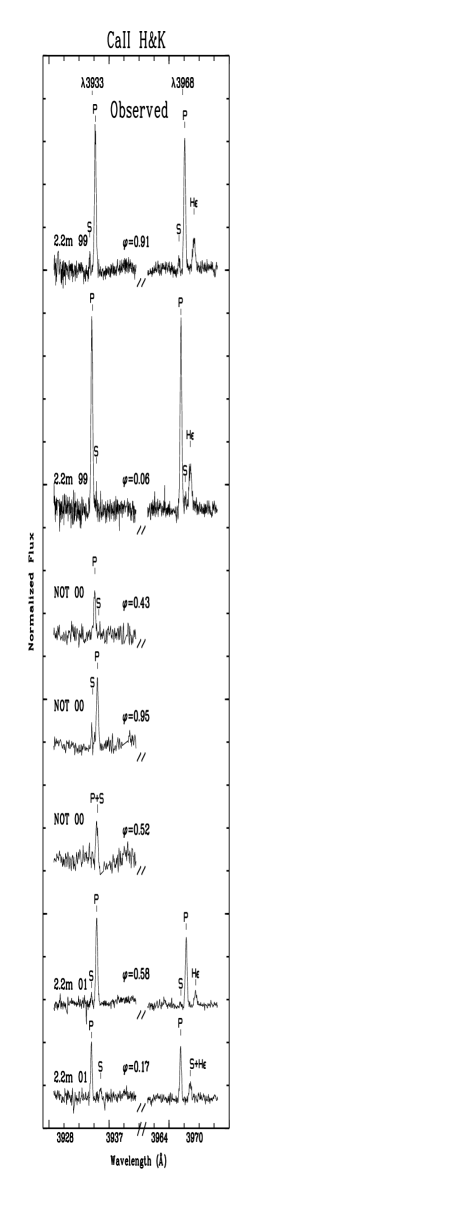
4.3 The Ca ii H & K and H lines
The Ca ii H & K line region is included in the spectra of the FOCES 1999 and 2001 observing runs. Only the Ca ii K line is included in the NOT 2000 run, and this spectral region is not covered in the MUSICOS 2000 run. In all the spectra strong emission in the Ca ii H & K lines and a clear emission in the H line coming from the primary component is observed (see Fig. 4). The Ca ii H & K emission lines from the secondary component are also detected with relative wavelength shifts with respect to the primary in agreement with the wavelength shifts calculated in the H and the other Balmer lines.
In our spectra the Ca ii H & K line spectral region is located at the end of the echellogram, where the efficiency of the spectrograph and the CCD decrease very rapidly, and therefore the S/N ratio obtained is very low, and the normalization of the spectra is very difficult. For these reasons we have not applied the spectral subtraction in this spectral region, and we have plotted in Fig. 4 only the observed spectra. The s measured in these spectra are in agreement with the strong Ca ii K emission (EW= 2.7 Å) reported by Mason et al. (1995).
Variations of the Ca ii H & K emissions with the orbital phase and from one epoch to another are observed for the primary component, and as in the case of the H line the level of chromospheric activity is higher in the first observing run than in the last one.
4.4 The Ca ii IRT lines (8498, 8542, 8662)
The three lines of the Ca ii infrared triplet (IRT) are included in our echelle spectra, except 8662 which is not included in the NOT 2000 observing run. In all the observed spectra of BK Psc a clear emission reversal is observed in the core of the Ca ii IRT absorption lines (see Fig. 5 left panel). After applying the spectral subtraction technique, only the excess emission arising from the primary component is detected (see Fig. 5 right panel). Unlike the other chromospheric activity indicators, no evidence of excess emission is detected from the cooler secondary component, even when in this red spectral region its relative contribution is slightly larger than in the blue one. In addition, the orbital phase and seasonal variations detected in the Ca ii IRT excess emission are more smooth than in the other activity indicators.
We have calculated the ratio of excess emission , , which is also an indicator of the type of chromospheric structure that produces the observed emission. In solar plages, values of 1.5-3 are measured, while in solar prominences the values are 9, the limit of an optically thin emitting plasma (Chester 1991). The small values of the ratio we have found for the primary component in all our spectra (ranging from 1.3 to 2.4) indicate that the Ca ii IRT emission of this star arises from plage-like regions, in contrast to the Balmer lines that seem to come from prominences. This markedly different behaviour of the Ca ii IRT emission has also been found in other chromospherically active binaries (see Paper III and references therein).
5 Conclusions
In this paper a detailed spectroscopic analysis of the recently, X-ray/EUV selected chromospherically active binary BK Psc is presented. We have analysed high resolution echelle spectra taken during four observing runs from 1999 to 2001. These spectra include all the optical chromospheric activity indicators from the Ca ii H & K to Ca ii IRT lines, as well as the Li i 6707.8 line and other photospheric lines of interest.
The precise radial velocities of the primary component of BK Psc that we have determined, by using the cross-correlation technique, allow us to confirm that it is a single-lined spectroscopic binary (SB1). In addition, as the chromospheric emission lines from the secondary component are also detected in our spectra it has been possible to measure the radial velocities of the secondary. We have used all these radial velocities to obtain, for the first time, the orbital solution of the system, as in the case of a SB2 system. We have obtained a circular orbit with an orbital period of 2.1663 days, very close to its photometric period of 2.24 days (indicating synchronous rotation). By comparison with the spectra of reference stars of different spectral types we have found that the spectra of BK Psc is well fitted with a K5V primary component without any contribution of a secondary component. The minimum masses () resulting from the orbital solution are compatible with the observed K5V primary and an unseen M3V secondary. As both components are main sequence stars, we can classify this chromospherically active binary as a BY Dra system (Fekel et al. 1986).
By using the information provided by the width of the cross-correlation function we have determined a projected rotational velocity, , of 17.1 km s-1 for the primary component. Within the errors, the radius for a K5V () is compatible with the radius obtained from the Hipparcos data () and the minimum radius () obtained from and the photometric period.
The kinematics (, , space-velocity components) and the non- detection of the Li i line in this active star indicate that it is an old star.
Finally, we have analysed, using the spectral subtraction technique, all the optical chromospheric activity indicators from the Ca ii H & K to Ca ii IRT lines. Both components of the binary system show high levels of chromospheric activity. In the observed spectra we have detected strong emission in the H, Ca ii H & K, H, and Ca ii IRT lines coming from the primary component, and low emission in the H and Ca ii H & K lines from the secondary. After applying the spectral subtraction the chromospheric excess emission from both components are clearly detected in all the activity indicators except the Ca ii IRT lines. We have used a two-Gaussian fit to deblend the emission coming from both components. The H emission above the continuum from both components seems to be a persistent feature of this system during the period 1999 to 2001 of our observations as well as in previous observations reported by other authors. In addition, the H emission of the primary exhibits a central self-absorption. The ratio that we have found indicates that the emission of these lines could arise from prominence-like material, whereas the ratio indicates that the Ca ii IRT emission arises from plage-like regions. The excess emission of the Balmer lines and the Ca ii H & K lines correlate well with each other, but the Ca ii IRT lines show a different behaviour.
| (Å) in the subtracted spectrum | |||||||||||
| Obs. | ⋆ | CaII | CaII IRT | ||||||||
| K3 | H3 | H3 | H | H | H | H | 8498 | 8542 | 8662 | ||
| 2.2 m 99 | 0.06 | 6.14/0.43 | 7.03/0.68 | 1.73 | 0.52 | 0.58 | 0.731 | 1.70/0.14 | 0.55 | 0.70 | 0.63 |
| 2.2 m 99 | 0.99 | * | * | * | 0.29 | 0.49 | 0.661 | 1.661 | 0.49 | 0.65 | 0.61 |
| 2.2 m 99 | 0.91 | 4.54/0.38 | 3.78/0.26 | 1.31 | 0.52/0.17 | 0.31/0.10 | 0.64/0.17 | 1.32/0.35 | 0.49 | 0.69 | 0.83 |
| INT 00 | 0.42 | - | - | - | * | 0.17+ | 0.581 | 1.51/0.12 | 0.67 | 1.62 | 1.30 |
| INT 00 | 0.88 | - | - | - | * | 0.27 | 0.50/0.05 | 1.32/0.24 | 0.59 | 1.36 | 1.09 |
| INT 00 | 0.35 | - | - | - | * | 0.28 | 0.51/0.01 | 1.48/0.31 | 0.69 | 1.24 | 1.35 |
| INT 00 | 0.81 | - | - | - | * | * | 0.54/0.08 | 1.37/0.32 | 0.64 | 1.36 | 1.42 |
| NOT 00 | 0.52 | 2.04 | - | - | * | 0.098+ | 0.731 | 1.791 | 0.55 | 0.76 | - |
| NOT 00 | 0.95 | 3.56/0.38 | - | - | * | * | 0.602 | 1.46/0.05 | 0.59 | 0.90 | - |
| NOT 00 | 0.43 | 2.15 | - | - | * | * | 0.572 | 1.49/0.16 | 0.59 | 0.75 | - |
| NOT 00 | 0.88 | * | - | - | * | 0.246+ | 0.55/1.13 | 1.32/0.31 | 0.53 | 0.89 | - |
| 2.2 m 01 | 0.17 | 1.88/0.37 | 2.31/4 | 1.014 | 0.50/0.35 | 0.50/0.13 | 0.45/0.04 | 1.18/0.32 | 0.51 | 0.65 | 0.48 |
| 2.2 m 01 | 0.58 | 3.57/0.31+ | 3.17/0.14+ | 0.91 | 0.27/0.03 | 0.36/0.12 | 0.52/0.11 | 1.09/0.37 | 0.46 | 0.64 | 0.51 |
⋆ Orbital phase calculated with the orbital period,
Porb and date of conjunction, Tconj determined
in this paper.
Data not measured due the very low S/N.
+ Data measured with low S/N.
1 Data for the primary and secondary components not deblended due
to the orbital phase of the observation.
2 For these lines we can observe the two components but they could not be
deblended.
3 These values have been measured at the observed spectra.
4 The H line of the primary component is blended with
the Ca ii H line of the secondary.
| logFS in the subtracted spectrum | |||||||||||
| Obs. | ⋆ | CaII | CaII IRT | ||||||||
| K3 | H3 | H3 | H | H | H | H | 8498 | 8542 | 8662 | ||
| 2.2 m 99 | 0.06 | 6.75/5.48 | 6.81/5.69 | 6.20 | 5.70 | 5.68 | 5.701 | 6.55/6.14 | 6.16 | 6.26 | 6.22 |
| 2.2 m 99 | 0.99 | * | * | * | 5.44 | 5.71 | 5.931 | 6.541 | 6.11 | 6.23 | 6.20 |
| 2.2 m 99 | 0.91 | 6.60/5.42 | 6.52/5.26 | 6.06 | 5.70/5.09 | 5.51/4,91 | 5.91/5.24 | 6.44/6.53 | 6.11 | 6.26 | 6.39 |
| INT 00 | 0.42 | - | - | - | * | 5.25+ | 5.871 | 6.50/6.07 | 6.24 | 6.63 | 6.53 |
| INT 00 | 0.88 | - | - | - | * | 5.45 | 5.80/4.69 | 6.44/6.37 | 6.19 | 6.55 | 6.45 |
| INT 00 | 0.35 | - | - | - | * | 5.47 | 5.81/3.86 | 6.50/6.48 | 6.26 | 6.51 | 6.55 |
| INT 00 | 0.81 | - | - | - | * | * | 5.84/4.91 | 6.46/6.50 | 6.22 | 6.55 | 6.57 |
| NOT 00 | 0.52 | 6.26 | - | - | * | 5.01+ | 5.971 | 6.551 | 6.16 | 6.30 | - |
| NOT 00 | 0.95 | 6.50/5.42 | - | - | * | * | 5.882 | 6.48/5.71 | 6.19 | 6.37 | - |
| NOT 00 | 0.43 | 6.28 | - | - | * | * | 5.862 | 6.49/6.20 | 6.19 | 6.29 | - |
| NOT 00 | 0.88 | * | - | - | * | 5.41+ | 5.85/6.07 | 6.44/6.48 | 6.14 | 6.37 | - |
| 2.2 m 01 | 0.17 | 6.22/5.41 | 6.31/4 | 5.954 | 5.68/5.41 | 5.72/5.02 | 5.76/4.62 | 6.39/6.50 | 6.13 | 6.23 | 6.10 |
| 2.2 m 01 | 0.58 | 6.50/5.34+ | 6.44/4.99+ | 5.91 | 5.41/4.34 | 5.58/4.98 | 5.82/5.05 | 6.39/6.56 | 6.08 | 6.22 | 6.13 |
Notes as in Table 6.
Acknowledgements.
We would like to thank Dr. B.H. Foing for allow us to use the ESA-MUSICOS spectrograph at Isaac Newton Telescope. We would also like to thank the referee S.V. Berdyugina for suggesting several improvements and clarifications. This work has been supported by the Universidad Complutense de Madrid and the Spanish MCYT, Ministerio de Ciencia y Tecnología, Programa Nacional de Astronomía y Astrofísica, under grant AYA2001-1448.References
- (1) Barden, S. C. 1985, ApJ, 295, 162
- (2) Baudrand, J., & Bohm, T., 1992, A&A, 259, 711
- (3) Beavers, W. I., Eitter, J. J., Ketelsen, D. A., & Oesper, D. A. 1979, PASP, 91, 698
- (4) Bidelman, W. P. 1985, ApJS, 59, 197
- (5) Buzasi, D. L. 1989, PhD Thesis, Pennsylvania State Univ.
- (6) Chester, M. M. 1991, PhD Thesis, Pennsylvania State Univ.
- (7) Cutispoto, G., Pastori, L., Tagliaferri, G., Messina, S., & Pallavicini R. 1999, A&AS, 138, 87
- (8) Eggen, O. J. 1984, ApJS, 55, 597
- (9) Eggen, O. J. 1989, PASP, 101, 366
- (10) ESA, 1997, The Hipparcos and Tycho Catalogues, ESA SP-1200
- (11) Gálvez, M. C., Montes, D., & López-Santiago, J. 2001, ”Highlights of Spanish Astrophysics II”, p. 373, Kluwer Academic Pub. (Netherlands), Proceedings of the IV Scientific Meeting of the Spanish Astronomical Society (SEA) J. Zamorano, J. Gorgas, J. Gallego (eds.)
- (12) Fekel, F. C., Moffett, T. J., & Henry, G. W. 1986, ApJS, 60, 551
- (13) Hall, J. C., & Ramsey, L. W. 1992, AJ, 104, 1942
- (14) Hall, J. C. 1996, PASP, 108, 313
- (15) Hartmann, L., Hewett, R., Stahler, S., & Mathieu, R. D. 1986, APJ, 309, 275
- (16) Hg, E., Fabricius, C., Makarov, V. V., et al. 2000, A&A, 355, L27
- (17) Houdebine, E. R. & Doyle, J. G. 1994, A&A, 289, 169
- (18) Jeffries, R. D., Bertram, D., & Spurgeon, B. R. 1995, MNRAS, 276, 397
- (19) Mason, K. O., Hassall, B. J. M., Bromage, G. E., et al. 1995, MNRAS, 274, 1194
- (20) Montes, D., Fernández-Figueroa, M. J., De Castro, E., & Cornide, M. 1995a, A&A, 294, 165
- (21) Montes, D., Fernández-Figueroa, M. J., De Castro, E., & Cornide, M. 1995b, A&AS, 109, 135
- (22) Montes, D., Fernández-Figueroa, M. J., De Castro, E., & Sanz-Forcada, J. 1997, A&AS, 125, 263 (Paper I)
- (23) Montes, D., Sanz-Forcada, J., Fernández-Figueroa, M. J., De Castro, E., & Poncet, A. 1998, A&A, 330, 155 (Paper II)
- (24) Montes, D., Fernández-Figueroa, M. J., De Castro, E., Cornide, M., Latorre, A., & Sanz-Forcada J. 2000, A&AS, 146, 103 (Paper III)
- (25) Montes, D., Gálvez, M. C., Fernández-Figueroa, López-Santiago, J., M. J., De Castro, E., & Cornide, M. 2001a, Astronomische Gesellschaft Abstract Series, Vol. 18, p. 87, in: JENAM 2001, 10th Meeting of the European Astronomical Society
- (26) Montes, D., López-Santiago, J., Gálvez, M. C., Fernández-Figueroa, M. J., De Castro, E., & Cornide, M. 2001b, MNRAS, 328, 45
- (27) Montes, D., López-Santiago, J., Fernández-Figueroa, M. J., & Gálvez, M. C. 2001c, A&A 379, 976
- (28) Pfeiffer, M. J., Frank, C., Baumueller, D., et al. 1998, A&AS, 130, 381
- (29) Pounds, K. A., Allan, D. J., Barber, C., et al. 1993, MNRAS, 260, 77
- (30) Press, W. H., Flannery, B. P., & Teukolsky, S. A. 1986, Numerical recipes. The art of scientific computing, Cambridge: University Press
- (31) Pye, J. P., McGale, P. A., Allan, D. J., et al. 1995, MNRAS, 274, 1165
- (32) Rhode, K. L., Herbst, W., & Mathieu, R. D. 2001, AJ, 122, 3258
- (33) SAAO Annual Report, 1991, p. 16
- (34) Sandage, A., & Kowal, C. 1986, AJ, 91, 1140
- (35) Schmidt-Kaler, T. 1982, in Landolt-Börnstein, Vol. 2b, ed K. Schaifers & H. H. Voig (Heidelberg: Springer)
- (36) Stauffer, J. R., & Hartmann, L. W. 1986, ApJS, 61, 531
- (37) Stephenson, C. B. 1986, AJ, 92, 139
- (38) Strassmeier, K. G., Hall, D. S., Fekel, F. C., & Scheck, M., 1993, A&AS 100, 17
- (39) Tonry, J., & Davis, M. 1979, AJ, 84 1511
- (40) Weis, E. W. 1991, AJ, 102, 1795