Do dusty A stars exhibit accretion signatures in their photospheres?
We determined abundances of O, Ca, Fe, Ba and Y for a sample of dusty and dust-free A stars, taken from the list of Cheng et al. (Cheng92 (1992)). Five of the stars have an infrared-excess due to circumstellar dust. Ongoing accretion from their circumstellar surroundings might have modified the abundances in the photospheres of these stars, but our results clearly show, that there is no difference in the photospheric composition of the dusty and dust-free stars. Instead all of them show the typical diffusion pattern which diminishes towards larger rotational velocities.
Key Words.:
Stars: atmospheres – Stars: abundances – Stars: early type – Stars: circumstellar matter1 Introduction
IRAS observations have shown that about 20% of all nearby A stars are surrounded by dust (Cheng et al. Cheng92 (1992)); the most prominent prototypes of these dusty A stars are Vega and Pictoris. In order to understand the nature of these dusty A stars, Holweger & Rentzsch-Holm (HRH95 (1995)) and Holweger et al. (HHK99 (1999), in the following HHK99) searched for gas in the circumstellar (CS) environment of a sample of dusty and dust-free A stars. They found narrow absorption features in the Ca ii K and the Na i D lines in about 30% of the stars. The occurrence of these features shows a strong correlation with the projected rotational velocity, which suggests the presence of gas concentrated in a disk-like structure, and therefore proves that these imprints on the photospheric spectrum originate in the circumstellar rather than in the interstellar medium (Holweger & Rentzsch-Holm HRH95 (1995)).
Since main-sequence A stars possess extremely shallow surface convection zones, their atmospheres are stable enough to allow diffusion processes to occur (Michaud Mich70 (1970)). This leads to a variety of peculiarities like the AmFm-phenomenon, which has been specifically investigated in open clusters with well-known ages (see e.g. Alecian Ale96 (1996), Hui-Bon-Hoa & Alecian Hui98 (1998) and references therein). Moreover, the shallow convection zones allow any contamination from circumstellar or interstellar matter to show up in the photospheres of these stars. The metal underabundances of a small subgroup of A stars, such as the Bootis stars, can be explained in terms of accretion of metal-deficient gas from their circumstellar environment (Venn & Lambert VL90 (1990)). In this subgroup of stars the dust phase is enriched in condensable elements whereas the gas phase is heavily metal-depleted, except for those elements which have a low condensation temperature, like C, N, O, and S. Conversely, in the framework of the ”planet migration“ model, the metal overabundances of solar-type stars with planets are attributed to the accretion of rocky planets onto the star (Smith et al. Smith (2001)). A recent study of non-interacting solar-type binary stars revealed the existence of pairs of stars, where one component was more metal-rich than the other (Gratton et al. Gratton (2001)). There is a trend towards increasing abundance difference with condensation temperature, pointing towards the accretion of dust-rich or rocky material onto the stellar surface from either the inner part of a protoplanetary disk or from rocky planets. Despite the wealth of literature dicussing the circumstellar disks and peculiar abundance patterns in main-sequence A stars, a definite connection between these phenomena has been discussed but never really proven.
| HR | Name | HD | V | Spectral Type | O | Na | Ca | Ba | CS? | dusty? | Remarks |
|---|---|---|---|---|---|---|---|---|---|---|---|
| 553 | Ari | 11636 | 2.64 | A5 V | + | - | + | + | - | - | |
| 804 | Cet | 16970 | 3.47 | A3 V | + | - | + | + | - | - | |
| 1483 | 29573 | 5.01 | A2 IV | + | - | + | + | - | + | ||
| 1666 | Eri | 33111 | 2.79 | A3 III | + | - | + | + | - | - | |
| 1989 | 131 Tau | 38545 | 5.72 | A3 Vn | + | + | + | - | + | - | Boo |
| 2491 | CMa | 48915 | -1.46 | A1 Vm | + | - | + | - | - | - | |
| 2763 | Gem | 56537 | 3.58 | A3 V | + | - | + | + | - | ||
| 3083 | 64491 | 6.23 | A3 IVp | + | - | + | - | - | binary (1) Boo | ||
| 3569 | UMa | 76644 | 3.14 | A7 IV | + | - | + | + | - | ||
| 4295 | UMa | 95418 | 2.37 | A1 V | + | - | + | + | - | + | |
| 4534 | Leo | 102647 | 2.14 | A3 V | + | + | + | + | - | + | |
| 4828 | Vir | 110411 | 4.88 | A0 V | + | - | - | - | - | + | Boo |
| 5351 | Boo | 125162 | 4.18 | A0p | - | - | + | + | - | + | Boo |
| 5531 | Lib | 130841 | 2.75 | A3 IV | + | - | + | + | - | - | binary (4) |
| 5793 | CrB | 139006 | 2.23 | A0 V+G5 V | + | + | + | + | + | binary (3) | |
| 5895 | 36 Ser | 141851 | 5.11 | A3 Vnp | - | - | + | - | - | Boo | |
| 6378 | Oph | 155125 | 2.43 | A2 V | + | - | + | - | - | - | binary (2) |
| 6556 | Oph | 159561 | 2.08 | A5 III | + | + | + | + | + | - | |
| 7001 | Lyr | 172167 | 0.03 | A0 Va | + | - | + | - | - | + | Boo |
| 8728 | PsA | 216956 | 1.16 | A3 V | - | - | + | - | - | + | |
| 8947 | 15 And | 221756 | 5.59 | A1 Vp | - | - | + | - | - | - | Boo |
1: Kamp et al. (2001); 2: Ten Brummelaar (2000); 3: SIMBAD; 4: BSC (Hoffleit & Warren 1991)
A study on the surface composition of Pictoris carried out by Holweger et al. (Holweger97 (1997)) showed that this example of a star with CS matter, has solar abundances ’within a factor two or less’ and therefore reveals no signs of accretion. On the other hand Vega, another example of a star with CS matter, is often called a ”mild” Bootis star (Venn & Lambert VL90 (1990); Lemke & Venn Lemke3 (1996)), because it shows moderate metal underabundances that can be explained by the accretion of gas depleted in condensable elements. In general this raises some questions when applied to normal A stars (i.e. stars without known peculiarities): Is the result obtained for Pic or Vega outstanding?: Can the presence of CS matter affect the abundances?: Is it possible to detect these signs of accretion?
These questions can be answered by an extended search for the differences between the abundance pattern of dusty and dust-free normal A stars. Therefore, we have carried out a detailed abundance analysis of oxygen, calcium, barium, yttrium, and iron in a sample of nearby dusty and dust-free normal A stars. These elements are selected as representatives of the light elements with low condensation temperatures (O), and the heavy elements with higher condensation temperatures (Ca, Ba, Y, and Fe). Ba and Ca are strongly affected by diffusion whereas Fe is not. We scrutinized our sample to detect systematic differences in surface composition between dusty and dust-free stars.
2 The stellar sample
We have compiled a sample of 21 northern sky object to compare the abundances of dusty and dust-free A stars. It contains 15 normal A stars taken from Cheng et al. (Cheng92 (1992)), who cross-correlated the catalogue of A stars within 25 pc (Woolley et al. W70 (1970)) with the IRAS Faint Source Survey. For comparsion, we have also observed 6 Bootis stars where we expect to see typical accretion patterns in the atmospheres. Some of the objects that are accessible from ESO/Chile have been observed before in Ca ii K (Lemke Lem89 (1989), Stürenburg S93 (1993), Holweger & Rentzsch-Holm HRH95 (1995), HHK99, but nothing is known about their surface composition except the Ca abundance. We have added one star from the literature to our sample, namely Pic. Further details on the program stars and the spectral regions observed are given in Table 1.
3 Observations
We obtained high-resolution spectra with the 1.52m telescope at the Observatoire de Haute-Provence equipped with the Aurélie spectrograph (Gillet et al. Gil94 (1994)) on 4 nights (2000 January 18 – January 22). In the first two nights, we observed the Ca ii K line, using grating Nr. 6, centered at 3934 Å, at a resolution of R=110 000. In addition to studying the presence of narrow absorption features in the Ca ii K line, it can also be used to make a reliable determination of the projected rotational velocities. An exact knowledge of this parameter is indispensable in our abundance analysis, especially in spectral regions with many blend lines and for fast rotators. Furthermore, Ca has proven to be a sensitive indicator of diffusion processes. We observed Ba for the same reason. Sodium (Na i D1 and D2) observations were carried out for the two stars where we found narrow absorption features in Ca ii K during the first two nights. In addition, we observed two comparison stars with pure stellar profiles to correct for telluric lines. On the third and fourth night we observed Ba ii and the O i triplet at 7771-4 Å, using grating Nr. 5, centered at = 4934 Å, and = 7800 Å, with R=60 000. A target list, including the elements observed, is given in Table 1.
For eight stars (HR 804, HR 1483, HR 1666, HR 2491, HR 2763, HR 5531, HR 6378, and HR 8728) we have spectra of the Ca ii K line region taken in 1996 and 1997 with the ESO CES system, at a resolution of R=70 000 (see HHK99).
4 Data reduction
Data reduction was carried out using ESO MIDAS standard routines. We used Th–Ar spectra for the wavelength calibration of the Ca ii K and Ba ii lines, and Th–Ne spectra for the O i data (Odorico et al. OGP87 (1987)).
We have constructed a template to correct for telluric lines in the Na i D region by dividing the pure stellar spectrum of HR 4534 by its synthetic spectrum. This template contains only the telluric lines, and was used to clean up the spectra of the two stars HR 1989 and HR 6556.
5 Fundamental parameters
We obtained values of Teff and from uvby photometry, using an updated version of the UVBYBETA code (Moon & Dworetsky Moon (1986); Napiwotzki et al. Napiwotzki (1993)). Typical errors for these parameters were T K and dex. The final parameters are given in Table 2, columns 3 and 4. Using these parameters and a solar composition (Anders & Grevesse Anders (1989)), we used the ATLAS9 code (Kurucz Kurucz1 (1992)) to calculate plane-parallel atmospheric models. For all stars, we assume a microturbulence, , of km s-1, consistent with previous work (Holweger & Rentzsch-Holm HRH95 (1995); HHK99).
| HR | HD | Teff | ||
|---|---|---|---|---|
| 553 | 11636 | 8370 | 4.1 | 60/75/75 |
| 804 | 16970 | 9230 | 4.1 | 165/175/175 |
| 1483 | 29573 | 8930 | 3.9 | 25/30/30 |
| 1666 | 33111 | 8100 | 3.6 | 180/210/210 |
| 1989 | 38545 | 8600 | 3.5 | 200/190/– |
| 2491 | 48915 | 10130 | 4.3 | 18/18/– |
| 2763 | 56537 | 8480 | 3.9 | 150/160/150 |
| 3083 | 64491 | 7140 | 4.1 | 60/25/– |
| 3569 | 76644 | 8060 | 4.2 | 160/145/145 |
| 4295 | 95418 | 9600 | 3.8 | 43/45/45 |
| 4534 | 102647 | 8630 | 4.2 | 110/125/115 |
| 4828 | 110411 | 9210 | 4.2 | –/166/– |
| 5351 | 125162 | 8925 | 4.1 | 105/105/105 |
| 5531 | 130841 | 8240 | 4.0 | 80/80/65 |
| 5793 | 139006 | 9740 | 3.9 | 140/125/115 |
| 5895 | 141851 | 8770 | 3.8 | 250/250/– |
| 6378 | 155125 | 8850 | 3.9 | 19/15/– |
| 6556 | 159561 | 7960 | 3.6 | 210/225/225 |
| 7001 | 172167 | 9500 | 3.9 | 22/22/– |
| 8728 | 216956 | 8760 | 4.2 | 75/–/– |
| 8947 | 221756 | 8800 | 3.8 | 100/100/– |
6 Abundance analysis
Abundance analysis is done by synthesizing a spectrum using the Kiel line formation code, LINFOR. We derive abundances for five elements, O, Ca, Ba, Fe, and Y, in the three spectral windows. Here, we describe the input line data and the non-LTE calculations for O i.
6.1 Line data
The line data used in this analysis is taken from the VALD database (Kupka (1999)) and is summarized in Table 3. We use a total of 176 lines to fit the spectra in the spectral range of the Ba and Y lines, but in most cases, due to heavy blending, the Fe abundance is derived from a strong blend of Fe lines at 4958 Å. We then use this Fe abundance to derive a Ba abundance from the Ba/Fe blend at 4934 Å, and derive the Y abundance from the Y/Ba blend at 4900 Å.
| [Å] | Ref. | |||||
|---|---|---|---|---|---|---|
| O i | ||||||
| 7771.94 | 9.15 | 0.324 | -13.25 | -30.73 | 0.37 | 1 |
| 7774.17 | 9.15 | 0.174 | -13.25 | -30.73 | 0.37 | 1 |
| 7775.39 | 9.15 | -0.046 | -13.25 | -30.73 | 0.37 | 1 |
| Ca ii | ||||||
| 3933.66 | 0.00 | 0.14 | -13.8 | -30.95 | 1.34 | 2 |
| Ba ii | ||||||
| 4899.93 | 2.72 | -0.080 | -12.57 | -30.65 | 0.92 | 3 |
| 4934.08 | 0.00 | -0.150 | -13.17 | -30.64 | 0.91 | 3 |
| Fe i | ||||||
| 4933.290 | 3.30 | -2.287 | -14.82 | -31.02 | 1.06 | 4 |
| 4933.330 | 4.23 | -0.604 | -13.61 | -30.93 | 2.54 | 4 |
| 4934.010 | 4.15 | -0.589 | -12.98 | -30.94 | 2.54 | 4 |
| 4934.080 | 3.30 | -2.307 | -14.81 | -31.10 | 0.55 | 4 |
| 4957.300 | 2.85 | -0.408 | -13.71 | -29.69 | 1.02 | 5/4/6 |
| 4957.600 | 2.81 | 0.233 | -13.71 | -29.71 | 1.02 | 5/4/6 |
| 4957.680 | 4.19 | -0.400 | -12.84 | -30.96 | 2.47 | 4 |
| Fe ii | ||||||
| 4958.820 | 10.38 | -0.645 | -13.52 | -30.87 | 1.02 | 4 |
| Y ii | ||||||
| 4900.120 | 1.03 | -0.090 | -13.36 | -31.17 | 0.92 | 3 |
6.2 Non-LTE effects
We discuss here the non-LTE effects of the individual elements, although a detailed non-LTE abundance determination was only performed for the O triplet, where we expect large departures from LTE (Paunzen et al. Paunzen (1999)). We derived level populations for all the relevant energy levels of neutral O, using the Kiel NLTE code, the model atmospheres described in Sect. 5, and the O i model atom described in Paunzen et al. (Paunzen (1999)). Non-LTE corrections were typically of the order of dex (see Table 4).
| [O] | [O] | [Ca] | [Ba] | [Y] | [Fe] | ||
|---|---|---|---|---|---|---|---|
| HR | HD | LTE | NLTE | ||||
| 553 | 11636 | 0.4 | -0.05 | -0.14 | 1.6 | 0.3 | 0.0 |
| 804 | 16970 | 0.25 | -0.2 | 0.16 | 0.2 | 0.0 | 0.0 |
| 1483 | 29573 | 0.0 | -0.35 | -0.34 | 1.0 | 0.7 | 0.0 |
| 1666 | 33111 | 0.6 | 0.05 | -0.24 | -0.4 | 0.0 | -0.4 |
| 1989 | 38545 | 0.6 | 0.0 | -0.09 | |||
| 2020 | 39060 | 0.02 | 0.09 | 0.13 | |||
| 2491 | 48915 | 0.13 | -0.32 | -0.39 | 1.39 | 0.2 | |
| 2763 | 56537 | 0.65 | 0.10 | 0.00 | 0.2 | 0.0 | -0.3 |
| 3083 | 64491 | -0.62 | -0.8 | -1.35 | |||
| 3569 | 76644 | 0.25 | -0.15 | 0.25 | 0.4 | 0.2 | -0.1 |
| 4295 | 95418 | 0.3 | -0.2 | -0.16 | 1.0 | 0.7 | -0.05 |
| 4534 | 102647 | 0.55 | 0.1 | -0.04 | 0.3 | 0.2 | -0.3 |
| 4828 | 110411 | 0.4 | -0.05 | ||||
| 5351 | 125162 | -1.77 | -0.7 | ||||
| 5531 | 130841 | -0.45 | -0.68 | -0.84 | 0.5 | 0.4 | -0.7 |
| 5793 | 139006 | 0.35 | -0.2 | 0.00 | -0.5 | ||
| 5895 | 141851 | 0.00 | |||||
| 6378 | 155125 | -0.5 | -0.78 | -0.24 | 0.26 | -0.51 | |
| 6556 | 159561 | 0.6 | 0.05 | -0.14 | 0.3 | 0.0 | -0.4 |
| 7001 | 172167 | 0.98 | 0.17 | -0.53 | 1.92 | -0.55 | |
| 8728 | 216956 | 0.07 | -0.03 | ||||
| 8947 | 221756 | -0.23 |
For Fe non-LTE corrections have been shown to be well below dex for all program stars (Rentzsch-Holm Rentzsch (1996)). We did not perform NLTE calculations in this case since the typical error from our abundance analysis was around 0.2 dex.
Non-LTE corrections of Ba have been shown to depend strongly on the Ba abundance itself (Lemke Lemke2 (1990)). In Lemke’s sample of normal A stars, the abundance corrections range from to dex. The overabundances we derived in this work are up to 2.0 dex, so can never be removed by non-LTE corrections.
Since we observe Y ii and Ca ii, we do not expect significant departures from LTE, as these are the dominant ionization states of the atom. This has been justified by Stürenburg (S93 (1993)), who found a mean correction of 0.03 dex for the Ca ii K resonance line.
6.3 Abundances
The spectral abundances derived from this work are summarized in Table 4. It proved impossible to derive reliable Ba and Y abundances in the star HR 5793 due to its large rotational velocity and the poor S/N ratio in the spectral range of the Ba lines. Given the large number of Fe lines we were able to derive an Fe abundance. In HR 5351, we could only deduce the Ba abundance. The typical error in the abundance analysis is 0.02–0.05 dex, depending on the spectral quality. In addition, the uncertainty in the stellar parameters may introduce an error of the order of 0.2 dex.
In Vega, our Ca abundance, , compares well with the value of 5.82, obtained by Lemke (Lemke2 (1990)). The non-LTE O abundance, [O], derived from the triplet at 7771 Å, also agrees well with the LTE abundance derived from visible lines that are barely affected by non-LTE, [O], (Qiu et al. Qiu (2001)). In Sirius, our Ca ii abundance of 5.97 could indicate that Lemke (Lemke2 (1990)) slightly overestimated the non-LTE effects in neutral Ca when deriving Ca abundances, , .
We completed our data using the following abundance analyses; Lemke (Lem89 (1989), Lemke2 (1990)) for HR 2491 (Ba, Fe): Gigas (Gigas1 (1986), Gigas2 (1988)) for HR 7001 (Ba, Fe): Holweger et al. (Holweger97 (1997)) for HR 2020 (Ca, Ba, Fe): Dunkin et al. (Dunkin (1997)) for HR 8728 (Fe): Cowley & Aikman (Cowley1 (1980)) for HR 6378 (Y, Fe).
7 Circumstellar lines
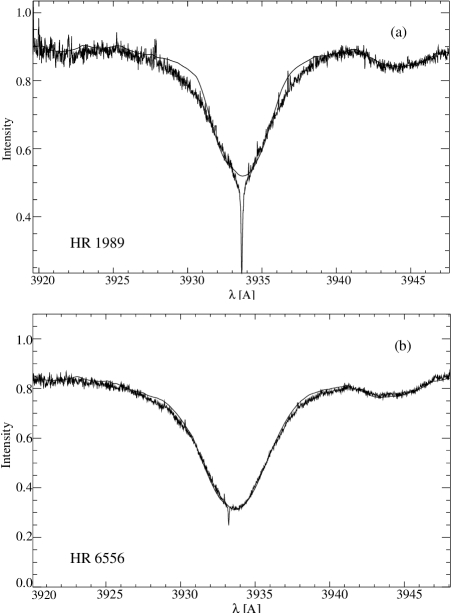
Our analysis of the Ca ii K data gave evidence for narrow absorption features in the rotationally broadened stellar line profile of two stars, HR 1989 and HR 6556.
7.1 HR 1989
Narrow absorption lines had already been detected in HR 1989 by Stürenburg (S93 (1993)), Bohlender & Walker (Bohlender (1994)), and Hauck et al. (Hauck (1998)). The latter gives an equivalent width of 72.2 mÅ, at a redshift of 11.1 km s-1. Our data gives a similar equivalent width, of 65 mÅ, but at a blueshift of 1 km s-1 (Fig. 1a). Therefore we conclude that the absorption feature varies with radial velocity with respect to the star, proving that in this case it is of circumstellar origin.
Despite the poor S/N ratio of the spectrum, the Na i D lines in HR 1989 show strong narrow absorptions at the line centers. Their equivalent width are 72.2 and 33 mÅ for the D2 and D1 line respectively, but the uncertainty on these values is large since the stellar line fit is so poor. Sfeir et al. (Sfeir (1999)) obtained data for lines-of-sight towards 143 stars, one being HR 1989, to map the local bubble. They derived equivalent widths of 34.1 and 16.4 mÅ for the Na i D2 and D1 lines, respectively. Using our Ca observations and Sfeir et al. (Sfeir (1999)) Na observations, we obtained a Na i/Ca ii ratio that is lower than 1. This also hints at a circumstellar rather than interstellar origin of the features provided that we ignore possible variabilities between the different observing periods.
7.2 HR 6556
In HR 6556, HHK99 found a circumstellar Ca absorption with an equivalent width of 22 mÅ, at a blueshift of 35 km s-1. Our data gives a slightly smaller equivalent width of 14 mÅ, at a blueshift of 32 km s-1 (Fig. 1b). Therefore this feature appears to be stable within the error limits. The Na spectrum of HR 6556 is so noisy that we are not able to deduce the presence or absence of narrow circumstellar lines.
A study of the interstellar Na i density distribution in the solar neighbourhood revealed that the observed Na column density in HR 6556 did not agree with neighbouring values (Vergely et al. Vergely (2001)). In fact, the discrepancy is about a factor of 200. We interpret this as evidence for circumstellar gas around HR 6556.
8 Dusty versus dust-free A stars
To ensure that our sample was homogeneous, we removed all the newly discovered spectroscopic binaries (see Table 1), since the abundance determination in these objects underestimates the real abundances. We also excluded the Bootis stars, because these belong to a subgroup of A stars where the mechanism giving rise to the metal-poor abundance pattern is not yet fully understood (Paunzen P99 (1999)). In addition some of the Bootis stars are beyond 50 pc, and IRAS measurements give only upper limits on the infrared fluxes, so that we do not know whether they are dusty or not. The remaining stars were split into two groups, those with (5) and without (7) infrared excess.

Even small amounts of accreted material will show up in the photospheric composition of A stars, since they have shallow convection zones ( M⊙, Turcotte & Charbonneau Turcotte (1993)). Besides accretion, meridional mixing and diffusion are the most important processes affecting the stellar abundance pattern. While meridional mixing simply wipes out any inhomogeneities, diffusion acts selectively on certain elements, imprinting its own abundance pattern which differs from the accretion pattern.
Surprisingly, there is no difference between the abundance patterns of dusty A stars and those of dust-free A stars. Table 5 shows that the mean abundance patterns of both groups of stars agree within the abundance analysis error. Only for Y do we have a discrepancy, which can be explained by the fact that this element is only determined in very few stars.
| [O] | [Ca] | [Ba] | [Y] | [Fe] |
|---|---|---|---|---|
| -0.15 (19) | -0.09 (15) | 0.60 (41) | 0.53 (24) | -0.05 (14) |
| -0.07 (14) | -0.07 (21) | 0.53 (66) | 0.08 (12) | -0.14 (21) |
We do not find any correlation between abundances and effective temperature or gravity. However there is a pronounced correlation between the Ba abundances and the rotational velocity, with the overabundances diminishing with increasing (Fig. 2b). According to Michaud (Mich70 (1970)), the overabundances of Ba are due to diffusion processes, and their disappearence at higher is a result of efficient meridional mixing at rotational velocities in excess of 100 km s-1 (Turcotte & Charbonneau Turcotte (1993)). The Y abundances show also a marginal increase towards lower . Cowley (Cowley0 (1976)) noted that diffusion theory does not predict large Y overabundances, which is in good agreement with our findings. We expect mild underabundances of Ca from diffusion theory, a trend which is qualitatively seen for stars with low rotational velocities in Fig. 2a. In all three cases, no distinction can be made between the dusty and dust-free stars in our sample.

A plot of the specific element abundance versus [Ba/Fe] ratio is used as a diagnostic tool to detect diffusion signatures. The use of the ratio ensures that any star-to-star metallicity variation cancels, and the influence of accretion likewise is excluded — in the standard accretion model Fe and Ba are both entirely condensed in dust grains — so that we are left only with diffusion effects. Fig. 3a and 3b illustrate how Ca and Ba are affected by diffusion: Ba shows large overabundances, but there is a trend for Ca to be depleted in the photosphere in the presence of strong diffusion. This is in perfect qualitative agreement with the theoretical predictions of Michaud (Mich70 (1970)). As expected, we find that in our program stars, O and Fe are not affected by diffusion due to their high abundance and large number of lines (Fig. 3c).
We derive least-square fits for the correlations between the Ca, Ba and Fe abundances with the [Ba/Fe] ratio, using the dusty and dust-free stars (dashed-dotted lines in Fig. 3). The parameters of the individual fits are calculated assuming a typical abundance error of 0.2 dex for all stars. The results are summarized in Table 6. Based on this analysis, we can definitely exclude a pure accretion signature for the dusty A stars.
| [Ca] vs. [Ba/Fe] | [Ba] vs. [Ba/Fe] | [Fe] vs. [Ba/Fe] | |
|---|---|---|---|
| m | -0.210.08 | 0.930.08 | -0.070.08 |
| c | 0.040.14 | -0.100.14 | -0.090.14 |
| rms | 0.16 | 0.22 | 0.22 |
| rms1 | 0.06 | 0.19 | 0.19 |
| rms2 | 0.17 | 0.21 | 0.21 |
9 Discussion
We showed that dusty and dust-free A stars possess the same abundance patterns and fit both into the diffusion scenario. We do not detect any specific accretion signature in the stars with circumstellar dust, even though there are a few slow rotators amongst them. This result agrees with the findings of Holweger et al. (Holweger97 (1997)) for Pictoris, which, despite of its conspicuous circumstellar disk, shows no signs of accretion. Typical disk masses derived for the dusty stars of our sample range from to M⊙. So in all cases the disk contains enough material to contaminate the stellar photosphere. In their study Cheng et al. (Cheng92 (1992)) excluded any confusion of the infrared-excess with a background source, which leaves us with a question: Why do the dusty A stars seem to be unaffected by the surrounding circumstellar dust?
There are two possibilities which may explain the non-detection of any peculiar abundance pattern in dusty A stars. First, the stars may accrete circumstellar matter at an extremely low rate, e.g. M☉ yr-1. This would mean that the accretion rate is too low to overcome diffusion and therefore cannot significantly contaminate the convection zone of the star. The second possibility is that there is no interaction between the star and the disk, implying the existence of a gap, similar to that which is apparant in the case of Pictoris and HR 4796.
Acknowledgements.
We thank the DFG for subsidizing this project by a travel and observing grant (KA 1581/1-1) and Helen Fraser for a careful reading of the manuscript.References
- (1) Alecian, G. 1996, A&A, 310, 872
- (2) Anders, E., & Grevesse, N. 1989, Geochim. Cosmochim. Acta, 53, 197
- (3) Barklem, P. S., Piskunov, N., & O’Mara, B. J. 2000, A&AS, 142, 467
- (4) Bohlender, D. A., & Walker, G. A. H. 1994, MNRAS, 266, 891
- (5) Bronstein, I. N., & Semendjajew, K.A. 1989, Taschenbuch der Mathematik, Teubner Verlagsgesellschaft, Leipzig
- (6) Cheng, K. P., Bruhweiler, F. C., Kondo, Y., & Grady, C. A. 1992, ApJ, 396, L83
- (7) Cowley, C. R. 1971, Observatory, 91, 139
- (8) Cowley, C. R. 1976, Astrophysical Letters, 17, 3
- (9) Cowley, C. R., & Aikman, G. C. L. 1980, ApJ, 242, 684
- (10) Dunkin, S. K., Barlow, M. J., & Ryan, S. G. 1997, MNRAS, 286, 604
- (11) Gigas, D. 1986, A&A, 165, 170
- (12) Gigas, D. 1988, A&A, 192, 264
- (13) Gillet, D., Burnage, R., Kohler, D., et al. 1994, A&AS, 108, 181.
- (14) Gratton, R. G., Bonanno, G., Claudi, R. U., et al. 2001, A&A, 377, 123
- (15) Griem, H.R. 1968, Phys. Rev., 165, 258
- (16) Hauck, B., Ballereau, D., & Chauville, J. 1998, A&AS, 128, 429
- (17) Heinrichsen, I., Walker, H. J., & Klaas, U. 1998, MNRAS, 293, L78
- (18) Hoffleit, D., & Warren Jr., W. H. 1991, The Bright Star Catalogue, 5th Revised Edition
- (19) Holweger, H., Hempel, M., van Thiel, T., & Kaufer, A. 1997, A&A, 320, L49
- (20) Holweger, H., Hempel, M., & Kamp, I. 1999, A&A, 350, 603 (HHK99)
- (21) Holweger, H., & Rentzsch-Holm, I. 1995, A&A, 303, 819
- (22) Hui-Bon-Hoa, A., & Alecian, G. 1998, A&A, 332, 224
- (23) Kamp, I., Iliev, I. Kh., Paunzen, E., et al. 2001, A&A, 375, 899
- (24) Kupka, F., Piskunov, N. E., Ryabchikova, T. A., Stempels, H. C., & Weiss, W. W. 1999, A&AS, 138, 119 (VALD-2)
- (25) Kurucz, R.L. 1992, Rev. Mex. Astron. Astrofis., 23, 181
- (26) Kurucz, R.L. 1993, CD-ROM No. 18. Cambridge, Mass.: Smithsonian Astrophysical Observatory
- (27) Kurucz, R.L. 1994, CD-ROM No. 20-22. Cambridge, Mass.: Smithsonian Astrophysical Observatory
- (28) Lemke, M. 1989, A&A, 225, 125
- (29) Lemke, M. 1990, A&A, 240, 331
- (30) Lemke, M., & Venn, K. A. 1996, A&A, 309, 558
- (31) Michaud, G. 1970, ApJ, 160, 641
- (32) Moon, T. T., & Dworetsky, M. M. 1986, MNRAS, 220, 787
- (33) Napiwotzki, R., Schönberner, D., & Wenske, V. 1993, A&A, 268, 653
- (34) Odorico, S. D., Ghigo, M., & Ponz, D. 1987, ESO Scientific Report No. 6
- (35) Paunzen, E., Kamp, I., Iliev, I. Kh., et al. 1999, A&A, 345, 597
- (36) Paunzen, E. 1999, Ap&SS, 266, 379
- (37) Qiu, H. M., Zhao, G., Chen, Y. Q., & Li, Z. W. 2001, ApJ, 548, 953
- (38) Rentzsch-Holm, I. 1996, A&A, 312, 966
- (39) Sfeir, D. M., Lallement, R., Crifo, F., & Welsh, B. Y. 1999, A&A, 346, 785
- (40) Smith, V. V., Cunha, K., & Lazzaro, D. 2001, ApJ, 121, 3207
- (41) Stürenburg, S. 1993, A&A, 277, 139
- (42) ten Brummelaar, T., Mason, B. D., McAlister, H. A., et al. 2000, AJ, 119, 2403
- (43) Turcotte, S., & Charbonneau, P. 1993, ApJ, 413, 376
- (44) Unsöld, A. 1968, Physik der Sternatmosphären. 2.Aufl., Springer Verlag, Heidelberg
- (45) Venn, K. A., & Lambert, D. L. 1990, ApJ, 363, 234
- (46) Vergely, J.-L., Freire Ferrero, R., Siebert, A., & Valette, B. 2001, A&A, 366, 1016
- (47) Wiese, W. L., Smith, M. W., & Miles, B. M. 1969, Atomic transition probabilities. Vol. 2: Sodium through Calcium, NSRDS-NBS, Washington, D.C.
- (48) Wiese, W. L., Fuhr, J. R., & Deters, T. M. 1996, J. Phys. Chem. Ref. Data, Mono 7
- (49) Woolley, R.v.d.R., Epps, E. A., Penston, M. J., & Pocock, S. B. 1970, Roy.Obs.Ann., 5