Studying the Dynamics of Star Forming and IR Luminous Galaxies with Infrared Spectroscopy \tocauthorR. Genzel, L.J. Tacconi, M. Barden, M.D. Lehnert, D. Lutz, D. Rigopoulou, N. Thatte 11institutetext: Max-Planck Institut für extraterrestrische Physik, Garching, FRG
Studying the Dynamics of Star Forming and IR Luminous Galaxies with Infrared Spectroscopy
Abstract
With the advent of efficient near-IR spectrometers on 10m-class telescopes, exploiting the new generation of low readout noise, large format detectors, OH avoidance and sub-arcsecond seeing, 1-2.4 spectroscopy can now be exploited for detailed galaxy dynamics and for studies of high-z galaxies. In the following we present the results of three recent IR spectroscopy studies on the dynamics of ULIRG mergers, on super star clusters in the Antennae, and on the properties of the rotation curves of z1 disk galaxies, carried out with ISAAC on the VLT, and NIRSPEC on the Keck.
1 Ultra-Luminous Infrared Galaxies:
Ellipticals and QSOs in Formation?
Recent deep mid-IR [8] and submillimeter [4] surveys have discovered a population of distant, dust enshrouded starbursts that may contribute about half of the cosmic star formation activity at z1 [13]. These IR-luminous starbursts may be large bulges/ellipticals in formation. (Ultra)-luminous infrared galaxies ((U)LIRGs: L(1-1000m)1012)L⊙, [24]) may be the local-Universe analogues of the high-z population. Almost all ULIRGs are advanced mergers of gas rich disk galaxies. Following the ‘ellipticals through mergers scenario’ of Toomre and Toomre [33], Kormendy and Sanders [17] proposed that ULIRGs may evolve into ellipticals through merger induced, dissipative collapse. In the process, such mergers may go through a very luminous starburst phase and later evolve into classical QSOs [25]. Studies of local ULIRGs thus may be a key to better understand the properties and evolution of the high-z population.
To test the ‘ellipticals in formation’ and ‘QSOs in formation’ scenarios we have recently begun a program of determining the fundamental structural and dynamical properties of the stellar hosts of ULIRGs [14, 31]. If ULIRGs evolve into ellipticals, late stage ULIRG merger remnants should lie on or near the fundamental plane () of early type galaxies. If they also evolve into QSOs, the hosts and central black holes of ULIRGs and QSOs of similar luminosities should have similar properties. ULIRG mergers are not in equilibrium. Recent numerical simulations have shown, however, that because of the rapid action of violent relaxation and tidal torques, the dynamical properties of late stage, compact merger remnants are already fairly close to their final equilibrium values [21, 2]. Our project required infrared imaging and spectroscopy since ULIRGs are highly obscured (AV(screen)10-40). It required 10m class telescopes because high quality (SNR100) spectra are necessary to reliably extract velocity dispersions.
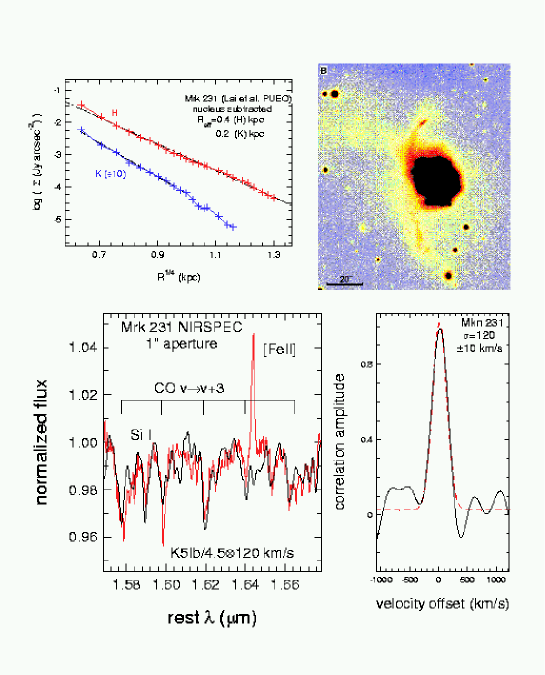
We selected our program ULIRGs from the BGS, 2 Jy and 1 Jy IRAS catalogs, culling from these catalogs those sources that have single nuclei, or are compact (a few kpc) double nuclei systems on near-IR images, but have definite signatures for a recent merger, such as tidal tails. We picked sources with redshifts 0.16, where reasonably strong stellar absorption features fall in the J, H, or K-bands. We have presently data on 18 ULIRG merger remnants, 8 of which contain QSO-like active galactic nuclei. As an example, Figure 1 shows our Keck NIRSPEC data of Mkn 231, along with a B-band image from [5], and the nucleus subtracted, H/K surface brightness distribution from [19]. Mkn 231 is the most luminous ULIRG within z=0.05 (logL) and is also an IR-excess BAL QSO. The two tidal tails and its compact structure with a single bright nucleus suggest it is a late stage merger of near equal mass disk galaxies. The highly AGN diluted central spectrum can be reasonably well fit by a Gaussian velocity dispersion of 120 km/s, which is the lowest of our entire ULIRG sample.
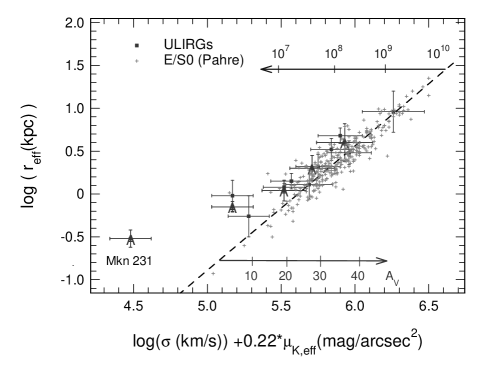
Figure 2 shows an edge-on projection of the fundamental plane of early type galaxies. Small grey crosses denote ellipticals/S0s from the compilation of [22]. Large symbols (with error bars) mark the locations of our ULIRGs, with the AGN dominated sources marked with the letter ‘A’. ULIRGs fall remarkably close to the fundamental plane. Their stellar kinematics is largely pressure supported and in most cases stellar rotation, if present, is smaller than the rotation of the gaseous component of the same system. They populate a wide range of the plane, are on average similar to moderate mass, disky ellipticals, but are well offset from giant ellipticals. Their typical effective radii (a few kpc) and velocity dispersions ( km/s) are comparable to the parameters of L* disky ellipticals. In contrast giant ellipticals have effective radii r kpc and an average velocity dispersion of km/s. Late stage ULIRG mergers also show significant rotation (), and are found in low density environments, again similar to disky ellipticals and unlike giant ellipticals. All 117 ULIRGs of the 1 Jy catalog [16] are found in the field (or possibly small groups), none in clusters. For comparison, of the giant ellipticals in the [1] and [9] samples, 50% reside in clusters of Abell richness class . Our observations thus strongly support the ‘ellipticals in formation’ scenario but indicate that ULIRG remnants will evolve into moderate mass disky ellipticals, or lenticulars. Giant ellipticals must have a different formation path (see also [9]).
The close proximity of the ULIRG mergers to the fundamental plane is surprising. ULIRGs are heavily obscured and contain a population of young stars. While the -coordinate is relatively insensitive to extinction effects, the K-band surface brightness and even the effective radius are affected by absolute and differential extinction and by population effects. The arrows in Figure 2 show how a point in the fundamental plane would move with extinction and aging of the underlying population. In addition the NICMOS images of [27] show that extinction increases toward the nuclei in most ULIRGs, resulting in effective radii decreasing with wavelength (see Figure 1). It is thus important to determine effective radii from near-IR images. Typical ULIRGs have A mag and a stellar population with a characteristic age of a few hundred Myr [31], the combination of which approximately cancel each other in Figure 2. So the good agreement of the ULIRGs with the fundamental plane in the surface brightness coordinate is to some extent the result of a ‘cosmic conspiracy’.
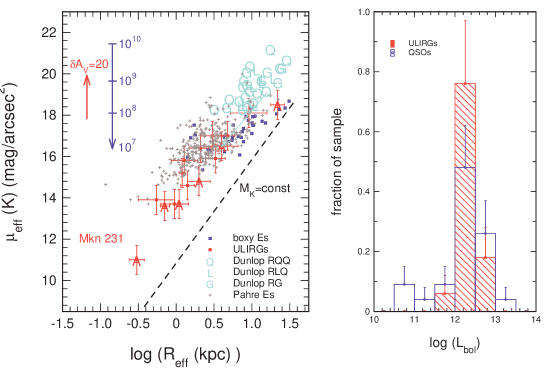
In the scenario of [25], the dusty ULIRGs are initially powered by star formation, but as the merger progresses, accretion onto the central black hole(s) increasingly dominates the bolometric luminosity. As the dust and gas is cleared out in the last stages of the merger, the dusty (infrared excess) QSO evolves into a classical, optically bright QSO. If this scenario is correct, late stage ULIRGs (likely AGN dominated) and optically selected QSOs of similar luminosities should have similar host properties. To test this hypothesis, we have compared our ULIRGs to the sample of 33 radio quiet and radio loud QSOs, and radio galaxies studied in detail by Dunlop and coworkers (e.g. [6] and references therein). The Dunlop AGNs sample a similar redshift range and luminosity distribution (Figure 3) as the ULIRGs. Figure 3 shows that these QSOs/radio galaxies occupy the upper right right of the - reff projection of the plane, coincident with the locus of giant ellipticals. The Dunlop et al. AGNs, which are fairly representative of optically selected, local Universe QSOs/radio galaxies, have effective radii 10 kpc, and 80% of them reside in clusters. While there are no measurements of velocity dispersions in the Dunlop AGNs yet, [3] have compiled velocity dispersions for 73 nearby radio galaxies. The sample average velocity dispersion of those radio galaxies is 256 km/s, in good agreement with the hypothesis that most local Universe QSOs/radio galaxies are large, massive early type galaxies. Some of the size difference between ULIRGs and QSOs may be attributable to the nuclear concentration of bright young star forming regions in the ULIRGs that will fade as the population ages, and thus lead to an increase of effective radius with time. However, the difference in velocity dispersions between the ULIRGs and the radio galaxies and giant ellipticals should be unaffected by population effects. We thus conclude that the average ULIRG host cannot evolve into a host of a typical QSO or radio galaxy.
After correction for a mean sample K-band extinction of AK(screen)=0.7 the average ULIRG has an absolute K-magnitude of -25.8 (5 L*), similar to that of the radio quiet QSOs. However, the average total dynamical mass of the ULIRG sample is 1.21011 M⊙, or about 0.9 m*. Hence the L/m ratio of the average ULIRG host is about 6 times greater than that of an old early type galaxy, corresponding to an effective age of the stellar population of a few hundred Myr. Taking the local black hole mass to bulge mass ratio [10, 12], we find that the average black hole mass in our ULIRGs is 7107 M⊙. In contrast Dunlop et al. estimate an average black hole mass of their sample to be 1.3109 M⊙. Since the nuclear luminosities of ULIRGs and QSOs are similar (Figure 3), ULIRGs must accrete at 50% the Eddington rate, rather than the 10% efficiency estimated for the Dunlop QSO sample.
In summary, we conclude that ULIRGs have less massive hosts than optically selected, low-z QSOs or radio galaxies. ULIRGs live in lower density environments. Their black holes are more akin to Seyfert galaxies. Nevertheless they can attain QSO-like bolometric and near-IR luminosities because they accrete more (and more efficiently) and have younger and thus brighter hosts. Once the merger induced, enormous influx of matter onto the central black hole(s) ceases, ULIRGs will become inactive, moderately massive field ellipticals or, if their black holes are fed, into objects akin to the hard-X ray luminous, early type galaxies found recently by Chandra. The average ULIRG cannot evolve into a classical optically selected QSO.
2 What Is the Nature of the Super Star Clusters
in the Antennae Merger?
During the last years, many interacting and merging galaxies were discovered to contain large numbers of very luminous young star clusters (e.g. [15, 36]. Their overall spectral properties suggest that they may be the progenitors of the globular cluster populations seen in normal nearby ellipticals and spirals (e.g. [37, 11, 26]).
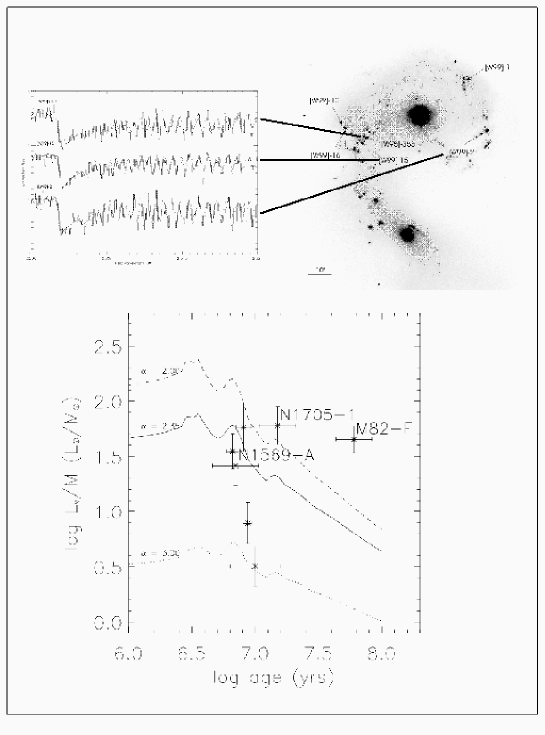
To test the ‘globular clusters in formation’ scenario and determine cluster masses and lifetimes, we observed several of the brightest young clusters in the Antennae (NGC4038/39) merger system with ISAAC and UVES high resolution spectroscopy [20]. Figure 4 marks the observed clusters on a K-band image. The target clusters were selected to be bright and exhibit large equivalent widths of 2.3m 0-2 CO stellar absorption, indicative of the presence of late type supergiants. The left upper inset of Figure 4 shows ISAAC spectra of the 0-2 CO overtone bands for the three clusters observed with ISAAC (, along with the best fit, Gaussian broadened stellar templates. In the case of UVES ( we targeted the CaT and other metal absorption lines in the 8500-8800 Å range in a total of four clusters, one of them ([W99]2) common between ISAAC and UVES. For all 5 clusters we used I-band HST imaging from Whitmore to derive half power radii from King-model fitting. We find a range of cluster velocity dispersions from 9 to 20 km/s, and half power radii from 3.6 to 6 pc. In the cluster common to UVES and ISAAC, both data sets are in excellent agreement and yield velocity dispersions of 14.3 and 14.0 km/s, respectively. Masses are derived from the Viral Theorem, which should be applicable since the clusters obviously already have survived for 20-50 crossing times. The corresponding dynamical masses range from 6–50 105 M⊙. Our data thus unambiguously show that the brightest Antennae clusters are indeed massive, with masses well above typical globular clusters ( M⊙). Our results are in good agreement with the hypothesis that the Antennae star clusters are globular clusters in formation, given that the observed clusters are at the top of the Antennae cluster luminosity function, that the HST imaging may somewhat overestimate cluster sizes (and thus masses) and that stellar evolution will remove mass from the clusters. Comparison with the N-body simulations of [32] indicates that the Antennae clusters should survive for several Gyrs but lose a significant fraction of their present mass.
In addition to the derived dynamical masses, we determined from our data the ages (8-10 Myr: from CO/CaT and HI Br equivalent widths) and the V-band/K-band luminosities of the 5 clusters. Taken together, our measurements constrain the distribution function of stellar masses in the clusters, which should be close to their birth/Initial Mass Function (IMF). The bottom inset in Figure 4 shows the results for four of our clusters in the plane LV/M vs log(t). For comparison we also plot the positions of a cluster in the starburst galaxy M82 and two clusters in the blue compact dwarfs NGC1705 and NGC1569 [30, 29]. Also plotted are L(t) ratios for power law IMFs with different slopes , assuming a mass range from 0.1 to 100 M⊙. A Salpeter IMF (solid line in Figure 4) has =2.35, and a Salpeter IMF with a mass range of 1-100 M⊙ has an L/M ratio that is a factor of 2.6 greater. At face value the data of the different clusters in Figure 4 require different IMF slopes (see also the analysis of the IMF in the Galactic star cluster NGC 3603 [7]. Most clusters are consistent with a Salpeter IMF, but (three of) the Antennae clusters require a steeper IMF, and the M82 and NGC 3603 clusters require a shallower IMF. To be consistent with a common (Salpeter-like) IMF, all authors would have had to significantly underestimate the errors in the analysis of their data. It is interesting to note that the clusters requiring a steeper IMF are all found in the dusty ‘overlap region’ between NGC 4038 and NGC 4039. Figure 8 thus provides the tantalizing result that IMFs vary in different environments. Obviously it is of great interest to increase the statistics and confidence of this potentially far-reaching result.
3 First Results of an IR Tully-Fisher Study
of Star Forming Disk Galaxies at z1
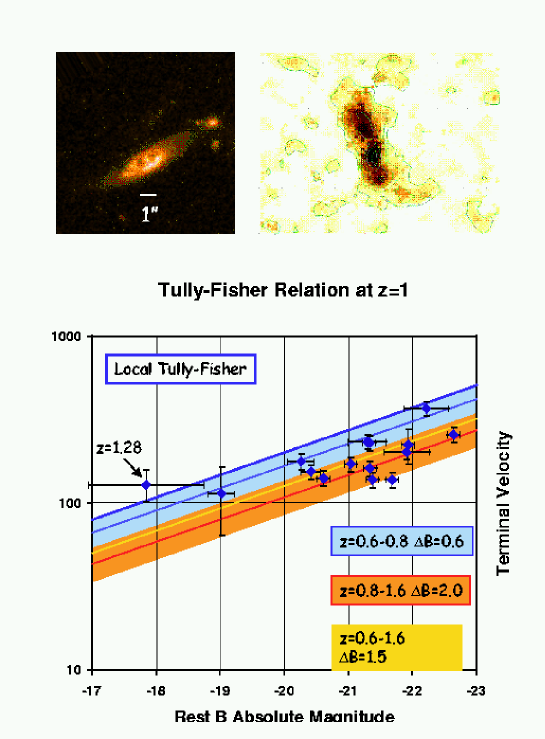
As part of the Ph.D. thesis of one of us (M.B.), we have recently begun a program of near-IR spectroscopy of distant disk galaxies for a determination of H rotation curves at z1. Our program extends to higher redshift earlier [OII] studies at z0.4–0.9 undertaken by the Lick group [34, 35, 18]. We have observed with ISAAC 20 inclined disk galaxies, selected from the CFRS, Hawaii medium deep and Caltech faint galaxy surveys to lie in the redshift range 0.6–1.6. HST images and photometry are available for nearly all of these sources. We gave preference to those systems with significant [OII] emission in the existing optical spectra. So far we have been able to extract H rotation curves for 16 galaxies. The top insets of Figure 5 show a typical (HST) image and a position-velocity diagram for one of our galaxies. In that case, the turnover of the observed rotation curve to the flat part appears to be well sampled. In other cases, the derivation of the true rotation curve requires careful modeling with an input rotation curve and taking into account the spatial and spectral convolution of our finite resolution data (see [34,35] for a discussion). A first cut Tully-Fisher curve is shown in the lower part of Figure 5 (for a ,h=0.7 cosmology). Our data are consistent with the same slope as the local Tully-Fisher relationship but indicate a 1.5 mag brightening in the rest-wavelength B-band. For comparison [35] did not find any significant evolution of the Tully-Fisher relation at z0.5 ( mag), while [23] and [28] find a brightening of 1.5-2 mag at z0.2–0.3 for blue, compact emission line galaxies. Our sample contains mainly large disk galaxies (disk scale lengths of 53 kpc), similar to [35], perhaps indicating a more significant evolution at the higher redshifts we are sampling (see also Weiner, this symposium). We are presently investigating in more detail the possible influence of the selection criteria of our sample on the results.
References
- (1) R. Bender, D. Burstein, S.M. Faber: ApJ 399, 462 (1992)
- (2) G.J. Bendo, J. Barnes: MNRAS 316, 315 (2000)
- (3) D. Bettoni, R. Falomo, G. Fasano, F. Gavoni, M. Salvo, R. Scarpa: A&A 380, 471 (2001)
- (4) A.W. Blain, I. Smail, R.J. Ivison, J.-P. Kneib, D.T. Frayer: Phys.Rep. in press, (astro-ph 0202228) (2002)
- (5) G. Canalizo, A. Stockton: AJ 120, 1750 (2000)
- (6) J.S. Dunlop, R.J. McLure, M.J. Kukula, S.A. Baum, C.P. O’Dea, D.H. Hughes: MNRAS in press, (astro-ph 0108397)(2002)
- (7) F. Eisenhauer, A. Quirrenbach, H. Zinnecker, R. Genzel: ApJ 498, 278 (1998)
- (8) D. Elbaz, C.J. Cesarsky, P. Chanial, H. Aussel, A. Franceschini, D. Fadda, R.R. Chary: A&A in press, (astro-ph 0201328) (2002)
- (9) S.M. Faber, et al.: AJ 114, 1771 (1997)
- (10) L. Ferrarese, D. Merritt: ApJ 539, L9 (2000)
- (11) U. Fritze-v.Alvensleben: A&A 342, L25 (1999)
- (12) K. Gebhardt, et al.: ApJ 539, L13 (2000)
- (13) R. Genzel, C. Cesarsky: ARAA 38, 761 (2000)
- (14) R. Genzel, L.J. Tacconi, D. Rigopoulou, D. Lutz, M. Tecza: ApJ 563, 527 (2001)
- (15) J.A. Holtzmann, et al.: AJ 103, 691 (1992)
- (16) D.C. Kim, D.B. Sanders: ApJS 119, 41 (1998)
- (17) J. Kormendy, D.B. Sanders: ApJ 390, L53 (1992)
- (18) D.C. Koo: these proceedings, (Springer, Heidelberg 2002) (astro-ph 0112552)
- (19) O. Lai, D. Rouan, F. Rigaut, R. Arsenault, E. Gendron: A&A 334, 783 (1998)
- (20) S. Mengel, M. Lehnert, N. Thatte, R. Genzel: A&A in press, (astro-ph 0111560) (2002)
- (21) J.C. Mihos: Ap&SS 266, 195 (1999)
- (22) M. Pahre: ApJS 124, 12 (1999)
- (23) H.-W. Rix, et al.: MNRAS 285, 779 (1997)
- (24) D.B. Sanders, I.F. Mirabel: ARAA 34, 749 (1996)
- (25) D.B. Sanders, B.T. Soifer, J.H. Elias, B.F. Madore, K. Matthews, G. Neugebauer, N.Z. Scoville: ApJ 325, 74 (1988)
- (26) F. Schweizer: In IAU Symposium 207, “Extragalactic Star Clusters”, eds. E. Grebel, D. Geisler, D. Minniti (ASP, San Francisco 2002) (astro-ph 0106345)
- (27) N.Z. Scoville, et al.: ApJ 119, 991 (2000)
- (28) L. Simard, et al.: ApJ 519, 563 (1999)
- (29) L.J. Smith, J.S. Gallagher: MNRAS 326, 1027 (2001)
- (30) A. Sternberg: ApJ 506, 721 (1998)
- (31) L.J. Tacconi, R. Genzel, D. Lutz, D. Rigopoulou, A. Baker, C. Iserlohe, M. Tecza: ApJ submitted (2002)
- (32) K. Takahashi, S.F. Portegies-Zwart: ApJ 535, 759 (2000)
- (33) A. Toomre, J. Toomre: ApJ 178, 623 (1972)
- (34) N.P. Vogt, et al.: ApJ 465, L15 (1996)
- (35) N.P. Vogt, et al.: ApJ 479, L121 (1997)
- (36) B.C. Whitmore, Q. Zhang, C. Leitherer, S.M. Fall, F. Schweizer, B.W. Miller: AJ 118, 1551 (1999)
- (37) S.E. Zepf, K.M. Ashman: MNRAS 264, 611 (1993)