Variable circular polarisation associated with relativistic ejections from GRS 1915+105
Abstract
We report the discovery of variable circularly polarised radio emission associated with relativistic ejections from GRS 1915+105, based on observations with the Australia Telescope Compact Array (ATCA) and the Multi-Element Radio-Linked Interferometer Network (MERLIN). Following a radio flare in 2001 January, significant and variable circular polarisation, at a fractional level of 0.2–0.4%, was measured with ATCA at four frequencies between 1–9 GHz. Following an additional outburst 65 days later in 2001 March, further ATCA observations measured a comparable sign and level of circular polarisation at two frequencies. At this second epoch, contemporaneous MERLIN observations directly imaged a relativistic ejection event and allowed us to confidently associate both the circularly and linearly polarised emission with the relativistic ejecta, allowing a detailed measurement of the full polarisation properties in the optically thin phase. The fractional circular polarisation spectrum appears to flatten at higher frequencies in 2001 January, when there is strong evidence for multiple components at different optical depths. While we cannot conclusively distinguish between synchrotron or propagation-induced conversion as the origin of the circularly polarised component, we do not consider that coherent or birefringent scintillation mechanisms are likely. The implication is therefore that the ejections from GRS 1915+105 are associated with a significant population of low-energy electrons, with associated consequences for the energetics of relativistic ejection events. We briefly compare the data for SS 433 and GRS 1915+105 with AGN and note that linear–to–circular polarisation ratios are observed in both binary sources at the lowest frequency, and ratios at the higher frequencies, illustrating the role of Faraday depolarisation. In addition, the 2001 January ATCA observations reveal a linear polarisation ‘rotator’ event, probing the (variable) orientation of the magnetic field structure in the outflow.
1 Introduction
Determining the physical composition and magnetic field structure of relativistic ejecta from black holes in Active Galactic Nuclei (AGN) and their local cousins, black holes and neutron stars in X-ray binaries (XRBs), is a fundamental question for the physics and energetics of accretion in the environment of such extreme objects. By measuring such quantities we can probe the probable magnetohydrodynamic formation of jets and the flow of mass at a handful of Schwarzschild radii.
Estimating the relative fractions of p+:e- ‘normal’ baryonic matter and e+:e- ‘antimatter’ pairs is not a straightforward exercise. However, in recent years there has been a revival of interest in the possibility of probing the composition and power of such relativistic jets by means of observing the circularly polarised (CP) component of their radio emission (Wardle & Homan 2002; Falcke et al. 2002; Macquart 2002). The CP component may arise directly from the synchrotron process if the matter is baryonic (e.g. Legg & Westfold 1968), from linear polarisation (LP) CP ‘repolarisation’ (e.g. Pacholczyk 1973; Jones & O’Dell 1977; Kennett & Melrose 1998) in a baryonic or pair plasma, or via some other poorly-understood mechanism. Recent circular polarisation (CP) observations of AGN (e.g. Wardle et al. 1998; Macquart et al. 2000; Rayner, Norris & Sault 2000; Homan, Attridge & Wardle 2001) have been used in an attempt to probe directly the composition and distribution of the particles in the jets from these supermassive black holes.
Closer to home, circular polarisation has been detected from the (probable) low-luminosity AGN (LLAGN) Sgr A* at the galactic centre (Bower, Falcke & Backer 1999; Sault & Marquart 1999) and the related nearby radio core in M81 (Brunthaler et al. 2001). In 2000 May we discovered circularly polarised radio emission from the famous galactic jet source SS 433 (Fender et al. 2000). This X-ray binary was clearly detected at four frequencies between 1–9 GHz with a CP spectrum decreasing with increasing frequency. However, our lack of ability to resolve the variable extended structure of SS 433 with the Australia Telescope Compact Array (ATCA) did not enable us to determine accurately the fractional CP spectrum and hence get a clear grip on the physical process which might be responsible. Furthermore, SS 433 seems to be unique amongst relativistic jet sources as it appears to have a fixed jet velocity of and displays optical / infrared / X-ray emission lines which seem to clearly indicate a large baryonic fraction (e.g. Margon 1984; Kotani et al. 1994).
1.1 The ‘microquasar’ GRS 1915+105
The X-ray binary GRS 1915+105 was the first galactic system to display apparent superluminal motions within our galaxy (Mirabel & Rodriguez 1994), implying large bulk velocities maybe comparable to those in AGN. The system has been directly resolved, on multiple occasions, into highly relativistic jets which display different patterns of behaviour closely linked to the X-ray state of the source (Fender et al. 1999; Dhawan, Mirabel & Rodriguez 2000; Klein-Wolt et al. 2002). Whilst displaying a highly complex pattern of X-ray behaviour (e.g. Belloni et al. 2000), the source does at times exhibit recognisable patterns. For example, it seems that the system regularly, perhaps always, follows extended hard X-ray periods (‘plateaux’) with major ejections (Fender et al. 1999; Klein-Wolt et al. 2002). These plateaux are themselves associated with powerful compact jets (Dhawan et al. 2000b; ) which have spectral similarities with self-absorbed jets from other black hole candidate (BHC) systems in similar hard X-ray states (Fender 2001). Furthermore, the observation of apparent superluminal motions from several other XRB BHCs (e.g. Mirabel & Rodriguez 1999) and the fairly typical ‘radio loudness’ (Fender & Kuulkers 2001) imply that the jets of GRS 1915+105 may be far more typical of those from XRBs than the relatively slow, cool, jets of SS 433.
In this paper we report the discovery of a strong and variable circularly polarised component in the radio emission from GRS 1915+105 which we can directly associate with relativistic ejection events.
2 Observations
In Fig 1 we show radio and soft X-ray monitoring of GRS 1915+105, over a 150-day period. The radio monitoring data were obtained with the Ryle Telescope (RT), at a frequency of 15 GHz; for a more detailed description of this monitoring program see Pooley & Fender (1997). The X-ray data are from the RossiXTE All-Sky Monitor (ASM) and measure the total flux in the 2-12 keV band. The RossiXTE ASM is described in Levine et al. (1996) and the public data can be obtained at xte.mit.edu.
Indicated in the top panels of Fig 1 are the times of our two ATCA and multiple MERLIN observations of GRS 1915+105.

2.1 ATCA
The Australia Telescope Compact Array (ATCA; Frater, Brooks & Whiteoak 1992) has a number of design features which enable very accurate circular polarization measurements. The low antenna cross-polarization and high polarization stability enable accurate calibration of polarization leakage terms, and the linearly-polarized feed design largely isolates Stokes V from contamination by Stokes I.
ATCA observed GRS 1915+105 twice, for six hours each, on 2001 January 17 and 2001 March 23. During the January observations, simultaneous observations at 1384 MHz and 2496 MHz were interleaved with observations at 4800 MHz and 8640 MHz; for the March observations, only 4800 MHz and 8640 MHz were observed. For both epochs the array was in a ‘6 km’ configuration, for which the lack of short baselines served to reduce confusion from other galactic sources. The observation and calibration procedures were similar to those described in Fender et al. (2000).
As discussed in Fender et al. (2000), calibration of circular polarization data requires the ”strongly-polarized” calibration equations (Sault, Killeen & Kesteven, 1991), using a point-source with a few percent linear polarization. This is needed to calibrate the leakage of linear polarization into circular. For the 4800 MHz and 8640MHz observations, the VLA calibrator 1923+210 was used as a polarization calibrator for both epochs. Calibrator confusion and low linear polarization, however, precluded the use of any of the observed calibrators as polarization calibrators for the January 1384 MHz and 2496 MHz observations. As a result, we were forced to use calibration solutions derived using the ”weakly-polarized” equations with the ATCA primary calibrator, 1934-638.
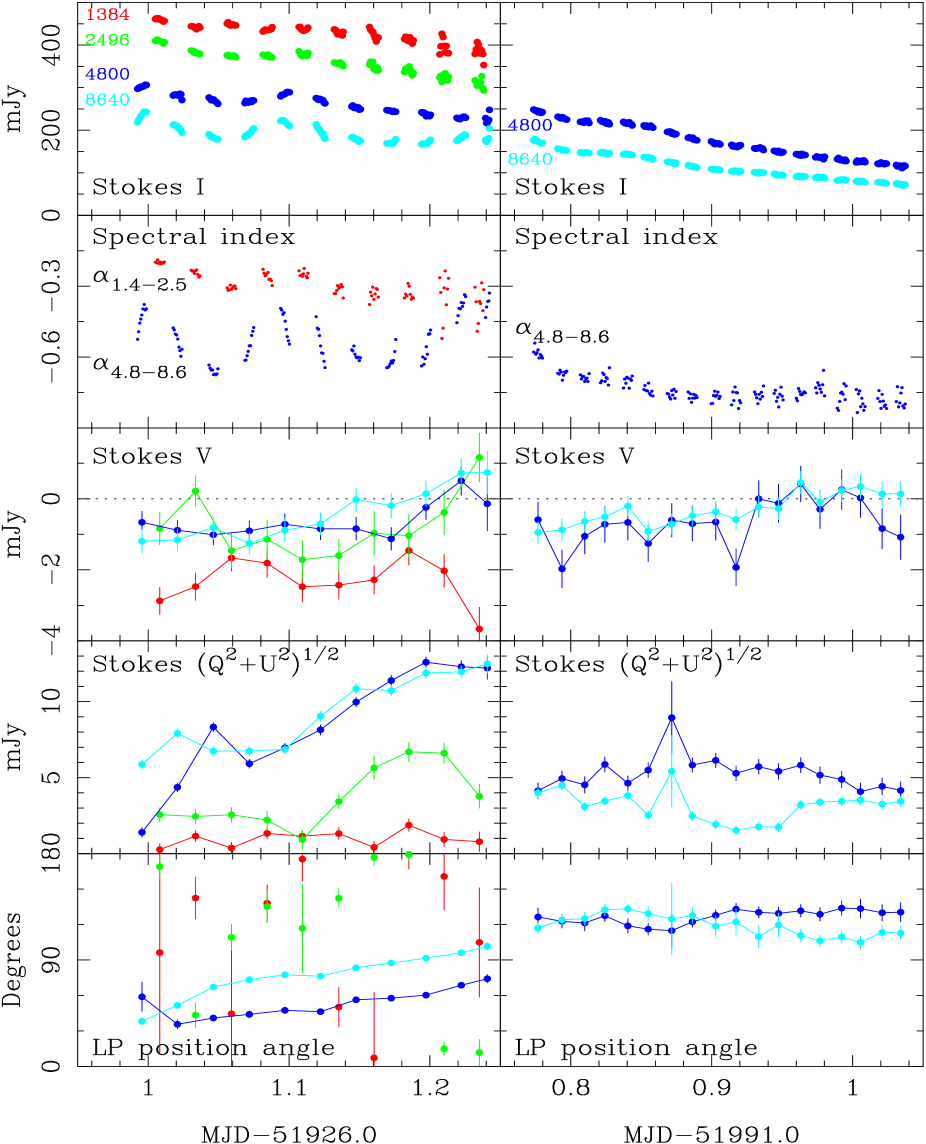
The use of the ”weakly-polarized” equations will cause a time-varying leakage of linear polarization into circular. In tests, peak leakages of 5% of the linear polarization into circular have been observed. For the 1384 MHz observations, the low linear polarization of GRS 1915+105 implies the effect of such leakage is negligible. Even for the 2496 MHz observations, where the linear polarization rises rapidly during the observation, in the worst-case the leakage would be only half the Stokes V error due to thermal noise. The full polarisation ATCA data for both epochs are presented in Fig 2.
2.2 MERLIN
The Multi Element Radio Linked Interferometer Network (MERLIN) consists of six individual antennae with a typical diameter of 25m and a maximum baseline of 217 km (Thomasson 1986). The observations presented here were undertaken in continuum mode at a frequency of 4994 MHz with a total bandwidth of 16 MHz. As MERLIN measures all four correlation products as a matter of course when in this mode, full polarimetric information can be derived from all images. Ongoing work is seeking to establish the reliability of Stokes V measurements with MERLIN; these will not be reported here.
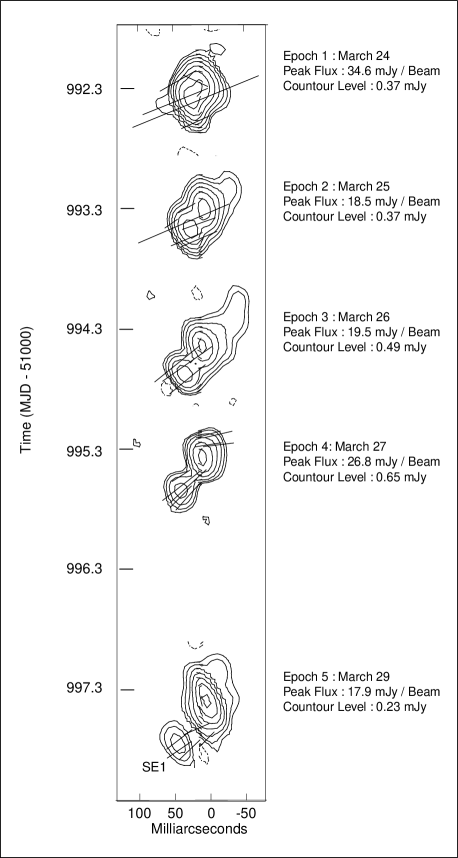
GRS 1915+105 was observed eleven times with MERLIN following the flare observed on 2001, March 22/23. The first five epochs, corresponding to daily observations between 2001 March 24 and March 27 and again on March 29, are presented in this paper (Fig 3); further details and analysis of the full set of MERLIN observations will be published in McCormick et al. (in prep). In each case a flux calibrator, 3C286, a point source, OQ208, and a phase calibrator, 1919+086 , were included in the observing schedule. The flux calibrator and point source calibrator were observed at the beginning and end of the run whilst the rest of the observation was devoted to a cycle of 1.5 minutes on the phase calibrator and 5 minutes on GRS 1915+105.
Initial data editing and calibration were performed using the standard MERLIN d-programs and the data were then transferred to the NRAO Astronomical Image Processing System (AIPS). Within AIPS the data were processed via the MERLIN pipeline, which calibrates and images the phase reference source and then applies these solutions to the target source. This process also derives instrumental polarisation corrections and calibrates the linear polarisation position angle, using 3C286 as the calibrator and assuming a position angle of 33°for its E vector. The position angles measured by MERLIN and ATCA are consistent with the same value, independently confirming the position angle calibration of each array.
Further self calibration was then carried out within AIPS and GRS 1915+105 imaged in total intensity and stokes Q and U. These maps were then combined using the AIPS task PCNTR to produce the final maps with total intensity contours and vectors denoting the direction and strength of linear polarisation.
Note that we can be confident both from previous studies (e.g. Mirabel & Rodriguez 1994; Fender et al. 1999) and these data (McCormick et al. in prep) that the component(s) to the south east (labelled in Fig 3 as ‘SE1’) is ‘approaching’, and component(s) to the north west are ‘receding’ (although in fact both sides of the jet have Doppler factors ).
3 Variable circular polarisation
In both sets of ATCA observations, GRS 1915+105 is unambiguously detected as a source of circularly polarised radio emission (Stokes V).

3.1 2001 January 17
In 2001 January (Fig 2, left panels), significant CP is measured at all four ATCA frequencies, from 1–9 GHz. The total flux density is clearly declining, indicating the decay phase of a major flare, but there is also significant variability superposed on the relatively smooth decline, preferentially at higher frequencies. This is almost certainly indicative of repeated activity in the core, corresponding to fresh ejection events. The spectral indices support this interpretation; between 1.4–2.9 GHz the spectrum is significantly flatter than expected for optically thin synchrotron emission; between 4.8–8.6 GHz it is displaying the rapidly varying behaviour associated with ‘core’ ejection events (Fender et al. 2002).
Inspection of the total flux and spectral index light curves indicates there were at least four separate ejection events contributing to the light curve at this epoch. Fig 1 also indicates that this outburst was more prolonged than that in 2001 March (see below).
The CP flux is clearly rising to lower frequencies, but the exact fractional spectrum is difficult to determine as the multiple components contributing to the observed emission are unresolved with ATCA. Table 1 lists the mean total, linearly polarised and circularly polarised flux densities, and Fig 4 plots these both as total and fractional spectra. We also note that there are measurements when the Stokes V flux is not significantly non-zero, and even a few points where it appears to have changed sign. However, (i) the mean Stokes V fluxes are significant, and negative (at both epochs), (ii) the apparent Stokes V sign change has a significance and so we do not consider it convincing.
| 2001 January | 2001 March | |||||
|---|---|---|---|---|---|---|
| (MHz) | I (mJy) | LP (mJy) | V (mJy) | I (mJy) | LP (mJy) | V (mJy) |
| 1384 | ||||||
| 2496 | ||||||
| 4800 | ||||||
| 8640 | ||||||
3.2 2001 March 23
In 2001 March, GRS 1915+105 was again observed to flare in our 15 GHz monitoring program, reaching mJy at MJD 51990.43. This time we triggered both ATCA and MERLIN – in fact the first epoch of MERLIN observations started at almost exactly the same time as the ATCA run concluded (Figs 3,5). As a result, we were able to definitively associate the outburst with relativistic ejections from the system (Fig 3).
The full polarisation ATCA data are presented in Fig 2 (right panels), and it is clear that there is less variability in the light curve than in 2001 January, with the smooth decay in radio flux at both frequencies only interrupted by the temporary increase around MJD 51991.82. Assuming the emission observed is associated with the radio event on which we triggered, our ATCA observations commence days after ejection (assuming a Doppler factor of – Fender et al. 1999 – this corresponds to only hr of evolution in the rest frame of the ejecta). The 4.8–8.6 GHz spectral index clearly demonstrates that the majority of the emission is coming from optically thin regions. The mean total intensity, linearly polarised and circularly polarised flux densities are presented in Table 1 and Fig 4.

4 A linear polarisation ‘rotator’ event
In the lower two panels of Fig 2 the linearly polarised flux densities and electric vector position angles are indicated. It is quite evident from the lower panel that over the hr of the observation in January 2001, both 4800 and 8640 MHz electric vectors rotate smoothly through degrees. Note that while there is evidence for changing absorption on the scales over which the ejecta from GRS 1915+105 can be tracked (Dhawan, Goss & Rodriguez 2000), variable Faraday rotation cannot be responsible for this effect since the separation between the vectors at the two frequencies remains constant (if Faraday rotation, which varies as , a rotation of degrees at 8.6 GHz should have a corresponding rotation of degrees at 4.8 GHz).
The smooth rotation in the electric vector position angle seems to be a little at odds with both the MERLIN observations of Fender et al. (1999) in which the electric vector was varying seemingly erratically from day-to-day, and the observations presented here (both ATCA and MERLIN) for 2001 March, in which the vector remains approximately constant. Such smooth rotation indicates either a genuinely rotating jet or, perhaps more likely, a smooth change in the (projected) position angle of the magnetic field in the emitting region – such as a global curved structure in the jet.
Similar behaviour, ‘polarisation rotator events’ – see Saikia & Salter (1988) and references therein - has also been observed in AGN. While initially interpreted as physical rotation of the magnetic field structure (which could directly link a jet to e.g. removal of angular momentum from an accretion flow) the more favoured interpretation is the formation of a shock inclined at some angle to the line of sight. The lack of the repeat of this phenomenon in 2001 March would seem to indicate it does not reflect physical rotation of the jet, which we would assume either always happens or never happens. However, more recently Gomez et al. (2001) have interpreted the steady rotation of the linear polarisation vector of a superluminal component in the jet of the AGN 3C120 as indicating an underlying twisted (helical) magnetic field structure.
5 Discussion
The origin of a circularly polarised component in the radio emission from AGN and X-ray binaries remains uncertain. However, in both classes of object the bulk of the radio emission can be confidently assumed to arise from similar physical processes, namely synchrotron emission from relativistic electrons in a magnetised plasma flowing away from the central black hole (or neutron star) in collimated jets. Since we have every reason to believe that the Stokes I, and probably Q and U, fluxes from these objects arise via the same processes, we can hope that by studying the origin of Stokes V in X-ray binaries we may shed light on its origin in AGN, and vice versa.
5.1 Association of CP with young ejections
What can we learn from these observations of GRS 1915+105 ? From analysis of the combined ATCA and MERLIN data sets for 2001 March, we are confident that the measured circularly polarised radio emission is associated with the relativistic ejection SE1. Our reasoning is as follows:
-
1.
The decreasing Stokes I flux measured at both epochs (most obviously 2001 March) arises from ejected components whose radio flux decays steadily, probably due to adiabatic expansion losses, with time. This can be inferred both from past experience and directly from the MERLIN observations which directly image the fading ejecta as they propagate away from the core. In Fig 5 we show the ATCA light curves, plus the total flux light curve from MERLIN and the fluxes of the two components (core and ejection SE1). The core stays at roughly the same flux level over all of the first five epochs of MERLIN imaging, whereas the flux of SE1 continues to fade – from this we can infer that the bright and decreasing flux observed by ATCA is dominated by emission from ejected component SE1.
-
2.
There is a significant correlation between the Stokes I and (-)Stokes V fluxes, especially at 8640 MHz. In table 2 we list the Spearman rank correlation coefficients between the Stokes I and V fluxes at 4800 and 8640 MHz, for both the 2001 January and March data sets; these are plotted in Fig 6. For all epochs, and the combined data sets, there is a significant rank correlation between Stokes I and V at 8640 MHz; at 4800 MHz the correlation is marginal. Since the Stokes I, as argued above, is associated with SE1, we can therefore be confident that the Stokes V flux also arises primarily in SE1. Note that we cannot rule out a Stokes V flux of amplitude mJy associated with the core, based on Fig 6.
-
3.
Furthermore, the MERLIN imaging clearly shows that the linearly polarised radio emission also arises in component SE1. Therefore we are able to accurately measure the fractional linear and circular polarisation (ie. all Stokes parameters) for the synchrotron emission from a single optically thin component
| 2001 January | 2001 March | Combined data sets | |||||||
|---|---|---|---|---|---|---|---|---|---|
| N | P | N | P | N | P | ||||
| 4800 MHz | 11 | -0.34 | % | 18 | -0.42 | % | 29 | -0.32 | % |
| 8640 MHz | 11 | -0.76 | % | 18 | -0.84 | % | 29 | -0.52 | % |

5.2 Comparison with AGN, Sgr A* and M81*
Rayner et al. (2000) and Homan et al. (2001) have established that most AGN have ratios of linear to (absolute) circular polarisation , whereas the low-luminosity radio cores Sgr A* and M81* have ratios (Bower et al. 1999; Sault & Macquart 1999; Brunthaler et al. 2001). It is interesting that for the two XRBs for which we have so far measured CP, we find both situations, depending on the frequency observed. In both SS 433 (Fender et al. 2000) and GRS 1915+105, LP CP at the lowest frequency (1.4 GHz), and LP CP at higher ( GHz) frequencies. In GRS 1915+105, it is clear from Figs 2,4 that there is significant opacity (foreground or internal) at the lower frequencies, and so we consider it most likely that the reduction in LP is due to Faraday depolarisation. While in SS 433 there is less obvious indication of opacity at the lowest frequencies, it would seem likely that the same mechanism is operating there to reduce the observed LP. Furthermore, M81* (Brunthaler et al. 2001) and a number of AGN (Rayner 2000) also seem to show flat/inverted fractional CP spectra, as we seem to have measured from GRS 1915+105 in 2001 January. However, we should also note that in Sgr A* there is no optically thin power law component, unlike the two X-ray binaries discussed here, which will further reduce the expected LP (Bower et al. 1999).
In addition, the majority of AGN are found to maintain the same sign of Stokes V on timescales from months to decades (Komesaroff et al. 1984; Rayner et al. 2000; Homan et al. 2001). Bower et al. (2002) have more recently shown that Sgr A* has maintained the same sign (and level) of CP over 20 years. In comparison, for X-ray binaries there are two observations of SS 433 separated by 10 days (Fender et al. 2000), and two observations of GRS 1915+105 separated by 65 days presented here; in both cases the sign remains the same. Of course the X-ray binary sample is extremely small, but should expand rapidly in the near future, with several events per year bright enough to mean CP at the % level (Fender & Kuulkers 2001). It is interesting to note that if accretion timescales scale linearly with mass from X-ray binaries to AGN (e.g. Sams, Eckart & Sunyaev 1996) then timescales of tens of days for SS 433 and GRS 1915+105 would correspond to timescales of thousands of years for Sgr A* and millions of years for some AGN – ie. we may have already probed longer in ‘accretion time’ than in all the studies of AGN to date !
5.3 Origins of the CP component
The CP spectrum detected from GRS 1915+105 is rather similar to that observed from SS 433 (Fender et al. 2000), being observed over a broad range (1–9 GHz) and with a decreasing Stokes V (although not necessarily V/I) spectrum. The broadband nature of the CP spectrum suggests that coherent emission mechanisms are unlikely. Furthermore, we do not consider the birefringent scintillation mechanism of Macquart & Melrose (2000) very likely either, since the CP component seems to be associated with a physical event in the source, yet because of the high velocities of the ejecta it is likely to be a large distance from the source during the periods in which we measured CP.
This leads us (once again) to consider one of two mechanisms most viable, an intrinsic CP component to the synchrotron emission or LPCP conversion (‘repolarisation’). Do we have any evidence in favour of either of these ? The intrinsic synchrotron mechanism should, naively, produce a well-defined V/I spectrum in a homogenous, optically thin, source. Our observations in 2001 March match these criteria quite closely (supported by direct imaging of a single ejection event with MERLIN), but unfortunately we only have a two-point CP spectrum at this epoch. In addition, the relatively low signal-to-noise ratio of the CP detections only allows us to constrain the (-V)/I spectral index to be . In 2001 January the situation is rather more complex, the mean flux and polarisation spectra certainly containing the contributions of multiple components with different optical depths. The data may suggest that the CP arises preferentially in ‘core’ components with the highest densities and optical depths, similar to the situation in AGN. This interpretation may favour instead the LPCP ‘repolarisation’ mechanism, which will operate most efficiently at higher optical depths, but currently the data are not sufficiently constraining.
However, both mechanisms require a significant population of low-energy electrons. In principle, a strong probe of this requirement could be obtained by measuring the low-frequency extent of radio emission during outbursts of GRS 1915+105 and other systems. Prompt observations at MHz frequencies could probe the electron distributions at Lorentz factors of 30 and lower (based on calculations in Fender et al. 1999) although, depending on the energy and magnetic field density in the ejecta, this emission may be self-absorbed. The consequences for the energetics of ejection events would be significant, especially in the case of a neutral baryonic plasma with one proton associated with each electron.
6 Conclusions
Following two high-frequency radio flares detected in our 15 GHz monitoring program, we have triggered sensitive observations with ATCA in order to measure the CP component from the jet source GRS 1915+105. On both epochs, 65 days apart, we have measured a varying CP component, with the same sign. At the first epoch we obtained a four-frequency spectrum, but lack of spatial information and clear variability, in particular at higher frequencies (presumably indicating generation of new components) precluded a confident determination of the CP spectrum.
At the second epoch, we have less CP coverage (only two frequencies instead of four) but the ATCA observations are complemented by high-spatial-resolution MERLIN imaging. From these MERLIN images we can be confident that the ATCA flux was dominated by the approaching component of a discrete ejection event, which was moving at a relativistic velocity. The fractional linear polarisation of this ejection is % at both frequencies, and the fractional circular polarisation is % at both frequencies. Furthermore, the Stokes I spectrum clearly indicates that the source was optically thin and probably decaying in flux due to adiabatic expansion losses (ie. there is no evidence of the spectral steepening which would occur as a result of radiative losses). These are therefore excellent data against which to test detailed models of synchrotron emission and plasma composition.
The data are consistent with production of the circularly polarised component in the earliest phases of new relativistic ejection events, as seen in AGN. The observations are not consistent with coherent emission mechanisms or the birefringent scintillation mechanism of Macquart & Melrose (2000), but are more likely to arise either directly from the synchrotron mechanism or by conversion of linear to circular polarisation in the emitting plasma. Both of these mechanisms imply a low-energy tail to the electron distribution which would have a significant impact on our estimates of the energy associated with such relativistic ejections. Our data may favour the LPCP conversion mechanism, but are not of sufficiently high quality to be conclusive. Note that Macquart (2002) reports the detection of circularly polarised radio emission from another X-ray binary jet source, GRO J1655-40, so this may well turn out to be a common feature and important diagnostic of the jets from X-ray binaries.
Finally, smoothly rotating 4800 and 8640 MHz electric vectors and correlated LP flux densities in Jan 2001 indicate a changing projection of the magnetic field, possibly indicating genuine rotation of the jet/field structure or the progressive formation of a shock in the outflow.
Acknowledgements
We would like to thank the referee, Heino Falcke, for useful comments. The Australia Telescope is funded by the Commonwealth of Australia for operation as a National Facility managed by CSIRO. MERLIN is operated as a National Facility by the Jodrell Bank Observatory of the University of Manchester, on behalf of the Particle Physics and Astronomy Research Council (PPARC). RXTE ASM results were provided by the ASM/RXTE teams at MIT and at the RXTE SOF and GOF at NASA’s GSFC. We thank the staff at MRAO for maintenance and operation of the Ryle Telescope, which is supported by the PPARC.
References
- [] Belloni T., Klein-Wolt M., Mendez M., van der Klis M., van Paradijs J., 2000, A&A, 355, 271
- [] Bower G.C., Falcke H., Backer D.C., 1999, ApJ, 523, L29
- [] Bower G.C., Falcke H., Sault R.J., Backer D.C. 2002, ApJ, in press (astro-ph/0202138)
- [] Brunthaler A., Bower G.C., Falcke H., Mellon R.R., 2001, ApJ, 560, L123
- [] Dhawan V., Goss W.M., Rodríguez L.F., 2000a, ApJ, 540, 863
- [] Dhawan V., Mirabel I.F., Rodríguez L.F., 2000b, ApJ, 543, 373
- [] Falcke H., Beckert T., Markoff S., Körding E., Bower G.C., Fender R., 2002, In ‘Lighthouses of the Universe: the most luminous celestial objects and their use for Cosmology’, Springer-Verlag, in press
- [] Fender R.P., 2001, MNRAS, 322, 31
- [] Fender R.P., Kuulkers E., 2001, MNRAS, 324, 923
- [] Fender R.P., Garrington S.T., McKay D.J., Muxlow T.W.B., Pooley G.G., Spencer R.E., Stirling A.M., Waltman E.B., 1999, MNRAS, 304, 865
- [] Fender R., Rayner D., Norris R., Sault R.J., Pooley G., 2000, ApJ, 530, L29
- [] Fender R.P., Rayner D., Trushkin S.A., O’Brien K., Sault R.J., Pooley G.G., Norris R.P., 2002, MNRAS, 330, 212
- [] Frater R.H., Brooks J.W., Whiteoak J.B., 1992, Journal of Electrical and Electronics Engineering, Australia, 12, 2
- [] Gomez J-L., Marscher A.P., Alberdi A., Jorstad S.G., Aguda I., 2001, ApJ, in press (astro-ph/0110133)
- [] Homan D.C., Attridge J.M., Wardle J.F.C., 2001, ApJ, 556, 113
- [] Jones T.W., O’Dell S.L., 1977, ApJ, 215, 236
- [] Kennett M., Melrose D., 1998, PASAu, 15, 211
- [] Klein-Wolt M., Fender R., Pooley G.G., Belloni T., Migliari S., Morgan E.H., van der Klis M., 2002, MNRAS, 331, 745
- [] Komesaroff M.M., Roberts J.A., Milne D.K., Rayner P.T., Cooke D.J., 1983, MNRAS, 028, 409
- [] Kotani T. et al., 1994, PASJ, 46, L14
- [] Legg M.P.C., Westfold K.C., 1968, ApJ, 154, 499
- [] Levine A.M., Bradt H., Cui W., Jernigan J.G., Morgan E.H., Remillard R.A., Shirey R., Smith D., 1996, ApJ, 469, L33
- [] Macquart J.-P., 2002, PASA, in press (astro-ph/0111302)
- [] Macquart J.-P., Melrose D.B., 2000, ApJ, 545, 798
- [] Macquart J.-P., Kedziora-Chudczer L., Rayner D.P., Jauncey D.L., 2000, ApJ, 538, 623
- [] Margon B., 1984, ARA&A, 22, 507
- [] Mirabel, I.F., Rodríguez, L.F., 1994, Nature, 371, 46
- [] Mirabel, I.F., Rodríguez, L.F., 1999, ARA&A, 37, 409
- [] Pacholczyk A.G., 1973, MNRAS, 163, 29
- [] Pooley G.G., Fender R.P., 1997, MNRAS, 292, 925
- [] Rayner D.P., PhD thesis, University of Tasmania, 2000
- [] Rayner D.P., Norris, R.P., Sault, R.J., 2000, 319, 484
- [] Saikia D.J., Salter C.J., 1988, ARA&A, 26, 93
- [] Sams B., Eckart A., Sunyaev R., 1996a, Nature, 382, 47
- [] Sault R.J., Macquart J.-P., 1999, ApJ, 526, L85
- [] Sault R.J., Killeen N.E.B. & Kesteven, M.J. 1991, AT Polarization Calibration, Tech. Rep. 39.3015, Australia Telescope National Facility
- [] Thomasson P., 1986. QJRAS, 27,413
- [] Wardle J.F.C., Homan D.C., 2002, In ‘Particles and fields in Radio Galaxies’, ASP conf. series, R.A. Laing and K.M. Blundell (Eds), in press (astro-ph/0011515)
- [] Wardle J.F.C., Homan D.C., Ojha R., Roberts D.H., 1998, Nature, 395, 457