Searching for the Physical Drivers of Eigenvector 1:
From Quasars to Nano-Quasars
Abstract
We point out an analogy between two accreting white dwarfs with jets (CH Cyg and MWC 560) and powerful quasars. In spite of the enormous difference in the mass of the central object (a factor 107), the emission lines are strikingly similar to those of I Zw 1 (the prototype “Narrow Line Seyfert 1” nucleus whose spectrum is widely used as an FeII template for almost all quasars). The spectral similarity give us the unique possibility to consider the optical Eigenvector 1 diagram using objects less massive by a factor of millions. Our results reinforce the interpretation of the “Eigenvector 1 correlations” found for low redshift quasars as driven mainly by the source luminosity to central compact object mass ratio(L/M). The accreting white dwarfs CH Cyg and MWC 560, their jets and emission lines, may well represent the low energy, non relativistic end of the accretion phenomena, which encompass the most powerful quasars and the microquasars. The remarkable similarities suggest that they may be legitimately considered “nano-quasars”.
1 Introduction
The accretion processes have a lot of similarities in spite of the differences in the type and the mass of the accreting object. In the last years a few microquasar sources have been discovered. They are galactic X-ray binaries in which a black hole (BH) or neutron star is accreting from the companion star, producing jets and even superluminal motion (Mirabel & Rodriguez, 1999). The accreting stellar mass compact objects give us a tool to investigate phenomena in active galactic nuclei (AGN) at much lower energy and much shorter time scale.
The aim of this letter is to show striking similarities between the emission lines of two accreting white dwarfs and the emission lines coming from the broad line region of the active galactic nuclei (AGN), in spite of the mass difference (a typical BH in AGN has a mass 106–109 and the white dwarf in the interacting binaries 1). A comparison between such different objects can give us a better understanding of the accretion/ejection phenomenology, as well as of the so called “Eigenvector 1 correlations” that seem to be fundamental for AGN interpretation. We think it is appropriate to call these two accreting white dwarfs of this paper “nano-quasars” because they seem to represent the very low energy analog of quasars and microquasars.
2 Emission lines similarities
CH Cyg and MWC 560 are interacting binary stars in which a white dwarf accretes matter from the wind of a red giant. Their spectra and the spectrum of I Zw 1 are plotted in Fig.1. I Zw 1 is a “Narrow-Line” Seyfert 1 (NLSy1) nucleus, well known because of his strong Feii emission and relatively narrow lines (FWHM1000 km s-1), widely used as template for subtraction of the FeII complex in the H - H region of quasar spectra. In the upper panel of Fig. 1 we show the spectral region 4200–4900 Å, and in the middle panel the UV region. The optical spectrum of I Zw 1 was obtained at the 1.52m ESO telescope at La Silla, and the UV was retrieved from the Hubble (HST) archive. The optical spectrum of MWC 560 is the average of the FEROS public archive spectra observed in the period November - December 1998 at ESO (Kaufer et 1999, Schmid 2001). Both optical and UV spectra of CH Cyg were obtained in 1984, when the star underwent jet activity. The optical spectrum of CH Cyg is from the plate archive of the Bulgarian National Astronomical Observatory “Rozhen” (observed on 10 July 1984). The UV spectrum have been retrieved from the International Ultraviolet Explorer database (observed on 23 Jan 1985).
A clear similarity between the emission lines can be seen in Fig.1. Practically almost every emission line visible in the spectrum of I Zw 1 has corresponding features in the spectra of CH Cyg and MWC 560. An obvious similarity is visible also between the UV spectrum of CH Cyg and the one of I Zw 1. We note in passing that similar emission lines are also visible in the spectrum of XX Oph (Kolev & Tomov 1993), where the accreting object is probably a main sequence star (Evans et al. 1993). Despite the general similarity some differences are visible as well. In MWC 560 these are the absorption components in the Balmer lines. These absorptions are due to the jet coinciding with the line of sight (Tomov et al. 1990). They are also dominating the UV spectrum of MWC 560 (not shown here) making it quite different from the ones of CH Cyg and I Zw 1. In the optical spectrum of CH Cyg numerous absorptions due to the photosphere around the white dwarf are visible.
In Fig.1 (lower panel) the optical emission line spectra of MWC 560 and CH Cyg are shown after having been continuum subtracted, scaled and broadened. This standard procedure is widely used for the emission line measurements of AGN, using I Zw 1 itself as a template. After this processing, good identity is achieved with the spectrum of I Zw 1. Our best fit corresponds to a width FWHM(FeIIopt)97090 km s-1.
The hydrogen emission lines as well as the FeII emissions of AGN are emitted from the so-called broad line region (BLR). This region is thought to be within 1 pc from the central BH. Its structure is poorly understood as yet. The clear similarity between the emission lines means that, in objects like MWC 560 and CH Cyg, we are observing a scaled down version of the quasar BLR.
It worth noting that the interacting binaries, in which a white dwarf accretes material from the wind of a red giant (usually classified as symbiotic stars) are strongly variable objects. For CH Cyg and MWC 560 we show that their spectra are similar to low-redshift quasars in moments when jet activity has been detected (see §4).
3 The Eigenvector-1 Diagram
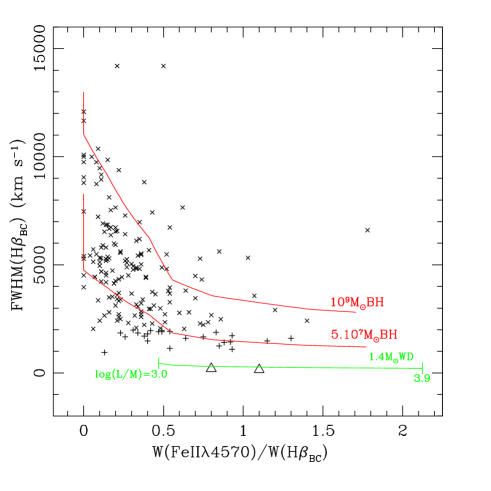
During the last decade, several investigations of AGN emission lines emphasized the importance of a set of correlations conventionally called “Eigenvector-1” (hereafter E1) and related to principal component analysis of the properties of PG quasars Boroson & Green (1992). In the most important diagram associated to E1 (Sulentic 2000), the X-axis is the ratio between the equivalent width of the FeII complex in the range 4434–4684 Å and the equivalent width of the H broad component (H), namely R W(FeII)/W(H). The Y-axis is the FWHM of H. We measured for CH Cyg W(FeII)=4.5Å, W(H)=5Å, and FWHM(H)=200 km s-1; and for MWC 560 W(FeII)=34Å, W(H)=31Å, and FWHM(H)=110 km s-1.
The diagram is shown in Fig. 2. The left panel includes the AGN sample (marked with and ) of Sulentic et al. (2002). The position of MWC 560 and CH Cyg is marked with open triangles. As could be expected, they are located outside of the AGN population, but close to the NLSy1 galaxies (marked with ), which are supposed to have systematically lower BH masses. The diagram of Fig.2 is believed to play for AGN role similar to the one of Hertzsprung-Russell diagram for stars (Sulentic 2001). The physical drivers can be L/M ratio convolved with orientation (Marziani et al. 2001), or L/LEdd ( L/M) and BH mass (Boroson 2002). Here we want to use the “nano-quasars” to understand better this correlation space. The ”nano-quasars” give us the unique possibility to consider the effect of L/M along with that of varying the mass seven-eight orders of magnitude.
The reverberation mapping studies of the AGN (Kaspi et al 2001) give the following dependence of FWHM(H) on mass and L/M:
| (1) |
where is the luminosity-to-mass ratio in solar units, with the solar value (L/M)⊙=1.92 ergs s-1g-1.
The distance of the BLR from the central continuum source is found to depend on bolometric luminosity L:
| (2) |
The ionization parameter can be defined as:
| (3) |
where , is the number of the hydrogen-ionizing photons, is the distance of the broad line region from the central continuum source, is the fraction of ionizing photons, the average frequency of the ionizing photons, and the electron density. The appearance of the same lines in quasars and in symbiotic stars means that the density in the line emitting region should be similar. A relation connecting and the (L/M)-ratio is (Marziani et al. 2001):
| (4) |
Combining the above equations we obtain:
| (5) |
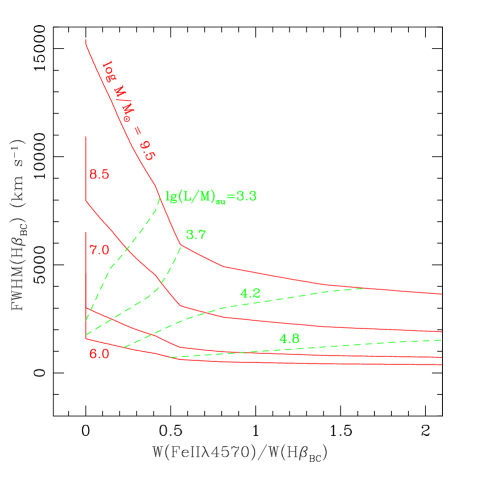
A typical AGN continuum (Laor et al. 1997) yields 1.221016 Hz and 0.39. We can then calculate RFeII following Marziani et al. (2001). On the right panel of 2 are shown theoretical lines covering the range of masses expected for AGN, (M/M⊙) 6 – 9.5.
In symbiotic and symbiotic-like stars the ionizing photons are coming from accreting white dwarf, which effective temperature could be in the range from 6000 K up to 200 000 K (Mürset & Nussbaumer 1994). In CH Cyg and MWC 560 the UV continuum shape indicates a region of extremely large column density (“cocoon”) that obscures the inner disk and the hot white dwarf surface (Michalitsianos et al. 1993). The UV continuum fitting of CH Cyg during the active phase indicate temperature Teff=8500 – 15000 K and temperature is the lowest at the maximum of brightness(Mikolajewska et al. 1988). Because the jet ejection is at the maximum, we will adopt Teff=8500 K corresponding to and Hz. For MWC 560 there are also no signs for temperature hotter than 15000 (Shore et al. 1994), and even the column density of the absorbing material is higher than in CH Cyg (Michalitsianos et al. 1993).
The resulting FWHM(H) vs. RFeII is plotted in Fig. 2. On the left panel the lines are for masses M , M , and white dwarf mass M . We adopted and following the above considerations. The ratio was running in the limits log(2.5 – 4.4 for M, log(2.5 – 4.9 for M, and log(3.0-3.9 for M.
The total luminosity of the white dwarf of CH Cyg during the time of jet ejection in 1984 is L1600 L⊙ (Mikolajewska et al 1988) and that of MWC 560 is L1000 L⊙ (Schmid et al. 2001). Assuming a typical white dwarf mass in symbiotic stars of M(or total mass of the binary system about 3-5), we obtain 103 in agreement with parameters used to plot the lowest line in Fig. 2 (left panel).
If we use higher effective temperature for the ionizing continuum (i.e. T corresponding to and Hz) to have reasonable results from Eq.5 we need to go to stronger dependence like to with up to 0.67 (more details are given in Marziani et al. 2001). This points out that the number of ionizing photons and the shape of the UV and X-ray continuum are important in the E1 correlations. It is worth noting that the soft X-ray photon index is the third axis in E1 diagrams of Sulentic et al. (2000, 2001). The line widths, FWHM(H)100 km s-1 for MWC 560 and FWHM200 km s-1 for CH Cyg, are a little bit smaller than expected from Eq. 1, which predicts values around 300-400 km s-1. It is also possible that the luminosity of CH Cyg and MWC 560 was lower (i.e. 100-500 L⊙) at the time the spectra were obtained, if the distances used in the calculations are too large. We regard the agreement acceptable, considering the huge difference in masses and the limited range of luminosity and masses from which the relationships of Kaspi et al. (2000) and Marziani et al. (2001) were derived. The white dwarfs have lower efficiency of accretion () than expected for typical AGN (). The used equations give good results without considering the effect of efficiency. This is in agreement with the interpretation of the E1 as mainly driven by L/M ratio. Efficiency, along with several other parameters, may have some (minor) influence.
Following the above equations and Fig. 2, a change in mass by a factor 107 times changes FWHM(H) by a factor 10 – 50. A change in mass by a factor 50 (from to 5 , in the range expected for BH masses of low redshift quasars) leads to a FWHM(H) change by a factor 2-3. In a sample of quasars with a limited BH mass spread, mass change may lead to second order effect which may even be smaller than the the effect of orientation (Marziani et al. 2001).
4 Jets
Jets are detected in systems quite different from the ones harboring black holes (for a review see Livio, 2001): young stellar objects, planetary nebulae, supersoft X-ray sources. The jets of MWC 560 and CH Cyg, as well as other non-relativistic jets, are visible in atomic spectral lines. Among the relativistic jets only in SS 433 are atomic lines visible (Fender 2001). The jet velocities observed in the accreting white dwarfs we call “nanoquasars” are 1000 km s-1 in CH Cyg (Taylor et al. 1986) and 10006000 km s-1 in MWC 560. These velocities are much slower than the jet velocities in microquasars: 0.26c in SS 433 (Margon 1984), 0.5c in Cyg X-3 (Martí et al., 2001), and 0.9c in GRS 1915+105 (Mirabel & Rodriguez 1999). However, they are consistent with an overall picture in which the jet velocity is of the order of the escape velocity (Livio 2001). A rough estimation is vesc(WD).
The compact object luminosity of MWC 560 and CH Cyg is considerably less than the Eddington limit . At such accretion luminosity the most probable jet energy source is extraction of rotational energy from the compact object. In the cases of “nano-quasars” the extraction is probably going on via the propeller action of a magnetic white dwarf (Mikolajewski et al. 1996). The most probable source of jet formation in quasars is the extraction of energy and angular momentum via the Blandford & Znajek (1977) mechanism. In this sense the jets in the “nano-quasars” represent probably a low energy (non-relativistic) analog of the jets of quasars and microquasars, having a similar energy source – the extraction of rotational energy from the central compact object.
5 Conclusions
We showed a clear similarity between the emission line spectra of the accreting white dwarfs CH Cyg and MWC 560 and low redshift quasars. Their jets may be have a similar energy source - the rotational energy of the central object. The discussed similarities have been used in this paper to aid the interpretation of the E1 diagrams for AGN. Their position in the diagram confirms the interpretation that the physical driver of the Boroson & Green’s E1 is primarily the L/M ratio, and that the mass of the accreting object also plays a role. We could call the accreting white dwarfs with jets and with AGN-like spectra “nano-quasars”, by analogy with the quasar and microquasar denomination (also, in ancient Greek means dwarf).
In the future, the spectral similarity discussed here could be used to better understand the conditions and the structure of the BLR of quasars, and to identify numerous emission lines in the spectrum of I Zw 1 (and by extension, of the wide majority of AGN that show a Feii spectrum almost identical to the one of I Zw 1). The FWHM of emission lines in AGN is 1000, which makes most Feii lines blended together. In accreting white dwarfs the FWHM is a factor of ten less, making possible to identify weak lines. The diversity of symbiotic binaries properties could be used to test and to “calibrate” AGN correlations, using objects with well known mass. It will be very useful to detect a stellar mass black hole (i.e., a galactic micro-quasar) with similar emission lines. Discovery of an interacting binary in which a black hole accretes from the wind of a red giant will be extremely interesting, although very difficult to find from an evolutionary point of view.
Ultimately, the nano-quasars could be an important chain link in our understanding of all accreting sources. They could help us to create an unified picture of all accreting objects from cataclysmic variables and stellar-mass black holes up to the most powerful quasars.
References
- (1) Blandford R., & Znajek R., 1977, MNRAS 179, 433
- (2) Boroson T.A., Green R.F., 1992, ApJS 80, 109
- (3) Boroson T., 2002, ApJ 565, 78
- (4) Fender R., 2001, ApSSS 276, 69
- (5) Evans A., Albinson J.S., Barrett P., 1993, A&A 267, 161
- (6) Kaspi S., Smith P.S., Netzer H., Maoz D., Jannuzi B.T., Giveon U., 2000, ApJ 533, 631
- (7) Kaufer A., Stahl O., Tubbesing S., 1999, The ESO Messenger 95, 8
- (8) Kolev D., Tomov T., 1993, A&AS 100, 1
- (9) Laor A. Fiore F., Elvis M., Wilkes B.J., McDowell J.C., 1997, ApJ 477, 93
- (10) Livio M., 2001, in Probing the Physics of Active Galactic Nuclei, eds. B. Peterson, R. Pogge, & R. Polidan, San Francisco, ASP Conf. v.224, p.225
- (11) Margon B., 1984, ARA&A 22, 507
- (12) Marti J., Paredes J.M., Peracaula M., 2001, A&A 375, 476
- (13) Marziani P., Sulentic J.W., Zwitter T., Dultzin-Hacyan D., Calvani M., 2001, ApJ 558, 553 2001, A&A 375, 476
- (14) Michalitsianos A.G., et al., 1993, ApJ 409, 53
- (15) Mirabel I.F., Rodriguez L.F., 1994, Nature 371, 46
- (16) Mirabel I.F., Rodriguez L.F., 1999, ARA&A 37, 409
- (17) Mikolajewska J., Selvelli P.L., Hack M., 1988, A&A 198, 150
- (18) Mikolajewski M., Milkolajewska J., Tomov T., 1996, in Compact stars in binaries, IAU Symp 165, eds. J.van Paradijs, E.P.J. van den Heuvel, E.Kuulkers, Kluwer, Dordrecht, p.451
- (19) Mürset U., Nussbaumer H., 1994, A&A 282, 586
- (20) Sulentic J.W., Marziani P., Dultzin-Hacyan D., 2000, AR A&A 38, 521
- (21) Sulentic J.W., Calvani M., Marziani P. 2001, ESO Messanger 104, 25
- (22) Schmid H.M., Kaufer A., Camenzind M., Rivinius Th., 2001 A&A 377, 206
- (23) Shore S.N., Aufdenberg J.P., Michalitsianos A.G., 1994, AJ 108, 671
- (24) Taylor A.R., Seaquist E.R., Mattei J.A., 1986, Nature 319, 38
- (25) Tomov T., Kolev D., Georgiev L., Zamanov R., Antov A., Bellas Y., 1990, Nature 346, 637
- (26) Tomov T., Zamanov R., Kolev D., Georgiev L., Antov A., Mikolajewski M., Esipov V., 1992, MNRAS 258, 23