CTI History of the EPIC pn Camera
Abstract
The pn camera of EPIC is inherently robust against radiation damage effects. Nevertheless, the knowledge of charge transfer inefficiency (CTI) of the pn camera is crucial for obtaining the correct energy scale. We describe detailed in–orbit monitoring of this effect, utilizing the internal calibration source. We find that during the first two years in orbit the CTI increased by for Al–Kα and by for Mn–Kα. The increases in the CTI are well within expectations, with no measurable effect on the energy resolution.
keywords:
Missions: XMM-Newton – EPIC pn – energy calibration – charge transfer inefficiency (CTI) – radiation damage
1 Introduction
In CCDs electrons of the signal charge generated by an absorbed X–ray photon are lost during transfer to the readout node by traps in the transfer channel. The number of traps is expected to increase with time due to radiation damage. As the knowledge of the charge loss is essential for extracting quantitative spectral information, the performance of the EPIC pn camera is routinely monitored with an internal calibration source. This source consists of radioactive Fe55 with an Al–target, and irradiates the detector with Al–Kα and Mn–Kα emission lines at 1.5 and 5.9 keV. This is usually done for about one hour at the beginning of each 48 hour revolution of XMM–Newton. The line positions determined from these exposures are a sensitive indicator for any change in the energy response.
2 Ground calibration
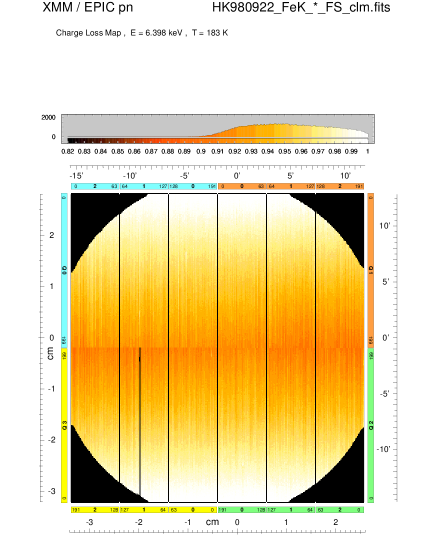
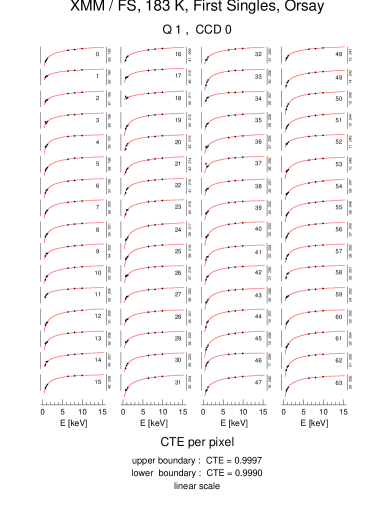
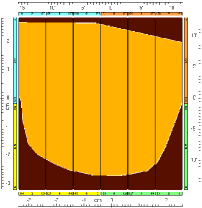
The importance of the CTI for the energy calibration of the EPIC pn camera was realized long before launch, and a lot of experience was gained during extensive laboratory measurements with different detectors at different temperatures and energies. We developed specific software tools for the CTI analysis of such calibration data, which allow us to determine the charge loss across the 768 readout channels with high spatial resolution. Fig. 1 illustrates the method. Results from laboratory measurements for the detector now onboard XMM–Newton are shown in Figs. 2 and 3. More about the energy calibration before launch can be found in [*]kdennerl-WA2:den99. Here we report on recent results obtained from monitoring the CTI in orbit.

3 CTI monitoring in orbit
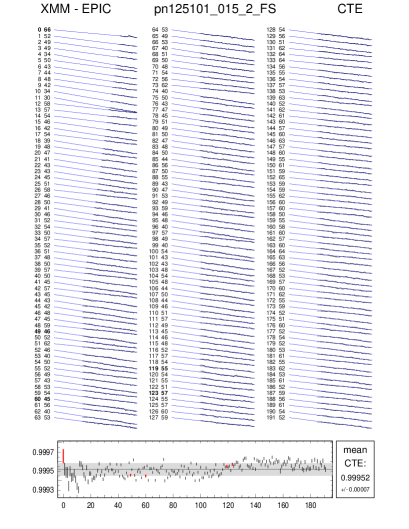
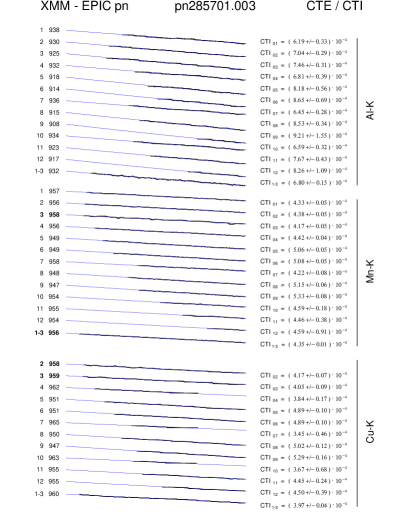
The number of photons obtained during the calibration measurements in orbit is not sufficient for the determination of the charge loss for individual columns. However, during six revolutions (# 23, 80, 125, 172, 242, and 332) long measurements were made with exposures of 13 up to 21 hours duration, where the statistical quality is comparable to laboratory measurements. Fig. 4 shows the charge losses determined from rev. 125, and Fig. 7 in Briel et al. (2002, these proceedings) summarizes the CTI history for CCDs 1, 2, and 3 (quadrant 0), derived from the six measurements.
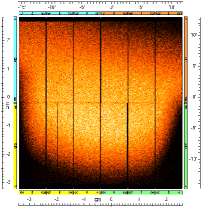
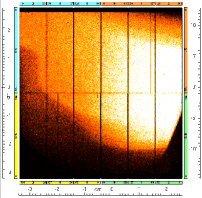
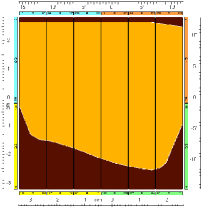
In order to extend the CTI analysis to the shorter exposures, we modified our technique in the following way: we combined events, with the same distance from the readout node, from several readout columns, after having corrected their raw amplitudes for the gain of the particular column. As the irradiation is not homogeneous across the detector (Figs. 5 and 6), we selected only events from the better exposed areas, which are less contaminated by out–of–time events. The spectra of such ‘macro columns’ were then analysed in the same way as those of individual columns (cf. Fig. 1). Fig. 7 illustrates the accuracy which can be reached with this method.
4 Results
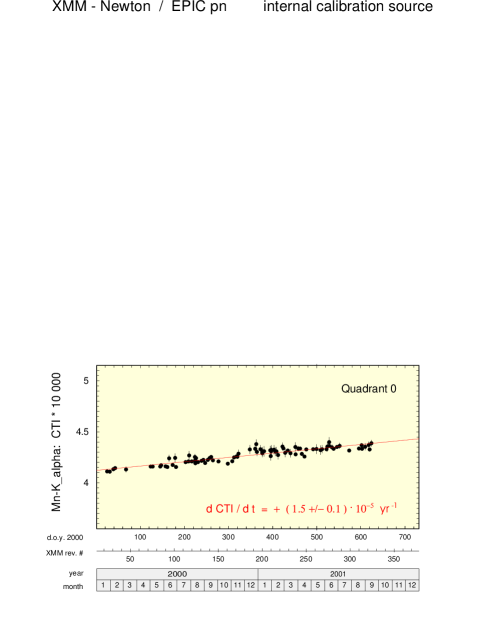
Fig. 8 summarizes the CTI results for Al–Kα and Mn–Kα obtained for quadrant 0, which receives relatively homogeneous irradiation (Figs. 5, 6). We find the CTI at Al–Kα and Mn–Kα to increase slowly with time, with a rate of for both energies.
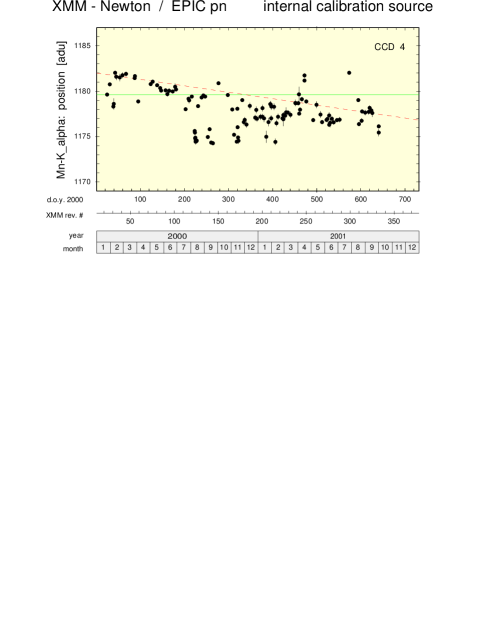
This is in contrast to the considerable scatter seen in the Mn–Kα line positions, which result when we apply the same CTI correction to the calibration data (Fig. 9). We found that the short–term drops of the line position were not caused by CTI changes, but by changes in the amplification, which were the consequence of temperature variations in the electronic boxes. The drops in the line position show a clear correlation with the temperature and can thus be well corrected. Short–term rises of the line position, on the other hand, were found to be correlated with periods when the background radiation was so high that no astrophysical observations could be performed. Despite all the scatter, however, Fig. 9 shows evidence for a long–term decrease of the line position, which is indeed caused by the increase of the CTI.
How does the CTI increase seen during the first two years in space compare with pre–launch predictions ? For Mn– we measure a long-term trend of
Before launch, laboratory measurements, taken at , the operating temperature of the EPIC pn camera in orbit, showed the following response of the CTI to a 10 MeV proton equivalent flux for Mn–Kα ([\astronciteMeidinger et al.1998]):
For , an average value of was expected, yielding
at Mn–Kα. Thus, the measured value is even somewhat lower than this estimate.
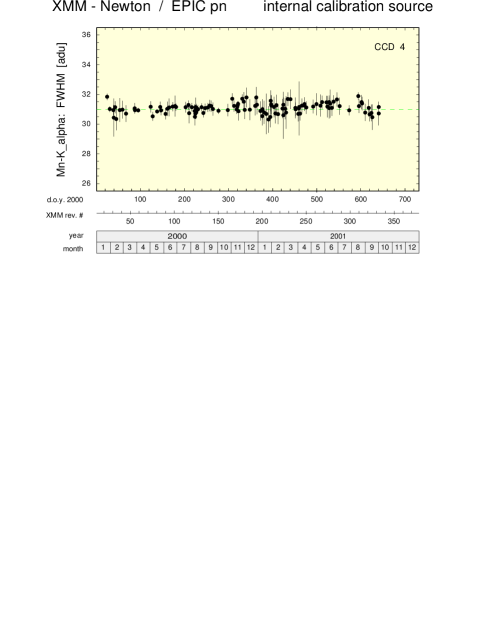
The additional noise created by the small relative increase of the CTI is almost negligible and should not have measurable consequences for the energy resolution. In fact, no significant increase of the width of the Mn–Kα line was observed over the first two years (Fig. 10).

5 Summary and conclusions
From routine measurements with the internal calibration source, the CTI of the EPIC pn camera was found to increase by
and by
This corresponds to a relative increase of the CTI by for Al–Kα and by for Mn–Kα during the first two years in orbit, with no measurable effect on the energy resolution. If this trend continued, then it would take more than 25 years until the CTI at Mn–Kα would have doubled. At Al–Kα, the CTI would then have increased by about half of its present value.
Acknowledgements.
The XMM–Newton project is an ESA Science Mission with instruments and contributions directly funded by ESA Member States and the USA (NASA). The XMM–Newton project is supported by the Bundesministerium für Bildung und Forschung / Deutsches Zentrum für Luft- und Raumfahrt (BMBF / DLR), the Max–Planck–Gesellschaft and the Heidenhain–Stiftung.References
- [\astronciteBriel et al.2002] Briel, U.G., Dennerl, K., Freyberg, M.J., et al. 2002, these proceedings
- [\astronciteDennerl et al.1999] Dennerl, K., Briel, U.G., Haberl, F., et al. 1999, SPIE, 3765, 232
- [\astronciteMeidinger et al.1998] Meidinger, N., Schmalhofer, B., Strüder, L., 1998, IEEE Trans. on Nucl. Sci, 45, 2849