High-Resolution X-ray Imaging of the Colliding Wind Shock in WR 147
We analyze new high-resolution Chandra X-ray images of the Wolf-Rayet binary system WR147. This system contains a WN8 star with an early-type companion located 0.6” to its north, and is the only known early-type binary with a separation on the sky large enough for the wind-wind collision between the stars to currently be resolved at X-ray energies. The 5 ksec Chandra HRC-I image provides the first direct evidence for spatially extended X-ray emission in an early-type binary system. The X-ray emission peaks close to the position of the radio bow shock and north of the WN8 star. A deeper X-ray image is needed to accurately determine the degree of spatial extension, to exactly align the X-ray and optical/radio frames, and to determine whether part of the detected X-ray emission arises in the individual stellar winds. Simulated X-ray images of the wind-wind collision have a FWHM consistent with the data, and maximum likelihood fits suggest that a deeper observation may also constrain the inclination and wind momentum ratio of this system. However, as the WR wind dominates the colliding wind X-ray emission it appears unlikely that and can be separately determined from X-ray observations. We also note an inconsistency between numerical and analytical estimates of the X-ray luminosity ratio of the stronger and weaker wind components, and conclude that the analytical results are in error.
Key Words.:
stars:binaries:general – stars:early-type – stars:imaging – stars:individual:WR 147 – stars:Wolf-Rayet – X-rays:stars1 Introduction
Massive, early-type binaries with powerful stellar winds can generate a complex region of shock-heated plasma with temperatures in excess of K when these winds collide (Prilutskii & Usov PU1976 (1976); Cherepashchuk C1976 (1976)). X-ray observations provide a direct probe of the conditions within the collision zone and also of the unshocked attenuating material along the line of sight in the system (e.g. Stevens et al. SBP1992 (1992); Pollock et al. Po1999 (1999); Pittard & Stevens PS1997 (1997)). Single early-type and Wolf-Rayet (WR) stars are also known to be X-ray emitters. The most viable model currently proposed is that the K X-rays are generated by shocks in the wind resulting from the unstable nature of the line-driven acceleration (e.g. Owocki et al. OCR1988 (1988); Feldmeier et al. FPP1997 (1997)). Direct spectroscopic evidence of clumps/shocks in WR winds was first noted by Moffat et al. (MDLR1988 (1988)).
Emission from colliding winds is often observable as a strong high-temperature X-ray excess above that expected from the individual stars, together with phase-locked orbital variability resulting from the changing line of sight into the system (e.g. Pollock Po1987 (1987); Chlebowski C1989 (1989); Williams et al. W1990 (1990); Chlebowski & Garmany CG1991 (1991); Corcoran C1996 (1996)). Recent Chandra observations have revealed spectral features which are noticeably different to those from single early-type stars, including strong forbidden line emission (Corcoran et al. CISP2001 (2001); Pollock et al. Po2002 (2002); Skinner et al. SGSS2001 (2001)). In all previous X-ray observations, the colliding wind emission has remained spatially unresolved, and contaminated by the emission from the individual winds.
Non-thermal radio emission from WR stars is also a good indicator of wind-wind interaction (e.g. Dougherty & Williams DW2000 (2000)). Such emission is thought to be synchrotron radiation arising from electrons accelerated to relativistic velocities in the wind-wind collision zone (Eichler & Usov EU1993 (1993)). The presence of nonthermal radio emission from WR 147 (AS 431) was reported by Caillault et al. (C1985 (1985)) and Abbott et al. (ABCT1986 (1986)). Later observations with MERLIN at 5 GHz resolved two radio sources (WR 147S and WR 147N) separated by ″(Moran et al. M1989 (1989)). The southern thermal source (WR 147S) was coincident with the WR star, and the northern source (WR 147N) was proposed to be responsible for the observed nonthermal emission. Independent observations with the VLA confirmed this hypothesis (Churchwell et al. C1992 (1992); Skinner et al. SINZ1999 (1999)). Moran et al. (M1989 (1989)) further suggested that WR 147 could have an unseen companion associated with the northern radio source.
WR 147 attracted the attention of many astronomers when radio, infrared and optical observations at high spatial resolution provided unambiguous evidence of its binarity (Williams et al. W1997 (1997), hereafter W97; Niemela et al. N1998 (1998), hereafter N98). New, higher resolution MERLIN observations by W97 revealed that at 5 GHz both sources are elongated with sizes of mas (WR 147S) and mas (WR 147N), and that they had a separation of mas. The UKIRT infrared and HST optical images revealed for the first time a faint companion star located to the north of the nonthermal source associated with WR 147N. Crucially, the relative positions of the sources revealed that the companion star, although close to the nonthermal radio emission, was located slightly ( 60 mas) more distant from the WR star. The resulting picture is thus consistent with the nonthermal emission arising in a colliding winds shock between the two stars, with the wind of the WN8 star dominating.
The spectral type of the companion is currently somewhat uncertain, as the excessive reddening towards this object ( mag; Churchwell et al. C1992 (1992)) makes it hard to get a (blue) classification spectrum. Based on ram pressure arguments, a companion with a late-O or early-B spectral type is expected to have a sufficiently strong stellar wind to produce the bow-shock at its observed position111The latest attempt (Lepine et al. L2001 (2001)) based on STIS/HST resolved spectra yields an O5-7I(f) type, which seems a little luminous for the observed magnitude difference.. Although the mass-loss rate and wind velocity are not known for the OB star, the wind momentum ratio can be directly determined from the geometry, specifically by comparison of the position of the nonthermal source with those of the stars (i.e. the ratio , cf. Usov U1992 (1992)). Estimates for the wind momentum ratio,
| (1) |
range from (W97) to (N98). This value can then be used to estimate the wind momentum of the OB star if we know that of the WN star (see Section 3.1). The inclination angle can also be estimated from the observed geometry: W97 deduced , and Contreras & Rodríguez (CR1999 (1999), hereafter CR99) determined from VLA observations.
With WR 147 revealed as a colliding winds source it was expected that most of the X-ray emission could be from the wind-wind collision. A recent observation with ASCA (Skinner et al. SINZ1999 (1999)) determined the emission to be thermal (although multi-temperature) with the dominant component at keV. This is slightly harder than the characteristic temperature from single early-type stars ( keV). A high absorption column () in agreement with estimates based on the visual extinction was also confirmed. The intrinsic luminosity in the keV band was estimated as , which gives , 0.5 dex greater than the canonical value of from single early-type stars.
WR 147 is the second closest WR star ( pc; Morris et al. M2000 (2000)) and one of a small number of WR systems where the companion stars have been spatially resolved (other examples being WR 86 and WR 146 - N98). Of these, only WR 147 has a sufficiently great separation between the stars for us to attempt to spatially resolve the wind-wind interaction region at X-ray energies. This in turn is currently only possible with the recently launched Chandra X-ray Observatory, which combines a superb mirror with sub-arcsecond resolution (van Speybroeck et al. vS1997 (1997)) and accurate, stable pointing. In this paper we report on the analysis of a 5 ksec observation of WR 147 with the High Resolution Camera (HRC-I).
| Source | RA (J2000) | Dec (J2000) | Net counts |
|---|---|---|---|
| WR 147 | |||
| Source 2 |
2 HRC-I Analysis
Chandra (Weisskopf et al. WOvS1996 (1996)) observed WR 147 with the HRC-I instrument (Murray et al. M1997 (1997)) on 2000 July 10 12:11 UT to 14:09 UT for a total exposure time of 4.87 ksec. The HRC-I is a microchannel plate imager with excellent spatial and temporal resolution but poor energy resolution. Each photon detected by the HRC-I is time and position tagged. The size of the electronic readout is (″, referred to as ‘one pixel’) which oversamples the point-spread-function (PSF). All Chandra data which have undergone reprocessing have benefited from improvements made to the crossed-grid charge detector signals. This has reduced the 50 per cent encircled energy radius from 4.0 to 3.2 pixels (0.527″ to 0.422″; Juda et al. J2000 (2000)). Softer photons are brought to a slightly tighter focus than harder energies. Our analysis is based on the pipeline processed data from the Rev1 Chandra X-ray Center (CXC) reprocessing.
The CXC has measured the on-orbit performance of the Pointing Control and Aspect Determination (PCAD) system on Chandra (see Sec. 5.4 and Table 5.1 of the Proposer’s Observatory Guide, hereafter POG), and determined that the standard processing is capable of placing a reconstructed X-ray image on the celestial sphere to an accuracy of ″(RMS) radius. The image was dithered during the observation and these effects were removed during post-processing. We also checked that pointing transients had damped out by the time that the actual observation began, and that the pointing remained stable during the observation.
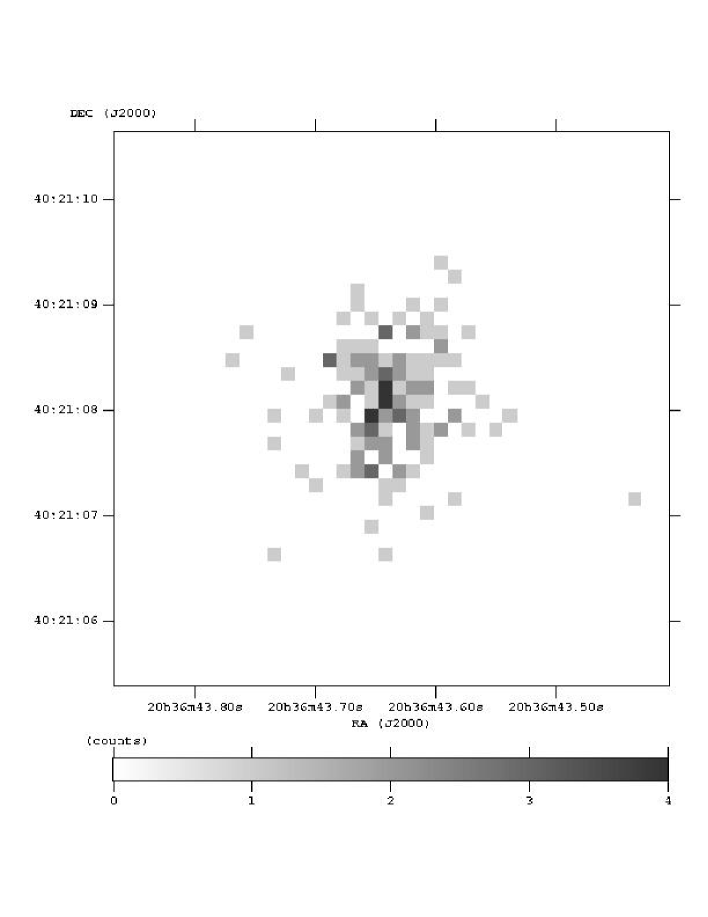
A total of 115420 events were noted after the standard level 2 processing, which yields a count rate across the entire detector of . This implies a background rate of slightly less than . We therefore expect only 1 background count within the source area of WR 147 shown in Fig. 1. Running the source detection software yielded one reliable source in addition to WR 147, “Source 2” in Table 1. We did not find an optical counterpart to this source in the Tycho-2 catalogue from the Hipparcos mission (Hôg et al. H2000 (2000)), but a counterpart was found on images from the Palomar Sky Surveys (POSS). Its position has been measured on red and blue plates of the (original) POSS-I survey with the PMM machine for the USNO-A2.0 catalogue (Monet et al. M1999 (1999)) to be (J2000). The offsets in RA and Dec from the Chandra detection are +0s.018 and +0.22″, close to the estimated astrometric precision (0.3″) of the USNO-A2.0 catalogue. The I magnitude of the coincident source is , which is slightly too faint for Tycho.
We also measured the star’s coordinates from SuperCosmos (e.g. Hambly et al. H1998 (1998)) scans of glass copies of the POSS-II survey. It appears on the overlap region of two red plates giving coordinates and (J2000). These positions are independent of each other, coming from reductions using different sets of Tycho2 stars centred about 5 degrees apart. The mean offsets from these coordinates to the Chandra Source 2 are -0.014s and -0.16″, in the opposite sense to the POSS-I offsets. The sets of stellar coordinates from the POSS-I and POSS-II plates are consistent within the uncertainties of their measurement but the difference (0.54″) might also reflect proper motion of the star between the epochs of the POSS-I and POSS-II survey observations.
Finally a search in the 2MASS catalogue also revealed a possible match for the second source, although the positional accuracy is too poor to help to register the HRC-I image. In any event, because we have only one X-ray source additional to WR 147 in the field, which could be a line-of-sight coincidence with the star measured off the POSS, we will not use these offsets to refine the alignment of the X-ray and optical/radio positions, and must accept some astrometric uncertainty in our analysis of the Chandra data.
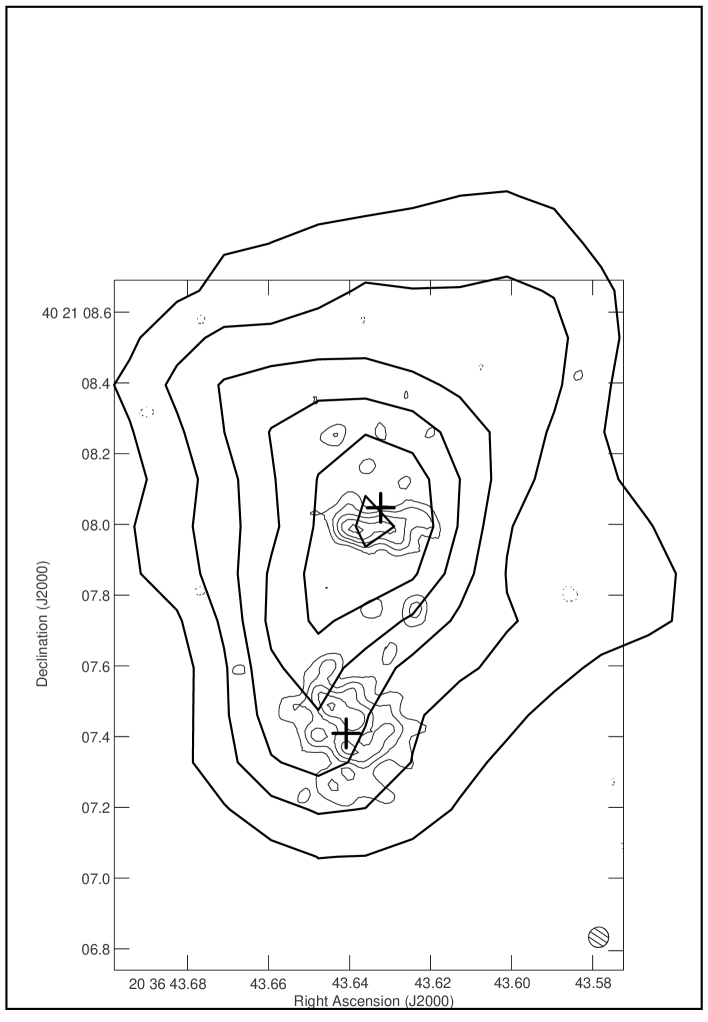
The accuracy of the radio positions of WR 147 and their tie to the optical frame comes via the phase reference source, and the uncertainty is not much more than 10 mas in each coordinate. On the other hand, the uncertainty in the X-ray positions relative to the optical frame is a combination of the source centroid on the detector (as listed in Table 1), and of the tie of the X-ray to the optical frame. It is this last factor which dominates the uncertainty in the relative radio/X-ray positioning. As already noted, the standard processing is accurate in a statistical sense to 0.76″(RMS). However, the Chandra and SuperCosmos-POSS-II positions of source 2 suggests that the positioning of the X-ray frame is accurate to -0.014s and -0.16″, which is consistent with the uncertainties in the position of the source centroids on the X-ray detector and also comparable to the SuperCosmos uncertainties. If we were to incorporate this shift, the X-ray peak would lie on the western edge of the radio bow shock. Hence the intrinsic astrometry appears to be much more accurate for our observation than indicated by the RMS uncertainty, and we can confidently state that the X-ray peak is definitely not cospatial with the WR star.
However, we would need to be able to align the X-ray and optical frames to a positional accuracy of better than 0.05″( pixels) to distinguish between the position of the radio bow shock or the companion star. This is clearly beyond the capability of our current dataset. Therefore in Fig. 2 we have added an offset () to the actual X-ray data so that the peak emission matches up with the centre of the nonthermal radio emission from the bowshock. This offset is well within the nominal accuracy of the Chandra aspect solution. In summary the X-ray peak is certainly not cospatial with the WR star, but could be cospatial with either the nonthermal radio peak or the northern optical component.
Another crucial question concerns whether the detected emission is consistent with an extended object. To address this point we constructed several independent tests. We first extracted a PSF at the position of WR 147 using monochromatic source photons of energy 1.5 keV. This is a sensible approximation to the actual spectrum which is sharply peaked at keV (Skinner et al. SINZ1999 (1999)). We then extracted radially averaged surface brightness plots of the PSF and WR 147, and found that the full width half maximum (FWHM) of the former was (in good agreement with the quoted in the POG), compared to for the WR 147 data.
In a second test we fitted a Gaussian function to the PSF and the HRC-I data of WR 147, and used a maximum likelihood method to determine the optimal FWHM. Despite experiencing complications in our fit to the PSF data due to its extended wings, we again found that the FWHM of the WR 147 data () was significantly larger than that of the PSF (). Finally, in a third test we investigated how the likelihood varied if we assumed that the source was a circular region of constant surface brightness and adjusted its radius. When fitting to the PSF, we found that the likelihood declined rapidly as the radius was increased. In contrast, the likelihood was almost constant for a source radius between 0 and 5 pixels when fitting to the WR 147 data. (i.e. for a circular source up to a radius of 0.66″). This contrast in behaviour again supports the inference that WR 147 is extended. We therefore conclude that WR 147 is resolved at X-ray energies, and note that to the best of our knowledge this is the only stellar system where this is the case.
While the HRC-I has poor spectral resolution, previous ASCA data (Skinner et al. SINZ1999 (1999)) determined that there were essentially no X-ray photons from WR 147 with energies between 0.4-1.0 keV. Since the extinction by dust towards WR 147 is very high, we conclude that there essentially all X-ray photons with energies below 1.0 keV are absorbed. It is therefore highly likely that (at least the majority of) the emission detected in the HRC-I is from the wind-wind collision zone, and we again note consistency with our conclusion that we are seeing extended emission from WR 147.
3 Theoretical X-ray Emission Maps
Based on the above conclusions, we now explore the feasibility of using X-ray imaging to constrain some of the fundamental parameters of this system. This involves computing a grid of synthetic emission maps from hydrodynamical calculations of the wind-wind collision. Since there is some small possibility that each star is also contributing to the observed emission, we also attempt to determine the relative luminosities of each of the three possible components (i.e. each star plus the wind-wind collision).
3.1 Estimates of the Wind Parameters
To estimate the X-ray luminosity from each component, we first need to obtain values for some essential parameters, such as the mass-loss rates of the stars.
On account of its proximity, WR 147 has been extensively studied over different energy bands, and the wind parameters of the WN8 star are well determined. Tight constraints were derived by Morris et al. (M2000 (2000)) using ground-based optical and near-infrared observations, combined with high resolution space-based ISO observations. They obtained a clumping-corrected mass-loss rate of (with filling factor ), substantially lower than derived from optical or radio observations under assumptions of homogeneity. The terminal wind velocity, obtained from helium recombination lines and fine structure transitions in the infrared, was also revised downwards to . The abundances of the WN8 wind (which affect our calculation of the X-ray emission from the wind-wind collision in Section 3.3) are also fairly well determined (cf. Morris et al. M2000 (2000)). From information contained in their paper we have adopted the following relative abundance by mass (sum = 1): , , , , , , , , , , , , . For the OB companion we assume solar abundances.
As for almost every colliding winds system, the wind parameters of the companion are not well determined. It is not even possible to place a reliable upper limit on the mass-loss rate of the wind of the companion star from the non-detection of flux in the high resolution radio images, since the position of the star is on the edge of the nonthermal source where the flux gradient is very steep. Furthermore, the values of derived by W97 and N98 depend on the value of (cf. Usov U1992 (1992)), which is the difference of two rather similar separations, each with observational errors, and hence very uncertain. We therefore choose to average the results of W97 and N98 in the observational frame, and determine a projected stellar separation of 639 mas. Then using the projected radio separation deduced by MERLIN (575 mas), we obtain , independent of inclination.
Given this wide range, we investigate the X-ray emission properties from a series of colliding winds models with varying and inclination, , as listed in Table 2. To reduce the number of free parameters we fix the terminal velocity of the companion star at , although there is plenty of scope for a higher velocity. With all of the other parameters fixed, this leads to the mass-loss rate of the OB star varying directly with the chosen value of . As it is possible that the X-ray emission from the wind-wind collision is somewhat contaminated by emission from the individual winds, model X-ray luminosities lower than observed are to be preferred, and we have weighted our parameter space accordingly.
3.2 X-ray Emission from the Stars
We first attempt to estimate the X-ray luminosity from the WN and OB stars. There is a broad consensus that X-ray emission from early-type stars is generated from shocks within the stellar wind (cf. Owocki et al. OCR1988 (1988); Feldmeier et al. FPP1997 (1997)). However, it is very difficult to make reliable estimates of the intrinsic emission from each star as the variation in the observed luminosity between similar objects can be very large. Despite this, the following calculations give a rough impression of what we might expect for the intrinsic luminosity from each star. For OB stars, Sciortino et al. (S1990 (1990)) note a strong correlation between the intrinsic X-ray emission and the wind momentum rate:
| (2) |
Substitution of the values of and from Table 2 gives (although with an uncertainty of 3 orders of magnitude). Taking the central values on the constants in Eq. 2 (and assuming a 0.01-10.0 keV band) we find that this is between 5 and 35% of the intrinsic colliding winds emission from our models (see Section 3.3).
Estimates of the intrinsic X-ray luminosity from WN8 stars have been made by Wessolowski (W1996 (1996)) and Pollock (Po1987 (1987)), and again the variance between objects can be large. This is partially caused by large uncertainties due to the small exposure durations that many of these stars were observed for. Therefore, perhaps the most accurate estimate can be made from the ROSAT observations of WR 16 (HD 86161; WN8h, v=8.44) and WR 40 (HD 96548; WN8h, v=7.85), neither of which were convincingly detected during WR 16’s 7554s PSPC exposure or WR 40’s 45386s HRI exposure, giving for WN8 stars. Thus the OB companion is more likely than the WR star to contaminate the emission from the wind-wind collision zone.
3.3 X-ray Emission from the Wind-Wind Collision
In this section we determine some of the basic properties of the wind collision region, using both analytical and numerical methods. We use the results from previous observations as a starting point, and therefore assume that the wind momentum ratio lies between and the orbital inclination between (cf. W97, N98, CR99). The full range of computed models is listed in Table 2.
First we use an analytical approximation (cf. Eichler & Usov EU1993 (1993)) to estimate the half-opening angle of the contact discontinuity, measured from the line between the secondary star and the shock apex. For the models in Table 2 we find that (models ), (models ), and (models ).
The combined kinetic power of the two winds for the parameters in Table 2 is approximately constant at (as it is dominated by the WN8 wind for which we assume fixed parameters). An indication of which wind dominates the X-ray emission can be found (to first order) by evaluating the characteristic cooling parameter, , of each wind. To do this we simply make use of Eq. 8 in Stevens et al. (SBP1992 (1992)), while noting that WN8 abundances lead to a similar overall emissivity as solar abundances. Values for and are listed in Table 2, and since and are always , the emission from the shocked winds is close to the adiabatic limit. In such circumstances, the denser wind dominates the emission (cf. Myasnikov & Zhekov MZ1993 (1993)), and we indeed find from hydrodynamical models that . In this regard, however, the results from hydrodynamical models are in conflict with estimates from the relevant equations in Usov (U1992 (1992)), which predict that . This is a worrying revelation as these equations are widely used in the literature, and we investigate this discrepancy in a further paper (Pittard & Stevens PS2002 (2002)).
To obtain accurate estimates of the X-ray emission from the wind-wind collision, and to generate synthetic emission maps with which to compare to the Chandra data (see Section 3.4), we have computed hydrodynamical models of the wind collision, calculated using VH-1 (Blondin et al. BKFT1990 (1990)), a Lagrangian-remap version of the third-order accurate Piecewise Parabolic Method (PPM; Colella & Woodward CW1984 (1984)). The stellar winds were modelled as ideal gases with adiabatic index . Although the wind collision is largely adiabatic, for completeness we included radiative cooling via the method of operator splitting. The cooling curve for the temperature range was generated using the Raymond-Smith plasma code (Raymond & Smith RS1977 (1977)), which specifies an effectively thin plasma in ionization equilibrium.
| Model | (deg) | HRC-I cts | ||||||
|---|---|---|---|---|---|---|---|---|
| cw_1 | 0.02 | 30 | 39 | 2560 | 99 | |||
| cw_2 | 45 | 48 | 3140 | 76 | ||||
| cw_3 | 60 | 67 | 4430 | 55 | ||||
| cw_4 | 0.012 | 30 | 39 | 4220 | 56 | |||
| cw_5 | 45 | 48 | 5170 | 45 | ||||
| cw_6 | 60 | 67 | 7300 | 31 | ||||
| cw_7 | 0.005 | 30 | 39 | 10100 | 20 | |||
| cw_8 | 45 | 48 | 12370 | 17 | ||||
| cw_9 | 60 | 67 | 17470 | 12 |
The simulations were calculated with the assumption of cylindrical symmetry - the orbital period of WR 147 is likely to be of order thousands of years, so all orbital effects are negligible. The large orbital separation also implies that the winds are likely to collide at very near their terminal velocities. We therefore assume that we can treat the winds as being instantaneously accelerated to their terminal velocities at the stellar surface of each star, and do not consider radiative driving effects. For simplicity in this first investigation, we also assume that the post-shock ion and electron temperatures equalize very rapidly. While the equilibration timescale can be significant compared to the flow timescale for wide systems (e.g. WR 140 - see Zhekov & Skinner ZS2000 (2000)), the exact situation is currently unclear with the importance of possible electron heating mechanisms in collisionless shocks still being debated.
Model cw_5 lies in the middle of our grid of simulations with and . The latter specifies the orbital separation as , and the former the mass-loss rate of the companion as a reasonable . The computations were performed using grids spanning either cells () or cells () with orbital separations of a minimum of 125 or 290 cells respectively.
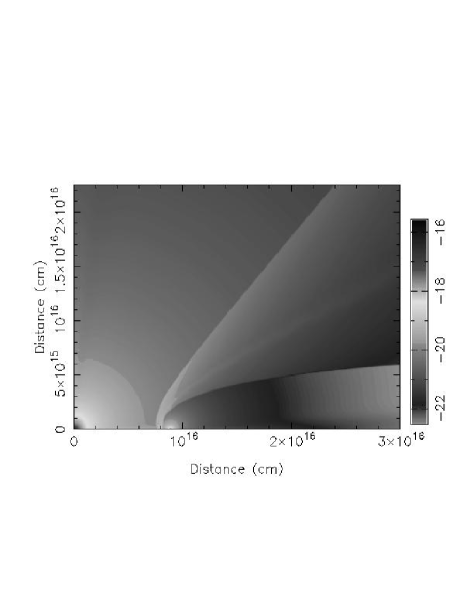
In Fig. 3 we show the wind collision morphology for and . On account of its adiabaticity and approximately equal terminal velocities, the colliding winds region is stable to both thermal and Kelvin-Helmholtz instabilities. The intrinsic emission calculated using Raymond-Smith emissivities (with appropriate abundances for the two winds) from model cw_1 is within a factor of 2 of the measured emission (see Table 2). Since the observed luminosity possibly includes a significant contribution from intrinsic shocks in the wind of each star (cf. Owocki et al. OCR1988 (1988)), luminosities for the wind-wind collision which are slightly lower than the observed value are preferred.
3.4 Synthetic Images
To help to determine if the morphology seen in Fig. 2 is the result of colliding winds emission we have calculated theoretical X-ray images using the hydrodynamical models as input data.
We would normally need to know which star is in front, as the stellar winds are themselves strong absorbers of X-rays. However, as a result of the long orbital period of WR 147, its orbital elements are unknown, and we do not know which star is in front. Nevertheless, this is not problematical because in WR 147 the absorption by the winds is actually very low (a rough estimate of the wind absorption along a line of sight through the WR wind to the region of wind collision gives cf. Usov U1992 (1992)). The low wind column is a direct consequence of the wide separation of the stars and the fact that the sightline to the wind collision region passes through the outermost, least dense regions of the winds. Therefore we can effectively ignore the exact direction of the line of sight into the system, which considerably simplifies the calculation of synthetic images of the wind-wind collision.
As the absorption from spherical winds is negligible, we assume that the total column to WR 147 (; Skinner et al. SINZ1999 (1999)) is independent of orientation. It is well known that the WR stars in Cyg OB2 suffer more reddening than would be normally expected. A correlation between stellar luminosity and reddening (Reddish R1967 (1967)) suggests that some of the reddening is circumstellar, possibly left over from star formation. For the extinction we use Morrison & McCammon (MM1983 (1983)) cross-sections.
As noted in the previous section, we find that the combined intrinsic spectrum is dominated by the shocked WN8 wind, so for simplicity we use WN8 emissivities for both winds. As , this has little effect on the resulting emission. We also incorporate the HRC-I effective area from data distributed with the PIMMS source code, and assume a distance of 650 pc (Morris et al. M2000 (2000)). The size in degrees of each cell in the hydrodynamic grid varies with each model (e.g. for model cw_2 each cell is degrees square). Each HRC-I pixel is degrees square, so for model cw_2 each HRC-I pixel covers the same area of sky as 292 hydrodynamic cells. We have therefore rebinned the synthetic images to the same scale as the HRC-I pixels, and have positioned the WR star at coordinates (), to match the centroid position of the radio contours in Fig. 2. The companion star has been set at a position angle of from the WR-star (cf. W97 and N98). All images are convolved with a Gaussian profile of FWHM to approximate the HRC-I PSF.
Fig. 4 shows the synthetic images from each hydrodynamic model assuming a 5 ksec exposure. For ease of comparison, each image has the same field of view as Fig. 2 and the same contour levels (i.e. contours linearly spaced by 0.366 cts). The number of counts in each image is listed in Table 2. The contours of the actual observation in Fig. 2 have a small additional broadening through our use of CSMOOTH, which is estimated to result in a total net smoothing of approximately FWHM. Therefore this should not overly affect the comparison. The offset mentioned in Sec. 2 has again been applied.
Of immediate note is the gratifying fact that the predicted FWHM from the synthetic images () is in rough agreement with the value inferred from the data in Sec. 2. We also note that it appears to correlate with and . The range in model luminosity is apparent from the number and extent of the contour levels in each image, and it is evident that model cw_1 is too bright and model cw_9 too faint. Because of the self-consistent generation of each model, the position of the peak emission lies at approximately the same coordinates in each image. However, the contours appear more circular and more limb brightened for higher values of the system inclination, (see also Fig. 5). For instance, models cw_3 and cw_4 have essentially the same count rate, yet the emission from model cw_4 is much more concentrated as witnessed by its larger number of contours.
The difference in the concentration of the emission between the models is best illustrated through profiles across the shock cone as shown in Fig. 5. The profile is clearly broader with increased and increased . While this width can only be used in comparison with observations to determine some combination of and (they cannot be determined independently from this comparison alone), it is perhaps possible for these to be uniquely determined if further additional comparisons between the models and the data are made. For instance, the normalization of the profile is dependent on the X-ray luminosity from the colliding WN8 wind, since the shocked WR wind dominates the total colliding winds X-ray luminosity. With fixed values for and , and since the shocked WN8 wind is largely adiabatic, . Here is a measure of the shape of the wind-wind collision (and so is a function of ), and the separation of the stars, , is related to the seperation on the sky, , by . Hence is a (complicated) function of and .
The width of the emission and the luminosity therefore yield two constraints on two unknowns, and in principle and may be determined. We note that the observed circularity of the emission also appears to vary, and it may be possible to use this as an additional constraint in the determination of these parameters. Due to the weakness of the emission from the shocked OB wind, it is, however, clearly not possible to separately determine and from X-ray observations.


From the contour maps in Fig. 4 we see that model cw_5 has 5 contour levels, in good agreement with the number of levels in Fig. 2. However, the number of counts in the synthetic image is only 45, approximately one third of the counts in the actual data. Although the peak brightness is approximately correct, the synthetic image is significantly more compact than the actual data. In particular the synthetic emission does not extend as far south as the position of the WN8 star, whereas the actual X-ray emission clearly does. For comparison, the lowest contour of model cw_3 extends approximately the same distance in RA as model cw_5, but further in DEC (+40 21 07.58 to +40 21 08.59).
| Panel | WWC | WR | OB |
|---|---|---|---|
| left | 0.28 | 0.24 | 0.48 |
| middle | 0.28 | 0.36 | 0.36 |
| right | 0.28 | 0.48 | 0.24 |
The intrinsic luminosity of model cw_5 is % of the ASCA value, whereas the number of simulated HRC-I counts for a 5 ksec exposure is only % of the actual number of HRC-I counts. Therefore, the HRC-I count rate from models cw_1 to cw_9 is underestimated. This suggests that either: i) the simulated spectrum is too hard (from comparing the collecting area of ASCA SIS with Chandra HRC-I as a function of energy), or ii) simple fits to the ASCA SIS spectum return a value for the characteristic absorption column that is higher than the actual value. These two possibilities can each be influenced in two ways. The spectrum could be softened by reducing the terminal velocity of the WR star (since the emission from the shocked companion wind is insignificant its terminal velocity is irrelevant). However, this is a fairly well defined parameter (see Morris et al. M2000 (2000)). Alternatively, the spectrum could be softened if one or both stars contributed comparable luminosity (to the wind-wind collision) through emission from intrinsic shocks in their winds, since it is well known that such emission is generally softer than emission from colliding winds. Adressing point ii), we note that an overestimate of the absorbing column would be consistent with the degradation of the SIS detectors onboard ASCA (see Pittard et al. Pi2000 (2000)). One must also be careful interpreting ‘characteristic values’ when fitting single- or two-temperature models to multi-temperature plasmas (cf. Strickland & Stevens SS1998 (1998)). However, estimates from the visual extinction give , so there doesn’t seem to be much room to maneuver in this regard.
It is tempting to conclude from the above discussion, and the fact that the X-ray flux in Fig. 2 is more extended in a north-south direction than predicted by any of the synthetic images in Fig. 4, that the most likely cause for this discrepency is the softening of the X-ray spectrum by comparable intrinsic emission from the stars. If true, and if the contamination is significant, it would seem that there is little hope that and can be determined. While this would be disappointing for obvious reasons, we note that the S/N of the bottom data contour in Fig. 2 is very poor, and caution against this potential over-interpretation. Since the absorption is so high towards WR 147, it is also expected that essentially all of the X-ray photons from the individual stars (which are softer than those from the wind-wind collision) will be absorbed. On the other hand, it is indeed possible that we are detecting the few photons in the high energy tail of the stellar emission.
We continue our analysis by performing a maximum likelihood fit of our models against the data. We find that the three models with are most favoured, and that the general trend is for to also be favoured. Model cw_3 appears to be preferred over the others because its contours are simultaneously broad (as suggested by the East-West extension of the data in Fig. 2) and not too concentrated (which, for example, counts against model cw_1). The quality of our data does not warrant further detailed fitting, but there is clearly some promise that a future (deeper) observation could be used to perform a consistency check on the best-fit parameter range determined by W97, N98, and CR99.

Since we are unable to completely rule out the possibility of contamination by stellar wind photons we have also examined the effect of adding X-ray emission at the positions of the stars, where the resultant simulated image has again been smoothed by a suitable Gaussian. Fig. 6 shows the contours for differing ratios between the three components based on model cw_3, with a small adjustment in the normalization of the predicted colliding winds emission. Table 3 specifies the ratio of the individual contributions. Again the actual data and the position of the stars are superimposed.
It is immediately obvious from Fig. 6 that the simulated emission is still too concentrated. However, it does become more extended, and in particular the addition of emission from the WR star spreads the contours much further south to give qualitative agreement with the actual data. The addition of stellar contributions slightly improves the fitted likelihood in all 3 cases, although by a similar amount each time such that it is not clear which luminosity ratio is favoured.
The biggest problem between the data and our models is a lack of emission in our models at declinations greater than approximately . This difference may be due to the incorrect alignment of the X-ray and radio data, the poor S/N of the lower contour levels, the emission from the individual stellar winds extending further from the stars than expected, or because our models do not adequately represent the actual emission from the wind collision region.
4 Conclusions
The HRC-I X-ray maps presented in this paper show evidence for the first direct (i.e. spatially resolved) detection of X-ray emission from the wind-wind collision zone of a massive early-type binary. The data from WR 147 has a FWHM of , roughly double that of the PSF. Models of the wind collision zone are also in rough quantitative agreement, and in particular predict a FWHM consistent with that measured. To our knowledge this is the first time that X-ray emission has been resolved in a stellar system.
A future exposure of longer duration is necessary to accurately align the X-ray and optical/radio frames, to potentially constrain the inclination and wind momentum ratio, to determine if the angular scale of the observed emission is consistent with models of the wind collision, and to determine the exact contribution of the individual stars to the X-ray emission. Since the shocked WN8 wind dominates the colliding winds X-ray emission, it is unlikely that separate values for and can be determined from X-ray observations of this system.
Finally, we note the discovery that there is sometimes a discrepancy between estimates of the X-ray luminosity ratio of the shocked winds computed using the equations in Usov (U1992 (1992)) and calculations directly from hydrodynamic simulations. While the ease of application of the elegant equations in Usov (U1992 (1992)) have led to their widespread use, this issue is examined in more detail in a further paper (Pittard & Stevens PS2002 (2002)).
Acknowledgements.
JMP would like to thank PPARC for the funding of a PDRA position, and D. Strickland for use of his image generating program. We gratefully acknowledge the efforts of the Chandra team, in particular on the spectral resolution of the HRC and in determining the spatial extent of a detected source. We would also like to thank the referee K. Gayley for his detailed critique, which led to significant improvements in the final manuscript. This work has made use of NASA’s Astrophysics Data System Abstract Service.References
- (1) Abbott, D.C., Bieging, J.H., Churchwell, E., Torres, A.V., 1986, ApJ, 303, 239
- (2) Blondin, J.M., Kallman, T.R., Fryxell, B.A., Taam, R.E., 1990, ApJ, 356, 591
- (3) Caillault, J.-P., et al. , 1985, Nature, 313, 376
- (4) Cherepashchuk, A.M., 1976, Soviet Astr. Lett., 2, 138
- (5) Chlebowski, T., 1989, ApJ, 342, 1091
- (6) Chlebowski, T., Garmany, C.D., 1991, ApJ, 368, 241
- (7) Churchwell, E., et al. , 1992, ApJ, 393, 329
- (8) Colella, P., Woodward, P.R., 1984, JCP, 54, 174
- (9) Contreras, M.E., Rodríguez, L.F., 1999, ApJ, 515, 762
- (10) Corcoran, M.F., 1996, RMAA Conf. Ser., 5, 54
- (11) Corcoran, M.F., Ishibashi, K., Swank, J.H., Petre, R., 2001, ApJ, 547, 1034
- (12) Dougherty, S.M., Williams, P.M., 2000, MNRAS, 319, 1005
- (13) Eichler, D., Usov, V., 1993, ApJ, 402, 271
- (14) Feldmeier, A., Puls, J., Pauldrach, A.W.A., 1997, A&A, 322, 878
- (15) Hambly, N.C., Miller, L., MacGillivray, H.T., Herd, J.T., Cormack, W.A., 1998, MNRAS, 298, 897
- (16) Hôg, E., et al. , 2000, A&A, 355, L27
- (17) Juda, M., et al. , Proc. SPIE, 4140, 155
- (18) Lépine, S., Wallace, D., Shara, M.M., Moffat, A.F.J., Niemela, V.S., 2001, AJ, 122, 3407
- (19) Moffat, A.F.J., Drissen, L., Lamontagne, R., Robert, C., 1988, ApJ, 334, 1038
- (20) Monet, D., Bird, A., Canzian, B., et al. , 1999, USNO-SA2.0, (U.S. Naval Observatory, Washington DC).
- (21) Moran, J.P., et al. , 1989, Nature, 340, 449
- (22) Morris, P.W., et al. , 2000, A&A, 353, 624
- (23) Morrison, R., McCammon, D., 1983, ApJ, 270, 119
- (24) Murray, S.S., et al. , 1997, Proc. SPIE, 3114, 11
- (25) Myasnikov, A.V., Zhekov, S.A., 1993, MNRAS, 260, 221
- (26) Niemela, V.S., Shara, M.M., Wallace, D.J., Zurek, D.R., Moffat, A.F.J., 1998, AJ, 115, 2047
- (27) Owocki, S.P., Castor, J.I., Rybicki, G.B., 1988, ApJ, 335, 914
- (28) Pittard, J.M., Stevens, I.R., 1997, MNRAS, 292, 298
- (29) Pittard, J.M., Stevens, I.R., 2002, A&A, in press
- (30) Pittard, J.M., et al. , 2000, MNRAS, 319, 137
- (31) Pollock, A.M.T., 1987, ApJ, 320, 283
- (32) Pollock, A.M.T., et al. , 1999, IAU Symp., 193, 388
- (33) Pollock, A.M.T., et al. , 2002, in preparation
- (34) Raymond, J.C., Smith, B.W., 1977, ApJS, 35, 419
- (35) Prilutskii, O.F., Usov, V.V., 1976, Soviet Astr., 20, 2
- (36) Reddish, V.C., 1967, MNRAS, 135, 251
- (37) Sciortino, S., et al. , 1990, ApJ, 361, 621
- (38) Skinner, S.L., Güdel, M., Schmutz, W., Stevens, I.R., 2001, ApJ, 558, L113
- (39) Skinner, S.L., Itoh, M., Nagase, F., Zhekov, S.A., 1999, ApJ, 524, 394
- (40) Stevens, I.R., Blondin, J.M., Pollock, A.M.T., 1992, ApJ, 386, 285
- (41) Strickland, D.K., Stevens, I.R., 1998, MNRAS, 297, 747
- (42) Usov, V.V., 1992, ApJ, 389, 635
- (43) van Speybroeck, L.P., et al. , 1997, Proc. SPIE, 3113, 89
- (44) Weisskopf, M.C., O’dell, S., van Speybroeck, L.P., 1996, Proc. SPIE, 2805, 2
- (45) Wessolowski, U., 1996, in ‘Wolf-Rayet stars in the framework of stellar evolution’, Universite de Liege, eds. J.M. Vreux, A. Detal, D. Fraipont-Caro, E. Gosset, and G. Rauw, 345
- (46) Williams, P.M., et al. , 1990, MNRAS, 243, 662
- (47) Williams, P.M., et al. , 1997, MNRAS, 289, 10
- (48) Zhekov, S.A., Skinner, S.L., 2000, ApJ, 538, 808