The effect of mixing on metallicity gradients in the ICM
Abstract
It is generally argued that most clusters of galaxies host cooling flows in which radiative cooling in the centre causes a slow inflow. However, recent observations by Chandra and XMM conflict with the predicted cooling flow rates. It has been suggested that radio jets that are situated at the centre of clusters of galaxies can assist in reducing the deposition of cold gas. Radio jets inflate cavities of hot radio plasma that rise through the cluster atmosphere and thus stir the intra-cluster medium. In this letter it is investigated whether this scenario is consistent with the pronounced metallicity gradients that have been observed in the cores of clusters.
1 Introduction
The X-ray surface brightness of many clusters of galaxies shows a strong central peak which is generally interpreted as the signature of a cooling flow (Cowie & Binney 1977, Fabian & Nulsen 1977, Sarazin 1988, Fabian 1994). However, the simple cooling flow model conflicts with a growing number of observations that show that while the temperature is declining in the central region, gas with a temperature below 1 keV is significantly less abundant than predicted. Moreover, the level of star formation found in present-day cooling flows is insufficient to explain the mass deposition rates inferred from X-ray observations (Böhringer et al. 2001).
Many clusters of galaxies host a radio source at their centres. Around
71% of all cD galaxies in cooling flows show evidence for radio
activity which implies that either the sources are active for longer
than 1 Gyr or that they recur with high frequency (Burns 1990). These
radio sources emit large quantities of hot relativistic plasma into
the intracluster medium (ICM). The displacement of thermal plasma by
the relativistic plasma can create ‘holes’ in the X-ray surface
brightness such as observed in the Perseus cluster (Böhringer et
al. 1993). Holes in the X-ray emission are also seen in the radio
lobes of the Hydra A cluster (McNamara et al. 2000), Centaurus A
(Saxton, Sutherland and Bicknell 2001) and other clusters (Fabian et
al. 2000, Mazzotta et al. 2001). It has also been shown that bubbles
are difficult to detect and that a substantial amount of energy may be
hidden in this form in clusters (Brüggen et al. 2002).
The radio jets inflate pockets of low-density radio plasma that rise
buoyantly through the cluster atmosphere. In the course of this rise
the cavities become Rayleigh-Taylor unstable and form plumes and
mushroom-like structures (Churazov et al. 2001, Brüggen & Kaiser
2001). It has been shown that the rising bubbles can lead to mixing and a
significant restructuring of the inner regions of a cooling flow
(Churazov et al. 2001, Brüggen & Kaiser 2001, Nulsen et
al. 2001). This process can reduce the deposition of cool gas without
directly introducing heat and thus can form an effective machanism to
couple the mechanical power of the radio jets to the cooling gas. In
some cases this may be sufficient to quench the cooling flow (Binney
2001, Binney & Tabor 1995).
However, pronounced metallicity gradients have been detected in the core of some clusters. Chandra observations of Hydra A have shown a factor 2 increase in the Fe and Si abundances within the central 100 kpc (David et al. 2001). Fukazawa et al. (2000) measured metal abundances in the ICM of 34 clusters using ASCA data and also found increments in Si and Fe abundances around cD galaxies. Similar results have been found by Ezawa et al. (1997), Ikebe et al. (1997), Finoguenov & Ponman (1999) and Finoguenov et al. (2000). Fukazawa et al. (2000) found that the central Fe abundances of cD type clusters are by up to a factor of 3 higher than their spatially averaged values, while non-cD type clusters do not show this Fe excess at the centre. This indicates that the excess metals are probably ejected from the central cD galaxy but the exact origin of these metals is still subject to debate. However, the metals have to be produced at the cluster centre because gravitational settling of the heavy ions takes much longer than the age of the Universe (Sarazin 1988). (The abundance gradients occur mostly around cD galaxies which are believed to sit still at the bottom of the cluster potential. Therefore, it seems unlikely that the metals have been stripped off by the ICM.)
The presence of steep metallicity gradients constrains the amount of mixing that can take place in a cluster. If stirring motions induced by buoyant bubbles erase the metallicity gradient faster than the metals can be replenished at the centre, it will be difficult to explain the observed metallicity gradients. In order to calculate the effect of rising bubbles on the metallicity gradients of a cluster, I performed three-dimensional hydrodynamical simulations and employed tracer particles to compute the metallicity gradients.
2 Method
The simulations were obtained using the parallel version of the
ZEUS-3D code which was developed especially for problems in
astrophysical hydrodynamics. The code uses finite differencing on an
Eulerian grid and is fully explicit in time. For a detailed
description of the algorithms and their numerical implementation see
Stone & Norman (1992a, b). In order to study the mixing of the ICM,
the ZEUS code was modified to follow the motion of tracer
particles. These tracer particles are passively advected with the
fluid and their positions are written to a file at regular
intervals.
In our simulations we employed an ideal gas equation of state and we
ignored the effects of magnetic fields and rotation. The cooling time
in our cluster model is of the order of 500 Myrs which is sufficiently
long compared to the time scales considered here so that we ignored
it. Moreover, numerical experiments have shown that the neglect of
cooling does not influence the large-scale dynamics of the fluid over
the time-scales considered here. The simulations were computed on a
Cartesian grid in three dimensions. The serial version of the code
was run on a SUN ULTRA workstation and the parallel version on an SGI
ORIGIN 3000. The computational domain spanned 30 kpc in height with a
base area of 10 kpc 10 kpc. This domain was covered by 450
150 150 equally spaced grid points. On the
boundaries outflow conditions were chosen.
The initial mass and temperature distributions were modelled on the Virgo Cluster as given by Nulsen & Böhringer (1995). The gas density distribution was found by assuming hydrostatic equilibrium to maintain an initially static model. Here the results from two runs are reported: run 1 and run 2. At each timestep hot gas was injected into a spherical region which was situated at a distance of kpc from the gravitational centre. This spherical region had a radius of kpc and kpc for run 1 and 2, respectively. The injected gas had zero initial velocity and the energy injection rates were erg s-1 (run 1) and erg s-1 (run 2). This particular set of parameters was chosen because they could reproduce a lot of observational features of late-stage radio activity. As shown elsewhere (Brüggen et al. 2002) the latter luminosity is close to the maximum rate of thermal energy injection that produces a buoyant plume. Even larger energy injection rates have the effect of evacuating the core before the bubble can start to rise. It was assumed that the material in the injection region is supplied by the jet of an Active Galactic Nucleus (AGN). The flow from the centre of the source to the injection region is taken to be ballistic while the injection region itself may be identified with the location of a strong internal shock that brings the jet into pressure equilibrium with the surrounding gas. This picture motivates the choice of parameters for the position of the injection region for which kpc is a reasonable choice. We have also explored slightly different parameters in Brüggen et al. (2002) and found that the resulting flow is not strongly dependent on the choice of these parameters.
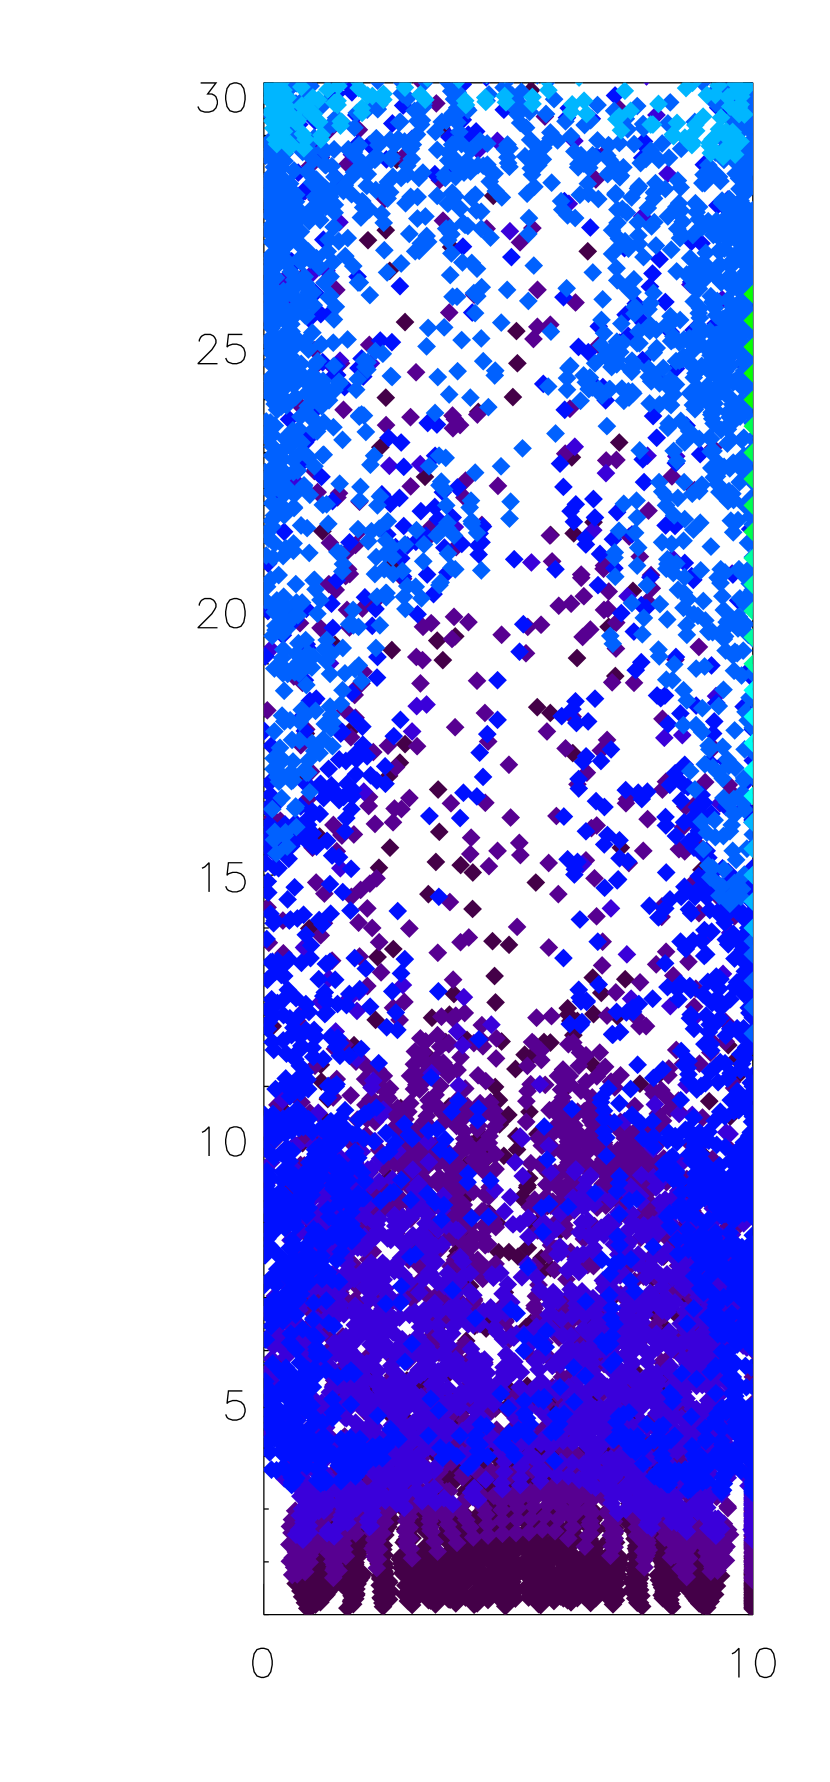
At the start of the simulation 24,000 tracer particles were
distributed uniformly throughout the computational domain
(Fig. 1). The gas was treated as a single fluid and assumed to obey a
polytropic equation of state with . For more details of
the simulation the reader is referred to the paper by Brüggen et
al. (2002).
Finally, I should address some issues related to the accuracy of these kinds of finite-difference hydrodynamical simulations. While the code can simulate large-scale mixing due to Rayleigh-Taylor and Kelvin-Helmholtz instabilities, it does not include real diffusion of particles. Any observed diffusion is therefore entirely numerical. Moreover, numerical viscosity is responsible for suppressing small-scale instabilities at the interface between the bubble and the cooler, surrounding, X-ray emitting gas. To assess the effects of numerical viscosity, I have repeated some simulations on grids with lower resolution. From these experiments I can conclude that ’global parameters’ such as the position and size of the ’mushrooms’ are relatively insensitive to the resolution. However, the detailed morphology on small scales does depend on the resolution and the choice of initial conditions.
3 Results
Fig. 1 shows the positions of the tracer particles at the start of
the simulation and after a simulated time of 63 Myrs (run 2). The
tracer particles are color coded according to their initial positions
as shown in the left panel. One can see how the bubble displaces the
material and lifts the tracer particles up from the cluster centre. In
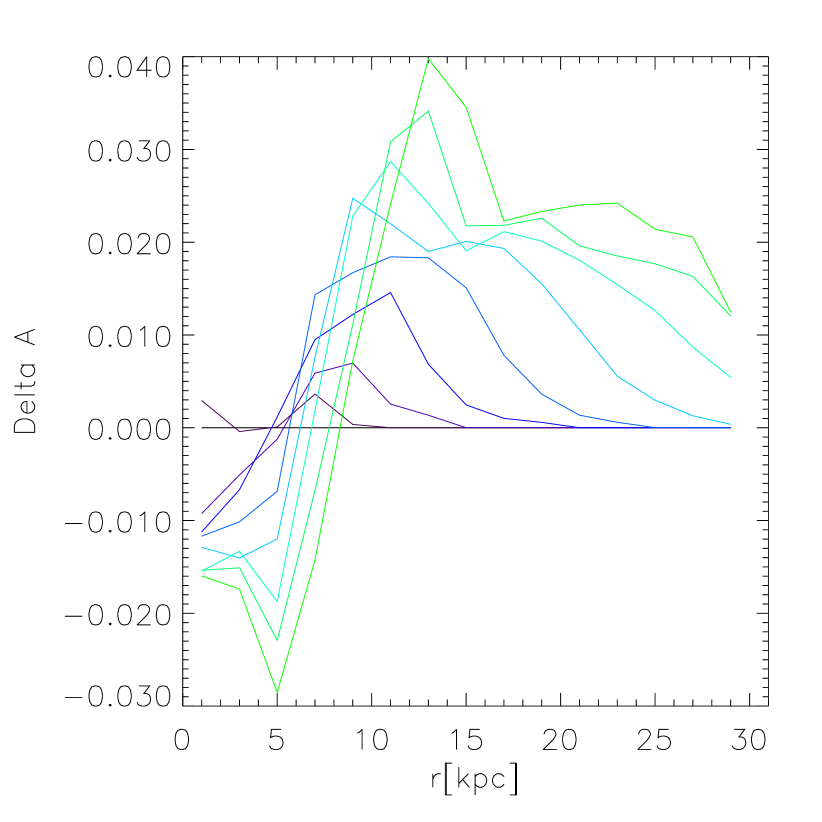
Fig. 2 the differences between the original iron abundance profiles
and that at a time after the start of the energy injection are
shown. I assumed an initial iron abundance given by , where is measured in units
of the solar abundance and denotes the distance from the centre of
the cluster measured in kpc. This simple fit is based on the
observations of Hydra A by David et al. (2000). The abundances have
been averaged over horizontal slices through the computational
volume. One should note that in computing the abundances I included
only those metals of the ICM that already were present at the start of
the simulation. I ignore those metals that may have been injected with
the hot gas. Therefore, the changes in the abundances are caused
solely by the displacement and mixing of the ICM. Thus, one obtains an
upper limit on the abundance changes because the injected gas may
contain metals, too. Furthermore, one can note that the bubbles might
dredge up material from the central regions of the active galaxy which
is likely to be enriched by stars of supersolar abundances.
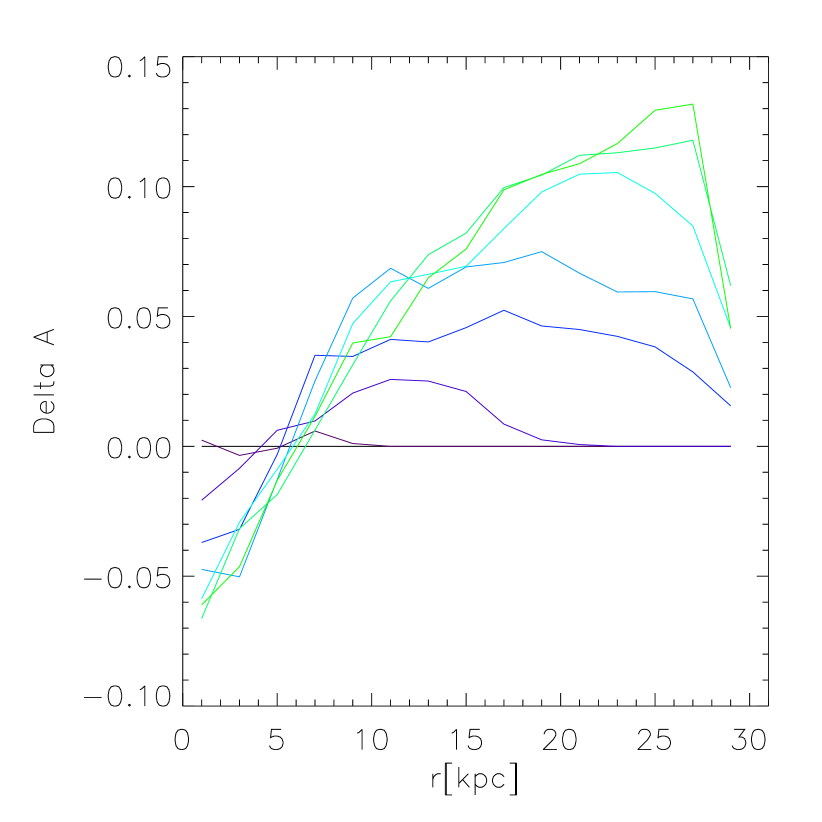
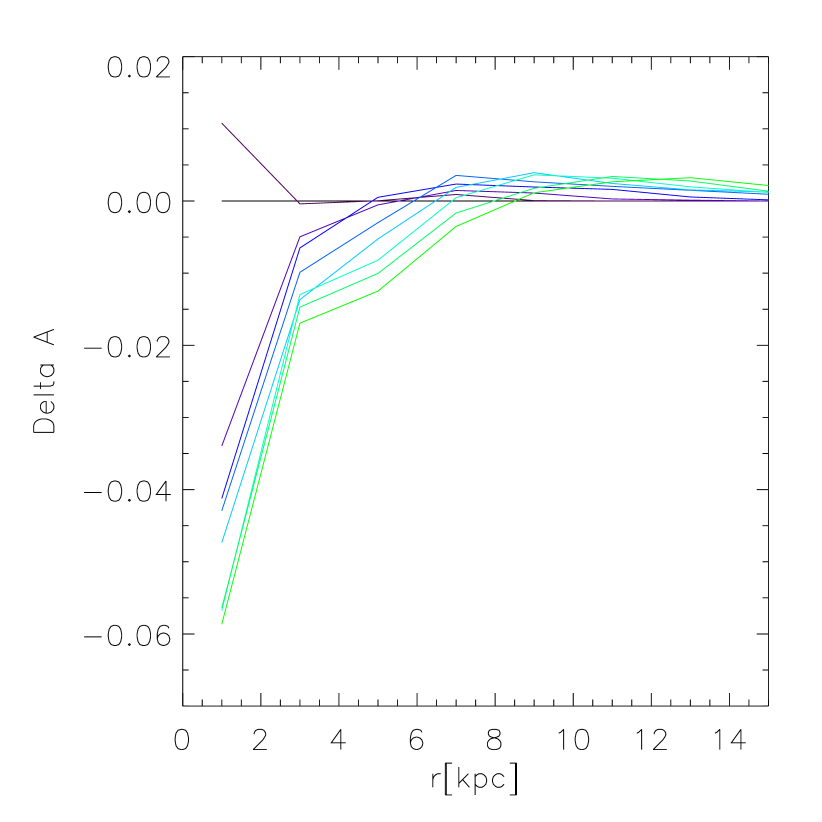
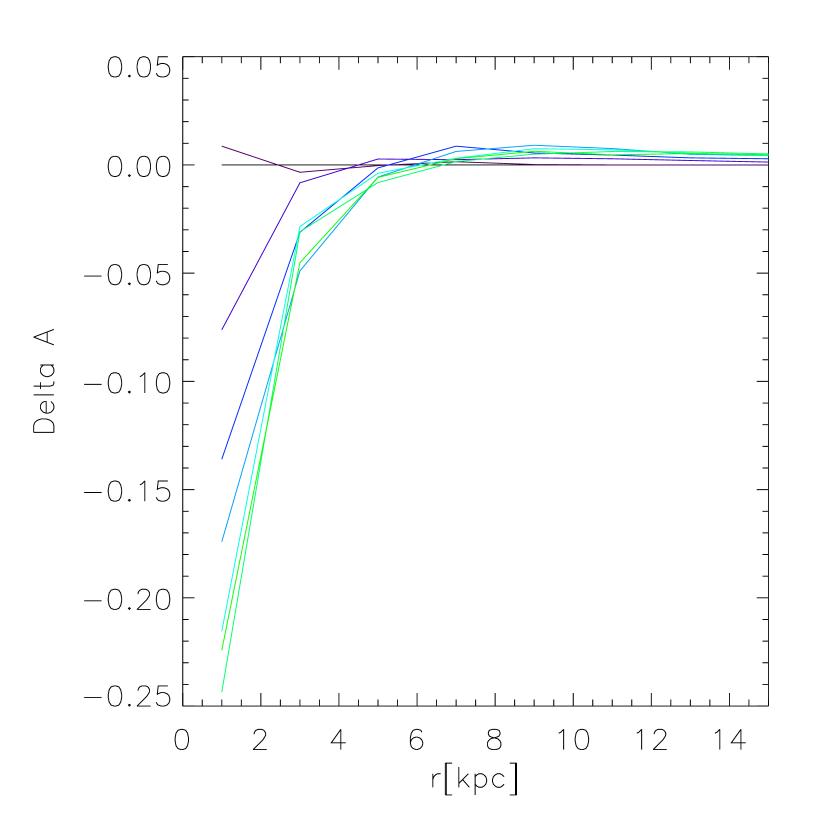
Fig. 3 shows the same as Fig. 2 only that the abundances have been averaged over semispherical shells. This way the observations are simulated where the spectra are averaged over concentric rings about the cluster centre. Here I average over semi-spherical shells assuming that the jet is part of an ambipolar jet. Now, the abundance changes are much smaller at larger radii due to the larger volume to average over. The only noticeable decrease occurs within the inner 5 kpc. For run 1 the abundance changes found are smaller than the accuracy of the observed values which is of order of solar (David et al. 2001). For run 2, the metallicity at the inner edge of the core is decreased by nearly 0.25 solar but averaged over the inner 5 kpc the decrease is roughly 0.1 solar.
4 Conclusion
It was found that mixing by buoyant bubbles has a relatively weak impact on the metallicity gradients found in clusters. The simulations were stopped after 120 Myrs but during this time supernovae in the cD galaxy will have replenished some of these metals.
The fact that the Si/Fe abundance ratio of the central excess metals is close to the solar value suggests that typa Ia supernovae are the main suppliers for these metals. Over the course of our simulation the Fe abundance within the central 5 kpc was decreased on average by solar (run 2). Given that the mass within the same radius is this corresponds to an Fe mass of . Adopting the supernovae yields that have been averaged over a Salpeter IMF as given by Finoguenov et al. (2000), (type Ia), it requires less than supernovae to replenish the dredged-up mass of iron. Over the time of the simulation this would correspond to a supernova rate of yr-1 which is still less than the expected type Ia supernova rate for a typical central galaxy (van den Bergh 1987). Hence, the metals lost through the mixing by bubbles can be replenished by supernovae from the old stellar population in the central galaxy.
Therefore, one can conclude that the heating scenario in cooling flows is consistent with the measured metallicity gradients.
Fukazawa et al. (2000) found that the central iron excess is larger (by 0.2-0.4 solar) in cooler clusters than in hotter ones (by 0.1-0.2 solar). This observation could provide circumstantial evidence for the action of radio galaxies. In cooler clusters some time has passed since the last epoch of radio activity and heating has occurred. The hotter clusters, on the other hand, have recently experienced a period of radio activity or are in the middle of such a period. If the radio activity caused a redistribution of the metals, one would expect to find a correlation between the central metal excesses and the radio power of the cD galaxy. This conjecture could be checked observationally. Alternatively, the observations by Fukazawa et al. (2000) might merely reflect the fact that the hotter clusters may have been disturbed recently by a merger which has mixed the metals and reduced the central metallicity increment.

References
- (1) Binney, J. & Tabor, G. 1995, MNRAS, 276, 663
- (2) Binney, J. 2001, ’AGN and cooling flows’ in Particles and Fields in Radio Galaxies, ed. Laing, R. A. , Blundell, K. M., ASP Conference Series, ASP, San Francisco, in press (astro-ph/0103398)
- Böhringer et al. (1993) Böhringer, H., Voges, W., Fabian, A. C., Edge, A. C. and Neumann, D. M. 1993, MNRAS, 264, L25
- (4) Böhringer, H., Matsushita, K., Churazov, E., Ikebe, Y., & Chen, Y. 2001, A&A, submitted (astro-ph/0111112)
- Brüggen & Kaiser (2001) Brüggen, M., Kaiser, C. R. 2001, MNRAS, 325, 676
- (6) Brüggen, M., Kaiser, C. R., Churazov, E., Ensslin, E. 2002, MNRAS, in press
- Burns (1990) Burns, J. O. 1990, AJ, 99, 14
- Churazov, E. and Brüggen, M. and Kaiser, C. R. and Böhringer, H. and Forman, W. (2001) Churazov, E. and Brüggen, M. and Kaiser, C. R. and Böhringer, H. and Forman, W. 2001a, ApJ, 554, 261
- Churazov et al. (2001b) Churazov, E., Sunyaev, R., Forman, W. and Böhringer, H. 2001, MNRAS, (submitted)
- Churazov, Forman, Jones and Böhringer (2000) Churazov, E., Forman, W., Jones, C. and Böhringer, H. 2000, A&A, 356, 788
- Cowie & Binney (1977) Cowie, L. L., Binney, J. 1977, ApJ, 215, 723
- David et al. (2001) David, L. P., Nulsen, P. E. J., McNamara, B. R., Forman, W., Jones, C., Ponman, T., Robertson, B., & Wise, M. 2001, ApJ, 557, 546
- Ezawa et al. (1997) Ezawa, H., Fukazawa, Y., Makishima, K., Ohashi, T., Takahara, F., Xu, H., & Yamasaki, N. Y. 1997, ApJ, 490, L33
- Fabian et al. (2000) Fabian A.C., Sanders J.S., Ettori S., Taylor G.B., Allen S.W., Crawford C.S., Iwasawa K., Johnstone R.M., Ogle P.M., 2000, MNRAS, accepted, astro-ph/0007456
- Fabian & Nulsen (1977) Fabian, A. C., Nulsen, P. E. J. 1977, MNRAS, 180, 479
- Fabian (1994) Fabian, A. C. 1994, ARA&A, 32, 277
- Finoguenov & Ponman (1999) Finoguenov, A. & Ponman, T. J. 1999, MNRAS, 305, 325
- Finoguenov, David, & Ponman (2000) Finoguenov, A., David, L. P., & Ponman, T. J. 2000, ApJ, 544, 188
- Fukazawa et al. (2000) Fukazawa, Y., Makishima, K., Tamura, T., Nakazawa, K., Ezawa, H., Ikebe, Y., Kikuchi, K., & Ohashi, T. 2000, MNRAS, 313, 21
- Ikebe et al. (1997) Ikebe, Y., Fukazawa, Y., Tamura, T., Makishima, K., & Ohashi, T. 1997, X-Ray Imaging and Spectroscopy of Cosmic Hot Plasmas, 57
- (21) Mazzotta, P., Kaastra, J. S., Paerels, F.B. 2001, ApJ in press (astro-ph/0107557)
- McNamara et al. (2000) McNamara, B. R., Wise, M., Nulsen, P. E. J., David, L. P., Sarazin, C. L., Bautz, M., Markevitch, M., Vikhlinin, A., Forman, W. R., Jones, C. and Harris, D. E. 2000, ApJl, 534, L135
- Nulsen and Böhringer (1995) Nulsen, P. E. J. and Böhringer, H. 1995, MNRAS, 274, 1093
- Nulsen (2001) Nulsen, P. E. J. et al. 2001, ApJ, in press, astro-ph/0110523
- (25) Saxton, C.J., Sutherland, R.S. & Bicknell, G.V., 2001, astro-ph/0107558
- (26) Stone, J.M., Norman, M.L., 1992a, ApJS, 80, 753
- (27) Stone, J.M., Norman, M.L., 1992b, ApJS, 80, 791
- Sarazin (1988) Sarazin, C. L. 1988, NATO ASIC Proc. 229: Cooling Flows in Clusters and Galaxies, Kluwer, Dordrecht, 1
- van den Bergh, McClure, & Evans (1987) van den Bergh, S., McClure, R. D., & Evans, R. 1987, ApJ, 323, 44