Molecular gas in NGC 6946
Abstract
We present imaging of molecular gas emission in the star-forming spiral galaxy NGC 6946. Our 12CO(1-0) and 12CO(3-2) images, made at 22″ resolution with the IRAM 30-m and the Heinrich Hertz 10-m radio telescopes, are the most extensive observations of molecular gas in this galaxy and are among the most extensive observations of molecular gas in any spiral galaxy.
The 12CO(1-0) emission shows a central concentration aligned in a north-south ellipse, an extended diffuse component plus concentrations in the outer spiral arms. 12CO(1-0) is detected across most of the optical disk out to a projected radius of nearly 300″. The molecular component in NGC 6946 is unusually massive, with . The scale length of the disk in 12CO(1-0) is the same, to within 5%, of the VRI, H, 15 m, and FIR disks. The 12CO(3-2) data shows broadly similar structure to the 12CO(1-0) image out to the observed limit of 200″, although the arm-interarm contrast of 12CO(3-2) is significantly larger than that of 12CO(1-0) which suggests that molecules in the spiral arms are warmer or reside longer there. The rotation curve derived from the 12CO(1-0) velocity field agrees, within the uncertainties, with the H i rotation curve. The velocity dispersion is km s-1 in the inner 2 kpc and km s-1 in the disk, without tendency to increase in the spiral arms.
Spectra of the 13CO(1-0), 13CO(2-1), 12C18O(1-0) isotopomers for several positions are used for line ratio studies of the state of the molecular ISM in NGC 6946. In the centre of NGC 6946 our LVG analysis suggests that the beam-averaged gas kinetic temperature is K, the molecular gas density is cm-3 and that line opacities are high, with . A star formation efficiency image for NGC 6946, made from the H image divided by the molecular gas image, ranges by over two orders of magnitude with highest values found in the northeastern spiral arm. The 6 cm polarized emission image, which traces the regular part of the magnetic field, appears anti-correlated with the star formation efficiency.
We present an analysis of the ISM in NGC 6946’s disk by making 1-D and 2-D comparisons of images made in several wavebands. Using a point-by-point correlation technique, we investigate the distribution and kinematics of the molecular gas and its relation to the neutral and ionized gas, the mid-infrared-emitting dust, the radio continuum and the magnetic field, and find that the molecular gas is closely associated with the 7 m-emitting dust. The highest correlation between any pair of tracers is found between the mid-infrared emission and the total radio continuum emission at 6 cm. This cannot be due to dust heating and gas ionization in star-forming regions because the thermal radio emission is less correlated with the mid-infrared emission than the nonthermal emission. A coupling of magnetic fields to gas clouds is proposed as a possible scenario.
Key Words.:
ISM; molecules – galaxies; spiral – radio lines; galaxies – submillimetre1 Introduction
How gas is compressed into molecular clouds of various sizes and subsequently forms stars is one of the outstanding questions of modern astronomy. On the scale of a galaxy, the effects of the galaxy’s gas content, chemistry, dynamical and morphological properties, spiral structure, and magnetic field strength are among the factors that need to be taken into account (Evans 1999). NGC 6946 is ideally suited for studies of these properties, as it is a nearby, nearly face–on spiral galaxy with an exceptionally gas–rich disk which shows evidence for a high star formation rate (SFR) throughout (de Gioia-Eastwood et al. 1984). NGC 6946’s orientation and large angular size () offers the prospect of studying the structure and star forming properties of the disk with sufficient (sub-kpc) spatial resolution to clearly resolve the spiral arms.
NGC 6946 and its many supernova remnants have been the subject of numerous X–ray, optical and radio papers. Several authors have previously studied NGC 6946 in optical wavebands, although these studies are hampered by the low Galactic longitude () which results in considerable extinction () and many foreground stars. At mm wavelengths the CO molecule, used as a tracer of the dominant molecular species, H2, has been observed by several authors. Ball et al. (1985), Sofue et al. (1988), Weliachew et al. (1988), Ishizuki et al. (1990) and Regan & Vogel (1995) observed just the centre region, while Casoli et al. (1990) imaged two 110″ diameter regions with the IRAM 30-m telescope. Morris & Lo (1978), Rickard & Palmer (1981), Young & Scoville (1982) and Tacconi & Young (1989) obtained low resolution CO images of parts of the inner disk; Sauty et al. (1995) present the largest previous molecular image, in the CO(2-1) line.
Morphologically, NGC 6946 is a late-type SAB(rs)cd spiral galaxy, with several spiral arms and star-forming regions scattered throughout the disk, considerable extinction caused by dust lanes (Sauty et al. 1995; Trewhella 1998) and a small nucleus. Its general properties are summarized in Table 1. There is some debate in the literature about how many spiral arms the numerous fragments of arms belong to, but -band images reveal four prominent, not very symmetric arms (Regan & Vogel 1995). The “thick” optical arm in the NE, also seen in the deep H map presented by Ferguson et al. (1998), earns NGC 6946 a place in Arp’s atlas.
Although NGC 6946 has only a small bar (Elmegreen et al. 1998), Ishizuki et al. (1990) present evidence for an efficient inflow of gas into the central 11″, fueling the activity observed there (Turner & Ho 1983; DeGioia-Eastwood 1985; Roy & Belley 1993; Elmegreen et al. 1998) which has been interpreted as a mild or post starburst (Tacconi & Young 1990; Engelbracht et al. 1996; Ptak et al. 1999). Devereux & Young (1993) discuss the origin of the bright far-IR emission in NGC 6946 (Telesco & Harper 1980; Engargiola 1991) which, at , is amongst the highest measured in a nearby spiral galaxy (Devereux & Young 1993). Devereux & Young (1993) conclude that most of the FIR luminosity derives from warm ( K) dust although 90% of the mass of the dust is in a cooler ( K) component.
|
-
a
RC3, m(B) is the apparent magnitude in , corrected for foreground and intrinsic extinction.
-
b
Tully (1988). Note that the distance is uncertain, and other authors have quoted values between 3.2 and 11 Mpc.
-
c
Carignan et al. (1990): RHO = 11.6 kpc for our adopted distance.
-
d
Mass of the dark matter halo, measured at the last point on rotation curve (14.7 kpc).
-
e
Rogstad et al. (1973)
-
f
Tacconi & Young (1986), Sect. 3.3.
-
g
Burstein & Heiles (1982): AB = 1.610 mag
-
h
IRAS: Rice et al. (1988).
-
i
Alton et al. (1998). Note that this dust mass, derived from a combination of ISO 100 and 200 m data, is an order of magnitude larger than that derived from IRAS data alone, and assumes an index of 1.0 in the FIR emissivity law.
-
j
This value can be compared with a mean value of -0.048 for a sample of 28 spiral galaxies reported in Dutil & Roy (1999).
Alton et al. (1998) and Bianchi et al. (2000) present images of NGC 6946 in the 450 m and 850 m wavebands, respectively, and find that dust is associated with the molecular ISM, becoming more dominant at larger radii, where it is possibly more extended than the stars. Dale et al. (1999; 2000) present ISOCAM maps of NGC 6946 in the LW2 and LW3 bands centered at 7 m and 15 m.
NGC 6946 has also been observed intensively in radio continuum, including the linearly polarized emission which indicates regular magnetic fields (Beck 1991; Beck & Hoernes 1996). The polarized emission emerges from two “magnetic arms” located between the optical arms like their phase-shifted images (Frick et al. 2000).
Previous CO observations have identified NGC 6946 as having one of the most massive and extended molecular gas components observed in a nearby galaxy (e.g. Young et al. 1995). Atomic gas is also found throughout the disk, although it is found in highest concentrations in the spiral arms and appears less massive than the molecular component (Tacconi & Young 1986; Boulanger & Viallefond 1992). At present, theoretical models of large scale star formation consider the equilibrium reached between the stellar radiation field and physical state of the gas clouds to be crucial (Parravano 1989; Bertoldi & McKee 1996), and thus require quantitative input on the relative distribution of the stars and the gas. A uniform image of the entire disk in the primary molecular gas tracer, the 12CO(1-0) line, is therefore long overdue for NGC 6946. Since stars form primarily in the dense cores of molecular clouds, observing the emission from molecules that require high densities for excitation is important for estimating the density, mass, temperature and opacity of star-forming clouds in galaxies. We therefore also present extensive imaging of the 12CO(3-2) line, which may be only moderately opaque (Petitpas & Wilson 2000), and therefore trace the column density of the warm component better than other lines.
The distance to NGC 6946 has been variously quoted to lie within the range 3.2-11 Mpc. We adopt a value of 5.5 Mpc (Tully 1988), which means that our 22″ resolution corresponds to a linear scale of 0.59 kpc.
Sect. 2 describes the IRAM and HHT observations, the results of which are presented in Sect. 3, which also includes a large velocity gradient analysis of the ISM at selected positions. Sect. 4 considers both 1-D and 2-D correlations between images of NGC 6946 made in several wavebands, and Sect. 6 summarizes the main results.
2 Observations
|
-
a
Double sideband
-
b
Beam misalignment 5″
2.1 Pico Veleta observations
The IRAM 30-m telescope, located at elevation 2920 m on Pico Veleta, Spain, is a paraboloid with f/D=0.35. The telescope uses Nasmyth foci and the main dish surface is accurate to m rms. We observed in “on-the-fly” mode where the telescope beam moves with a uniform velocity across the source. Orthogonal raster maps were made of a 10′ 10′ field. The integration time per point (on source) was 4 s and the maps were repeated three times in each direction and then averaged. One 1024-channel filterbank was used to observe CO(1-0) with a resolution of 1 MHz or 2.6 km s-1 and an autocorrelator was used for CO(2-1). Both frequencies were observed simultaneously and data were recorded every 1s. Typical system temperatures at 115 GHz were K. The beamwidths of the 30-m telescope at 115 and 230 GHz are 21″ and 12″, respectively. To (more than) satisfy the sampling theorem for the CO(1-0) map we used 9″ raster spacing. An emission-free reference position was measured every horizontal or vertical raster, or about once every 7.5 minutes.

Calibration, performed with the chopper wheel method with both hot (sky and absorber) and cold (nitrogen) loads, is described in detail in Wild (1999). The conversion factor from main beam brightness temperature (Tmb) to flux density is 4.7 Jy K-1. The calibration was verified on well-known molecular sources and by continuum scans across Jupiter, Uranus, Mars and Saturn, and found to be better than 10% at both frequencies. At 230 GHz problems with the autocorrelator compromised data quality and these data are not discussed further. The absolute pointing model is checked and modeled regularly by the IRAM staff so that our focus and pointing checks, made every few hours and after sunrise/sunset or long drives, required corrections of always less than 4″. Tracking precision of the 30-m telescope is better than 1″.
Fig. 1 shows 12CO(1-0) spectra of the central positions in NGC 6946 with pointing centres spaced by 3″. Since these central spectra in NGC 6946 are so bright and distinctive, they were frequently used as an additional check on the pointing for both the IRAM and the HHT observations.
The data were reduced with the CLASS and GRAPHIC software of the Grenoble Astrophysical Group (GAG) package. A polynomial baseline of order one, or occasionally three, was removed from each spectrum and then spectra taken towards the same position were averaged. As several coverages of the galaxy (in orthogonal directions) had been taken, the different maps were compared before averaging, to ensure consistency between them.
Further processing of the on-the-fly data to remove the some scanning artifacts was done using the algorithm described by Emerson & Gräve (1988). We used the FLYPLAIT implementation of this algorithm as described by Hoernes (1997) and Nieten (2001), which computes the FFT of the two sets of orthogonal scans and then performs a weighted addition in the Fourier transformed domain. The inverse FFT images have slightly lower noise levels and are free of residual scanning image defects. The resulting images were compared with comparably regridded and smoothed images to ensure that the FFT process did not introduce new features, flux offsets and the like. Finally, channel maps and integrated maps in suitable velocity intervals were created.
2.2 Heinrich Hertz Telescope observations
The CO(3-2) observations were performed with the Heinrich Hertz Telescope 111The HHT is operated by the Submillimeter Telescope Observatory on behalf of Steward Observatory and the MPI für Radioastronomie. (Baars et al. 1999), located at elevation 3178 m on Mt Graham, Arizona, during 1999 April, 1999 November, 2000 January and 2000 November. The HHT is a 10 m paraboloid with f/D=0.35, Nasmyth foci and surface accuracy better than m rms (i.e. at 345 GHz). The FWHM beam sizes are ″ , ″ and ″ at 490 GHz, 345 GHz and 230 GHz, respectively, while the absolute pointing accuracy is 1–3″ rms and the tracking precision is 02 rms (SMTO Electronic Newsletter 1998).
The backends used were two acousto-optical spectrometers, each with a total bandwidth of 1 GHz. For the CO(3-2) line observations one AOS was used for each linear polarization channel. The 345 GHz receiver is sensitive to both sidebands and the CO line was tuned to the lower sideband. The secondary mirror was ‘wobbled’ with a beam throw of 240″ in azimuth and scans obtained with emission–free reference positions on either side were coadded to ensure flat baselines.
All observations in the CO(3-2) line were performed with ; poorer conditions were used for CO(2-1) measurements. CO(4-3) observations were made when . The atmospheric fluctuations and the atmospheric model introduce a calibration uncertainty not greater than 5%. The HHT has no strong error beams at 345 GHz. This reduces the effect of source size on the appropriate source coupling efficiency. The forward efficiency, , is close to 1, and the uncertainty in introduces a 6% calibration uncertainty.
Pointing is controlled in software using a model determined by the observatory staff, and is based on measurements of temperature, elevation and the sky opacity at 230 GHz, which is obtained from a tilting radiometer. We made pointing observations of strong continuum sources at regular intervals and after sunset/sunrise, shutdowns and long telescope drives. Corrections obtained from these measurements suggest that our pointing was better than 4″ in 1999 November and 2000 January. For a 22″ beam, the resulting calibration uncertainty could result in an underestimate of the intensity of a point source of 9%, and less for extended sources.
Our calibration strategy follows that described in Sect. 8.2.5 of Rohlfs & Wilson (1996). After retuning and at frequent other intervals we measured the receiver temperature using an ambient load and a load at liquid nitrogen temperature. This was used to scale the online temperatures, which after baselines of order one (and, very occasionally, three) were subtracted to obtain our estimate of . We relate these observed values to a main-beam brightness temperature using using the efficiencies listed in Table 2. Any imbalance of the gains in the lower and upper sideband will increase the calibration errors as the hot/cold calibration signals and the atmospheric and receiver noise are present in both bands while we measure the line in only one band. Therefore in practice we measure standard Galactic line sources immediately before, during or after NGC 6946 and scale accordingly. For the 345 GHz receiver we do this separately for the two channels.
Our calibration strategy requires reliable standard line strengths for Galactic objects distributed over the sky. Unfortunately such a catalog does not exist at all submillimetre frequencies. Nevertheless we observed a few standard sources as often as was practicable, and included in every significant period of observing time an observation of the bright, distinctive central profile of NGC 6946. Our principal standard sources are Ceti, Ceti and IRC 10216 (Wang et al. 1994; Stanek et al. 1995; Young 1995; Knapp et al. 1995) and those in Mauersberger et al. (1999).
Although the 12CO(3-2) observations are the result of several observing sessions at widely separated epoch, the inter-epoch calibration reliability is much higher than the absolute calibration. Furthermore, observations were repeated many times so that lines at all positions are detected with a significance of or more.
3 Results
3.1 Morphology of the molecular gas
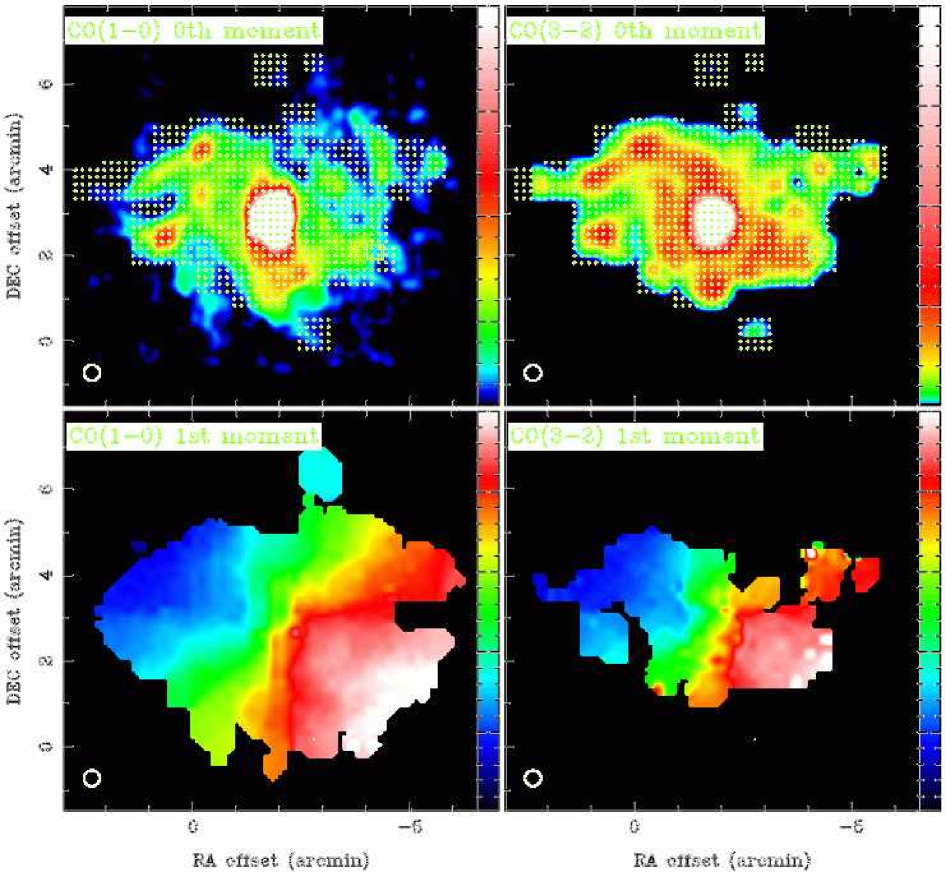
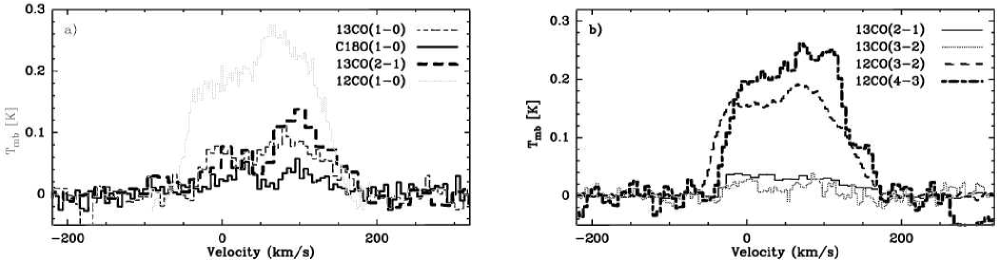
Fig. 2 shows the main observational results of this study: the 12CO(1-0) and 12CO(3-2) images of NGC 6946 and the velocity fields derived from these datasets. For the purposes of line ratio studies, observations of selected regions were also made in the 13CO(1-0), 13CO(2-1), 13CO(3-2), 12CO(4-3) and 12C18O(1-0) lines. A selection of these spectra is shown in Fig. 3 and listed in Table 3: other positions will be the subject of a forthcoming paper.
|
-
a
Offset in arcseconds relative to = 20:34:52.3 (J2000) = 60:09:14.2 (J2000).
-
b
All signal-to-noise values S/N were calculated from spectra with velocity resolution 10 km s-1.
-
c
Beamsize in arcseconds.
-
d
Beamsize correction factor for regions not mapped and smoothed.
The CO images in Fig. 2 are presented so that only emission detected with a significance of 3 or more is displayed. In both the 12CO(1-0) and 12CO(3-2) images, the bright inner region around the nucleus and bar contains far the brightest emission. This feature is extended north-south in both images, approximately in line with the inner molecular bar, reported to have a position angle of by Ishizuki et al. (1990) and Regan & Vogel (1995). The region of central concentration is not symmetric, extending further southwards and westwards. As is the case in the MIR images of Dale et al. (1999; 2000), our radio continuum images, the [CII] images of Madden et al. (1993) and the X-ray images of Schlegel (1994) and Schlegel et al. (2000), a diffuse emission component is also evident in addition to concentrations in the centre and in the vicinity of the spiral arms. The diffuse 12CO(1-0) emission is stronger and more extended on the eastern side: a square area of 9 kpc2 immediately east of the nucleus (excluding the NE spiral arm) has 2.0 times as much 12CO(1-0) emission as the same area west of the nucleus.
The 12CO(3-2) line is generally thought to trace a warmer and denser component of the ISM than the 12CO(1-0), and thus one might expect it to be concentrated in the spiral arms and in other regions of current and recent active star formation (SF). Indeed the centre of the 12CO(3-2) image contains by far the strongest emission, and strong emission is also seen in several locations that are also strong in H and radio thermal continuum (c.f. Fig. 9). The two regions of most prominent 12CO(3-2) emission are both located in the eastern spiral arms (at and (J2000)). Both of these “hotspots” are also prominent in the ISO 7 and 15 m images. This suggests that the corresponding emission in the ISO images is indeed due to dust associated with gas, and not due to K giant stars.
The 12CO(3-2) image is less extensive than the 12CO(1-0) image since less of the disk was observed than was possible at the lower frequency. The 12CO(3-2) images also contains considerable diffuse emission between the hotspots and the spiral arms indicating that, as in the Galaxy (Solomon et al. 1985), molecular clouds containing warm and dense gas are distributed throughout the inner disk of NGC 6946. Detection of such extended 12CO(3-2) emission is a novel and significant result. Until recently, observations of higher–J CO transitions have generally been restricted to the central regions of galaxies, where conditions of dense gas and intense SF, which tends to heat the gas by way of radiation from young stars, are found. Figure 2 shows, however, that the 12CO(3-2) line is detectable over several kiloparsecs both within the spiral arms in NGC 6946 and throughout the inner disk generally. In a series of recent observations Wielebinski et al. (1999), Nieten et al. (1999), Dumke et al. (2001) and Walsh et al. (2002) also report the discovery of emission in the 12CO(3-2) line extended throughout the disks of several spiral and irregular galaxies.
The strongest 12CO(1-0) emission in the outer disk coincides with the four main spiral arms seen in - and -band optical images. Two particularly bright regions occur in two of the spiral arms east of the nucleus (around = 20:35:12.3 = 60:08:53.1 (J2000) and = 20:35:26.8 = 60:11:05.1 (J2000)). Both of these regions are coincident with bright H emission and peaks in the 12CO(3-2) image. The 12CO(1-0) emission is not especially strong in the vicinity of the the location of the young globular cluster reported by Elmegreen et al. (2000), the molecular gas having perhaps been consumed or dissociated by the formation of the cluster.
Interarm contrast is an important quantity for constraining spiral density wave models, but it is difficult to quantify as the definition of where the arms end is problematic. However, NGC 6946 is relatively face–on and has distinct interarm regions larger than our CO beamwidth where the optical contrast is high. In 12CO(3-2) the arm–interarm contrast, measured over two 3 kpc2 areas located inside and immediately south of the NE spiral arm, is , while over the same areas the contrast in 12CO(1-0) is , similar to that of the H i gas (Fig. 9) which is over the same area. The ratio of the maximum to minimum H i column density is greater than 4.5 in the NE arm, whereas the 12CO(1-0) emission varies only by about a factor of 2.4 over the same regions of maximum H i interarm contrast (for example, around = 20:35:12.7 = 60:09:36.8 (J2000)). The 12CO(3-2) maximum to minimum variation in this region is about 5.9. If molecular hydrogen is not being converted into or created from atomic gas (c.f. Tilanus & Allen 1989), then continuity considerations require that the ratio of the mass in the spiral arms to the mass in the interarm regions equals the ratio of the time the gas spends in each. The similar contrasts in 12CO(1-0) and H i gas may indicate that the molecular gas is forming from the atomic in these regions of the disk. The significant difference in the 12CO(1-0)–12CO(3-2) arm-interarm contrasts seen in NGC 6946 suggests that molecules are warmer or reside for longer in the spiral arms.
The radial distribution of 12CO(1-0) in Fig. 4 was produced by averaging in concentric elliptical annuli, using the disk orientation parameters from the kinematical analysis of Carignan et al. (1990). The azimuthally–averaged radial 12CO(1-0) distribution shows how the molecular emission is strongly concentrated towards the centre, with a steep incline within the inner 2 kpc.

3.2 CO kinematics
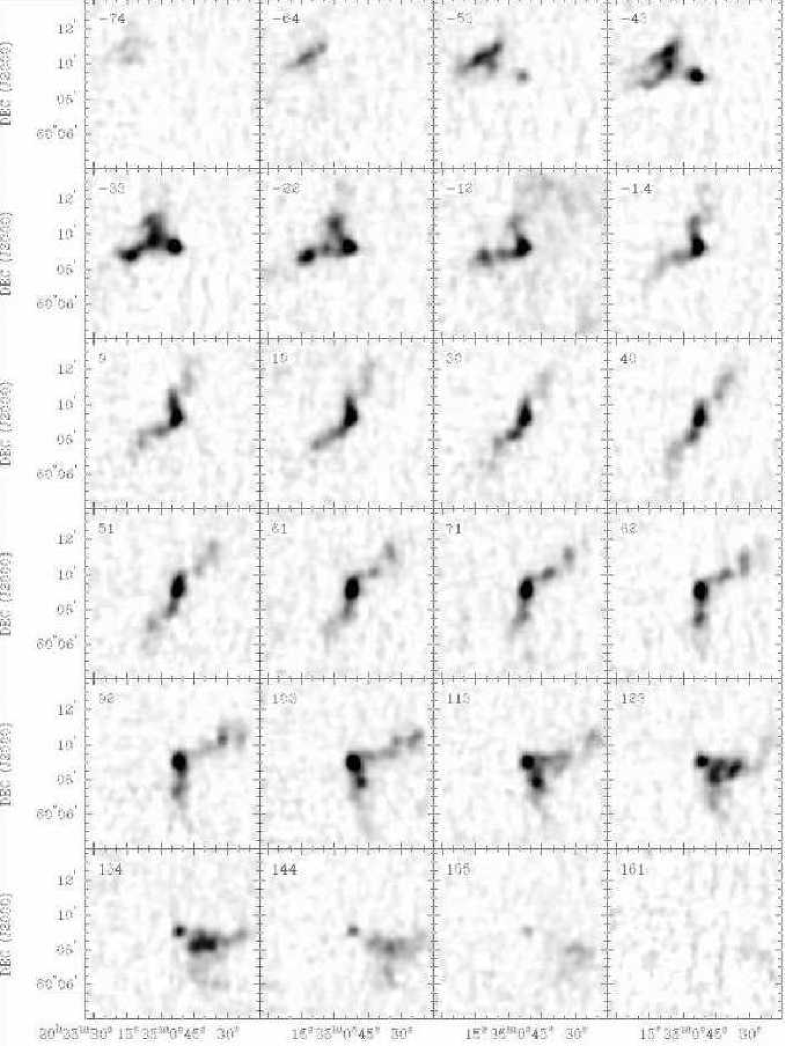
The 12CO(1-0) velocity field (Fig. 2) exhibits the large-scale signature of a rotating disk, as does Fig. 5, which shows images of NGC 6946 made in 24 channels, each approximately 10 km s-1 wide. Some departures from circular motion are evident in the shape of the isovelocity contours, particularly northeast of the nucleus (also the channel at -43 km s-1). These irregularities in the velocity field may be associated with the density wave in the northern arm. Figure 5 shows that, in the inner 590 pc, emission is detected over a deprojected range of 336 km s-1. A steeply–rising central CO rotation curve, is also seen in the nuclear disk of the Galaxy (Dame et al. 2001) and in IC 342 and Maffei 2 (Turner & Hurt 1992).
To derive the kinematic parameters from the 12CO(1-0) velocity field, the method described by Begeman (1989) and implemented in the AIPS tasks ROCUR and GAL is used, although this standard rotation curve analysis is not well suited to a galaxy as close to face–on as NGC 6946. The procedure fits, by least–squares, inclined rings rotating in circular motion to the velocity field. The width of the rings is 250, which is slightly larger than the 12CO(1-0) cube’s beam. The initial parameter estimates are taken from Carignan et al. (1990) and ellipse fits to the –band image of Elmegreen (2000). Points within of the minor axis are excluded (although little change in the fit results if these points are not excluded) and a weighting is applied. In the first iteration, (, ) marks the position of the rotation centre of each ring and , , , , and , are solved for simultaneously. The kinematic centre of the molecular disk of NGC 6946 is found to lie at , . Within the errors, this position is coincident with the centre of the optical nucleus and the nucleus in radio continuum. The systemic velocity km s-1 is in excellent agreement with the the values found by other authors.
The kinematic centre and systemic velocity are well constrained and are held fixed for every ring. Numerous fitting strategies were attempted to estimate the variation of , and with radius. Coupling between parameters makes a final choice of kinematic parameters somewhat subjective for NGC 6946. The rotation curve shown in Fig. 7 was determined allowing the inclination and position angle to vary freely, and the run of these parameters is also shown in Fig. 7. The best-fitting inclination at radii less than 200″ appears to be always greater than the usually quoted for NGC 6946.

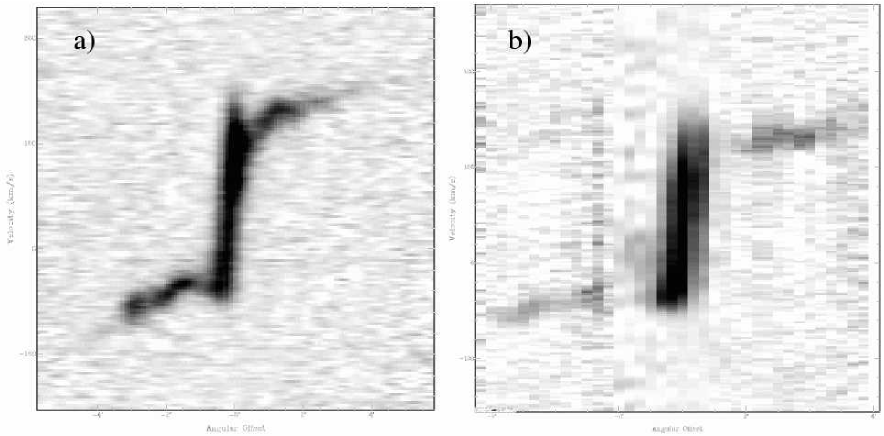
The PV diagram, Fig. 6, reveals a central asymmetry in NGC 6946. Rapidly declining rotation of about 10–20% of the peak rotation velocity is evident in the inner arcminute of the galaxy, whereas beyond this radius the rotation curve starts rising again up to a maximum deprojected velocity of some 170 km s-1. There is a suggestion that at some locations the 12CO(1-0) and the 12CO(3-2) components trace somewhat different dynamical regimes, as the 12CO(3-2) PV diagram, which has identical spatial and velocity resolution to the 12CO(1-0) data, does not show the innermost decline on the receding side, nor the kink at radius 15 on the approaching side. The 12CO(3-2) rotation curve appears somewhat asymmetric. On the receding side, the velocities remain constant with a deprojected velocity of 160 km s-1 while on the approaching side the 12CO(3-2) rotation curve climbs monotonically to a maximum deprojected velocity of 170 km s-1. The central “dip” evident in the 12CO(1-0) PV diagram is not evident in the 12CO(3-2) spectra, which unfortunately are very weak in the region immediately beyond the centre at radii where the 12CO(1-0) declines. A difference image made by subtracting the two CO velocity fields shows now large-scale structure.
As discussed by Sofue et al. (1988) the central CO spectra, as seen in Fig. 6, show velocities rising above the general trend of the rotation curve. This high velocity emission may arise from a “core” region of molecular clouds moving in orbits not confined to the disk. We note, however, that the rotation curve presented in Fig. 7 indicates that the rotation derived from our CO(1-0) data agrees very closely with the H i rotation curve of Carignan et al. (1990) and is also very similar to that shown by Rogstad & Shostak (1972), but differs considerably in both shape and amplitude from that of Sofue (1996). This difference cannot be accounted for solely on the basis of Sofue’s higher spatial resolution (a beam-smeared model of a disk with his rotation curve is still 20 km s-1 higher than ours) and differing estimates of NGC 6946’s kinematic parameters. This discrepancy warrants further study. That the 12CO(1-0) rotation curve follows that of the H i supports the argument of Lavezzi & Dickey (1998) that CO linewidths can be indicative of the amplitude of rotation in late type disk galaxies.
The projected velocity width integrated over one beamwidth of the central region is 207 km s-1. From we estimate a total dynamical mass enclosed within this core of , of which at least is molecular gas (see below).
The second moment images show that, in the central 2 kpc, the average velocity dispersion of the 12CO(3-2) gas is km s-1 while for the 12CO(1-0) the dispersion is km s-1. In an equivalent area located in the disk, east of the nuclear region, the average 12CO(3-2) gas velocity dispersion is km s-1 while for the 12CO(1-0) the dispersion is km s-1. Thus, within the uncertainties, the velocity dispersion of the two molecular tracers is the same. Blitz et al. (1984) find an average velocity dispersion of km s-1 for nearby high latitude clouds, while Stark (1984), Stark and Brand (1989) and Malhotra (1994) find velocity dispersions of km s-1 using differing analyses of Galactic clouds. Malhotra (1994) finds an increase in Galactic molecular cloud velocity dispersion with radius, which is not seen in NGC 6946. Combes & Becquaert (1997), who observe average molecular velocity dispersions of km s-1 and km s-1 in NGC 628 and NGC 3938 respectively, also do not observe radial trends, and suggest that HI and molecular clouds are well-mixed, forming a single kinematic gas component. Our values for the velocity dispersion in NGC 6946 are thus similar to those found in the Galaxy and in other nearby spirals.
One notable aspect of the 12CO(1-0) second moment image is that, apart from increased dispersion in the centre, it is featureless. Neither the spiral arms, nor the regions of high star formation (c.f. Fig.s 9, 11) are traced by regions of higher dispersion. This suggests that the observed dispersion is due to motions of cool individual clouds within the beam, rather than thermal broadening. As is generally the case for atomic gas in spiral galaxies, where the HI gas generally has dispersion km s-1 (e.g. Kamphuis 1993; Walsh 1997) within the bright optical disk (and not less than km s-1 outside it), the molecular gas appears to have a constant dispersion over the disk of NGC 6946. This result conflicts with the suggestion (Sellwood & Balbus 1999) that MHD-driven turbulence is the principal contributor to cloud dispersions. Sellwood & Balbus estimate that a G field gives rise to km s-1 turbulence in neutral clouds in the outer disk of NGC 1058: the magnetic field in the disk of NGC 6946 has a peak strength G and is highly variable spatially.
3.3 Molecular gas mass in NGC 6946
The conversion of integrated line intensity of a trace molecule like CO to surface mass density of molecular hydrogen involves making a series of assumptions, all of which are known in at least some cases to be poorly justified (Morris & Rickard 1982). The strength of the CO line depends on the CO abundance, density, temperature and optical depth of the line (e.g. Weiss et al. 2001). Metallicity further influences the CO-H2 conversion due to the effects of dust. More dust results in increased efficiency of H2 molecule production, and increased UV absorption, which in turn reduces the rate of dissociation (Verter & Hodge 1995; Arimoto et al. 1996). Although the principal CO heating mechanism is collisions with H2 molecules, heating by the UV radiation field can play an important role, particularly as most of the radiation emitted by molecular clouds comes from photodissociation regions (Hollenbach & Tielens 1997), which are UV-illuminated regions in molecular clouds of intermediate density and optical depth (A). Low energy cosmic rays can also contribute to the heating (Glassgold & Langer 1973).
The observed correlation between 12CO(1-0) luminosity with molecular mass (Solomon et al. 1987; Combes 1999) has a long history of theoretical support (e.g. Penzias et al. 1972; Mauersberger & Henkel 1993). Strong (1994) points out that CO emission is well correlated with gamma rays on large scales. One line of argument states that, if the beam-averaged cloud ensemble consists of small, clumpy and macroturbulent objects having little radiative coupling between them (and a low volume filling factor so that there is not much overlap within the beam on the scale of a face-on galaxy), the CO emission is proportional to the total number of clumps and therefore also the total mass (Wolfire et al. 1993). This may at least be justified for the bulk of the gas in relatively diffuse clumps, assuming that clouds are similar from galaxy to galaxy. In galaxies like our own where the emission comes from both diffuse gas and molecular clouds, there does not appear to be a large variation in the CO-to-total molecular mass conversion factor, , although the statistics are small. The conversion factor is currently the subject of much discussion. For consistency with other authors we assume the commonly applied “standard Galactic” value of (Strong et al. 1988), although this value possibly overestimates the true H2 mass in NGC 6946. This value can be compared with independently estimated values from EGRET of (Hunter et al. 1997). Integrating the total 12CO(1-0) flux from our IRAM data cube we obtain I(CO) = Jy km s-1 over a solid angle of sr, which gives a mean integrated emission per beam area of (CO) K km s-1. Using the relation for the conversion of CO line intensity into H2 column density given by Strong et al. (1988), we calculate a mean column density of . Using the above solid angle and our adopted distance of 5.5 Mpc we obtain an estimate of the total molecular mass of M.
We note that the conversion factor is in fact very likely to be different for centre and disk, as it is well known that it differs considerably for dense and diffuse gas. It has been suggested (Lequeux 1995; Solomon et al. 1997; Papadopolous & Allen 2000) that CO intensities can overestimate molecular mass in the central regions of starburst galaxies. Therefore, using a value of for the central 1.5 kpc of NGC 6946, we obtain a total molecular gas mass of for the central 1 kpc region, and a revised total molecular gas mass of for NGC 6946. Valentijn et al. (1996) place an upper limit of for the mass of molecular gas in the central 5″ region, and Ishizuki et al. (1990) estimate a similar amount within the inner 300 pc of NGC 6946.
Another caveat to the total gas mass determination is the fact that optically thin CO emission has been reported in the centres of some galaxies, on the basis of high CO(2-1)/CO(1-0) line ratios (Knapp et al. 1980; Wall et al. 1993). Wall et al. (1993) used matched 20″ beams to compare the first 3 J CO transitions in the centre of NGC 6946 and Valentijn et al. (1996) compared various estimates of the central mass in NGC 6946 with the result that the H2 mass within must be in the range 2.2 – 30 .
The optically thin thermal emission from dust grains in “standard” interstellar clouds is proportional to the hydrogen column density, , with some dependence on grain properties such as size, temperature and composition (Braine et al. 1997). Thus we can compare the gas mass obtained here with estimates from dust emission. For example, using the dust mass estimates for NGC 6946 from Alton et al. (1998) listed in Table 1 and the dust-to-gas mass ratios for nearby spiral galaxies (Issa et al. 1990), we estimate a total gas mass for NGC 6946 of 1.0 - 4.7. The range of values encompasses the total gas mass estimated above using the standard Galactic conversion factor, which itself is in good agreement with previous estimates of the total molecular gas in NGC 6946 (c.f. Table 1). We thus confirm that the molecular component in NGC 6946 is almost as massive as the atomic gas mass, with . Compared with a median value of 0.024 for 27 Scd galaxies (Casoli et al. 1998), our result shows that NGC 6946 has an exceptionally massive molecular gas component, though it is not as extreme an example as M51, with (Nakai & Kuno 1995).
The total molecular gas mass estimated here agrees well with previous estimates by Young & Scoville (1982) and Tacconi & Young (1986). This mass represents about an order of magnitude more molecular gas mass than is typical for spiral galaxies (Boselli et al. 1997; Casoli et al. 1998) and is even comparable with the largest molecular gas mass ( ) found for a sample of interacting galaxies studied by Horellou & Booth (1997).
3.4 Line ratio analysis of the ISM in NGC 6946
The J=4 to 1 levels of the CO molecule are 55, 33, 17 and 5.5 K above the ground level, respectively, and generally their emission traces gas of corresponding excitation temperatures. However, to reliably decouple temperature, density and optical depth effects, measurement of more than one of these transitions, and ideally more than one isotopomer, is required. In the context of radiative transfer models, temperatures of T K and densities n(H cm-3 occur if the CO(3-2)/CO(1-0) line ratio is around 1.0.
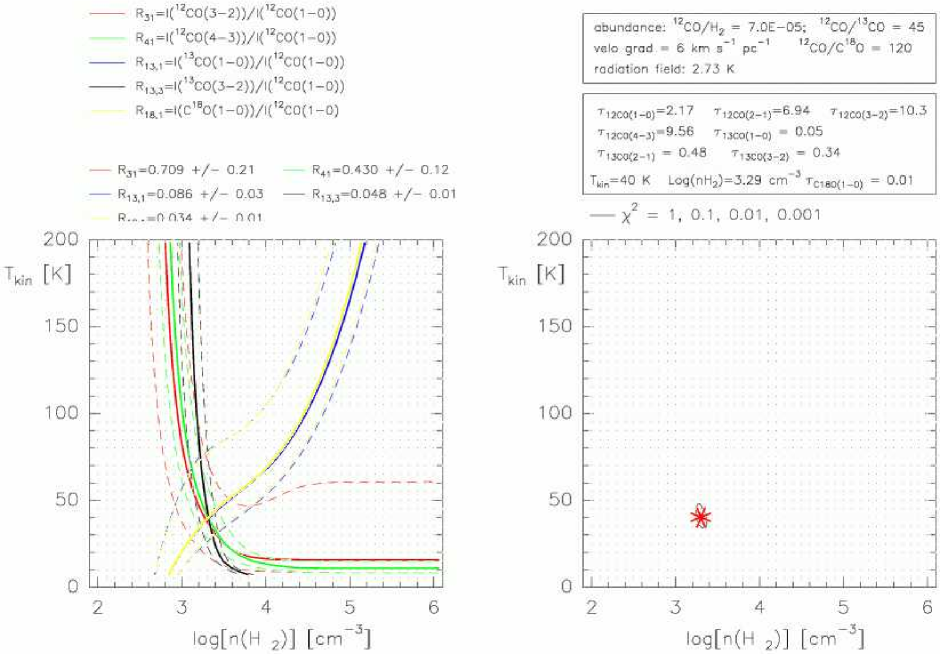
In this section, we carry out radiative transfer calculations for the excitation of the various 12CO and 13CO transitions using the Large Velocity Gradient (LVG) approximation (Goldreich & Kwan 1974) with collision rates taken from Green & Chapman (1978) to explore non-LTE conditions. Our LVG radiative transfer program is based on that described by Henkel (1980), and fully described in Weiss (2000) and Weiss et al. (2001).
The model assumes a spherical, isothermal one-component ISM with a velocity gradient sufficiently large to ensure that the source function is locally defined (c.f. Mao et al. 2001). For optically thin CO(1-0), the thermalization density is about 740 cm-3 while the highest density for which CO intensities change significantly with H2 density is a few times . We thus calculate LVG line intensities for a kinetic temperature and density range from 5 K to 200 K by 5 K and from to by , respectively. In addition, we vary the CO abundance relative to , [CO], per velocity gradient and the fractional and abundances ([CO]/grad(V): to by : 30 to 100 by 5; [CO]/[]: 100 to 300 by 20). For the comparison between the observed peak intensity ratios and the predicted LVG ratios we use a test. We use the peak values of the spectra from the 12CO(1-0) and 12CO(3-2) data cubes described in the previous sections, together with several pointed observation, the results of which are listed in Table 3.
When comparing line profiles it is important to ensure that the same regions in the galaxy are being probed by the different line observations. We have mapped areas near the centre of NGC 6946 in the 12CO(1-0), 12CO(3-2), 13CO(3-2) and 12CO(4-3) lines. The beam of the 30-m Pico Veleta telescope at 115 GHz is a very close match to the beam of the 10-m HHT at 345 GHz, and all maps were smoothed, using a circular Gaussian, to a common resolution of 22″. In Table 3 we list the beamsizes for all transitions observed. The beamsizes have been estimated by assuming that the ratio of the well-measured beamsizes listed in Sect. 2 to the resolution expected for these beams from also applies to nearby frequencies. Where mapped observations were not available, we estimate a correction factor, using a standard technique. The correction factors, , listed in Table 3 are estimated using where is the beamsize measured, is the beamsize with which this observation is to compared, and is the estimated angular extent of the source. We use the 12CO(1-0) and 12CO(3-2) images to estimate the angular extent of the sources. We note that in each case the correction factors are close to unity, and the implied corrections are of the same order as the uncertainties in the line calibrations. For the CO(2-1) lines we have the added check that measurements were made using both the 30-m and the 10-m telescopes.
The resulting total column density comes from the CO and densities, the velocity gradient and the observed line widths using N(CO) = and N(H2) = , where is the observed line width. A summary of the results is given in Table 4.
|
||||||||||||||||||||||||||||||||||||||||||||||||||||||||||||||||||||||||||||||
-
Note: the positions here are defined as offset in arcsec from the central position listed in Table 1.
The LVG model’s results are listed in Table 4, and for the position whose offset in arcsec from the central position listed in Table 1 is (0,0), the results are also shown in Fig. 8. The solid lines on the left hand plot in Fig. 8 trace those regions of the temperature and density where observed ratios agree with the predicted ratios, within the errors (the dotted lines). The right hand plot shows contours of resulting from a test of the predicted line ratios compared with the observed ratios, for the parameters varied. Figure 8 shows how the different line ratios tightly constrain the temperature and density at the central location of NGC 6946 (c.f. Weiss 2000).
At position (0,0), the best fitting beam-averaged kinetic temperature is 40 K and the molecular gas density is log(n(H2))= 3.3 cm-3, while at position (20,0), the temperature is 25 K and log(n(H2))= 3.1 cm-3. At both of these positions the optical depth of the 12CO(3-2) line is high, with . At position (110,100), located in the north-eastern spiral arm, the temperature is 15 K and the density is log(n(H2))= 3.0 cm-3. In the central position the 0.59 kpc beam likely averages molecular clouds over a wide range of environmental conditions. Nevertheless, the derived values are significantly different, with considerably higher temperatures and densities than the position in the spiral arm. Our results support those of Wall et al. (1993) who used a similar analysis to show that a warm (T K) plus a cool gas component exist within a 20″ beamwidth at the center of NGC 6946. Our results indicate that the relative abundance of the warm component is much less in the spiral arm than in the center.
The 2-D analysis (Sect. 4.2) suggests that dust and molecular gas are a similarly distributed. The resulting temperature of 40 K for the molecular gas can be compared with the estimated thermal temperature of the 60-100 m-emitting dust of Devereux & Young (1993) who consider the flux ratio within to conclude that this dust, which comprises only 10% of the total dust mass, has a thermal temperature of 28–33 K.
4 Large-scale properties of NGC 6946’s disk
The dataset used for this part of the study is presented in Fig. 9, where all images have been smoothed to have the same resolution of 22″. We have available images of NGC 6946 in the following wavebands, which are assumed to reflect the following characteristic physical processes:
-
•
UBVRI-band optical light (Elmegreen et al. 2000). The and band images trace old stellar populations and are relatively unextincted so that they are reasonable probes of the bulk of the stellar mass. Since half the -band light originates in population I stars (e.g. Young et al. 1985) younger than yr, it is indicative of SF over that period (Tacconi & Young 1986).
-
•
An optical extinction image, tracing obscuring dust from Trewhella (1998).
-
•
The H emission (Ferguson et al. 1998) traces hydrogen ionised by young ( yr), massive () O and B stars in regions of currently active star formation (Kennicutt 1983). The considerable H extinction present in NGC 6946 (Devereux & Young 1993) should be borne in mind when considering the radial surface brightness profile, and it has recently been claimed that SF rates determined solely from H can underestimate the true value by 50% (Patel & Wilson 1995).
-
•
The ISOCAM m and m images of Dale et al. (1999; 2000) reflect the presence of the small, warm dust grains that are considered to be the most effective at converting incident UV flux on a molecular cloud into kinetic energy of the molecular gas (Siebenmorgen & Krügel 1992; Hollenbach & Tielens 1997). Another contribution also comes from PAH molecules, whose radiation does not reflect an equilibrium with the local radiation field.
-
•
We do not have an image of suitable spatial resolution in far-IR light (72% of which comes from dust
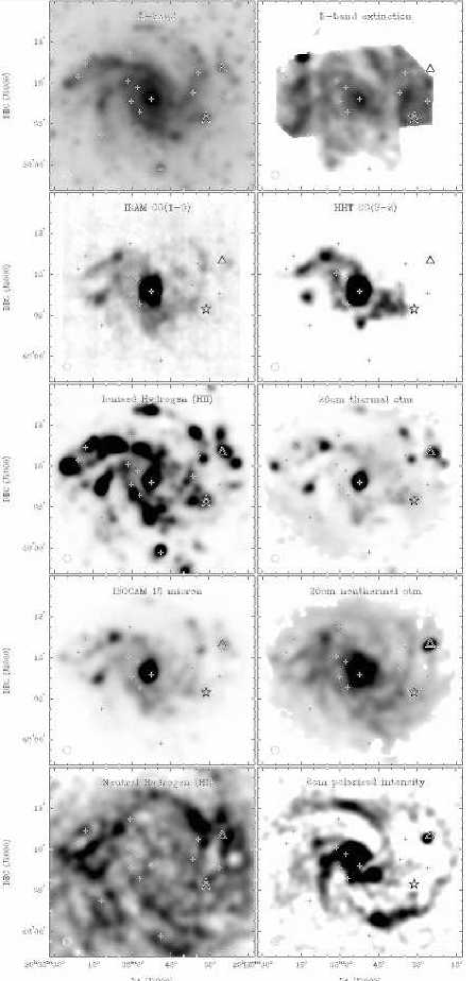
Figure 9: Summary of the datasets in various wavebands available for NGC 6946. All images have been smoothed to have the same 22″ resolution as the 12CO(1-0) data. The locations of the X-ray point sources discussed by Schlegel et al. (2000) are represented by small crosses, the large young stellar cluster identified by Elmegreen et al. (2000) is shown as a star and a triangle marks the location of a very bright, polarised radio continuum source. in NGC 6946, with the rest from stars; Sauty et al. (1995)). Thus we use the radial profile presented by Devereux & Young (1993) to trace the bulk of the dust mass.
-
•
The 12CO(3-2) and 12CO(1-0) images presented in this paper, representing the molecular gas.
-
•
The H i image from Kamphuis & Sancisi (1993).
-
•
The total radio continuum 6 cm image (Beck & Hoernes 1996) shows strong emission in NGC 6946 indicating the presence of strong magnetic fields and high cosmic-ray energy density.
-
•
From the polarised radio 6 cm image (Beck & Hoernes 1996) we trace the regular part of the magnetic field. Magnetic field lines should follow the stream lines of the gas if the density wave compresses gas and fields in a shock front (e.g. Roberts & Yuan 1970). However, the polarised intensity is concentrated between the spiral arms and may be regarded as phase-shifted images of the gas arms (Frick et al. 2000).
-
•
The radio spectral index image is calculated from 3 cm (VLA and Effelsberg) and 20 cm (VLA) images (Beck, unpublished) and allows us to separate the thermal and nonthermal emission components by assuming that the average spectral index between the spiral arms of -0.95 represents that of the synchrotron radiation and that any flatter spectra are due to a thermal contribution.
-
•
The thermal radio continuum 20 cm image traces free-free emission caused by the ionizing flux of O and B stars.
-
•
The nonthermal radio continuum 20 cm image, which shows the synchrotron radiation from relativistic electrons in NGC 6946’s magnetic field, may be expected to be correlated with molecular gas as the supernova remnants embedded in the ISM are the sources of cosmic-ray particles. However, in case of (often assumed) equipartition between the energy densities of cosmic rays and magnetic fields, the field strength is the dominant parameter for synchrotron intensity (see Sect. 5.2).
4.1 One-dimensional properties of the disk
The radial surface brightness profile of the optical light of a spiral galaxy can generally be separated into a central spheroid and a flattened disk component. The optical disk can almost always be well fitted with a function of the form where is the intensity at radius , is the intensity at and is the exponential scale length. Such a fitting function is often a good match to azimuthally averaged profiles of the atomic and molecular gas as well. Knapen & van der Kruit (1991) point out that different authors often report significantly different scale lengths for the same galaxy and stress the care that must be taken to obtain a reliable value. To ensure that fitting errors are minimal, we attempt to obtain the brightness profiles directly from the data in a uniform manner.
The azimuthally-averaged radial distributions of various tracers are presented in Fig. 10 and the results of least squares fitting to the profiles are listed in Table 5. All profiles are obtained by deprojecting the galaxy assuming an inclination of and a position angle of (Carignan et al. 1990).

The fitting is done only to the region beyond the “nuclear concentration”, where a second exponential disk with a much steeper profile is more appropriate. Sofue et al. (1988) assert that this nuclear concentration is a structure distinct from the extended disk. The FIR points in Fig. 10 are taken from Table 2 of Devereux & Young (1993). The optical, H, MIR and H i data are from Larsen & Richter (1999), Ferguson et al. (1998), Dale et al. (2000) and Kamphuis & Sancisi (1993), respectively, kindly provided by those authors. The radio continuum data are described in more detail in Beck (1991) and Beck & Hoernes (1996).
|
||||||||||||||||||||||||||||||||||||||||||||||||||||||||||||||||||||||||||||||||||||||||||||||||||||||||||||||||
-
a
1 = Larsen & Richter (1999); 2 = Lasker et al. (1990); 3 = Malhotra et al. (1996); 4 = Dettmar (priv. comm.); 5 = Ferguson et al. (1998); 6 = this paper; 7 = Kamphuis & Sancisi (1993); 8 = Dale et al. (1999); 9 = Devereux & Young (1993)
The optical data from Larsen & Richter (1999) do not cover the entire disk of NGC 6946 so the radial profiles are only reliable out to a radius of about 200″. Nevertheless, from Fig. 10 and Table 5 it can be seen that there are significant differences between the optical scale lengths within the inner few kpc of the disk, where the relative photometry is likely to be reliable. The inset in Fig. 10 shows the colour gradient to be strongly negative, as expected for a dusty, late type galaxy (Wirth & Shaw 1983; Balcells & Peletier 1994). This colour gradient is also dramatically evident in Fig. 1 of Elmegreen et al. (2000), a true-colour representation of NGC 6946 using this same optical data. Baffa et al. (1990) have previously found evidence for strong NIR-optical colour gradients in NGC 6946, which they ascribe to intrinsic reddening. A image (e.g. Trewhella 1998) shows the considerable Galactic extinction in NGC 6946 (A, A, A, A, A: Schlegel et al. (1998)), which makes it difficult to interpret the colours of NGC 6946’s components in terms of stellar populations.
Ryder and Dopita (1994) find that, for a sample of 34 spiral galaxies, the H scale length in the outer disk is significantly longer than the scale length. This is not the case in NGC 6946, where, within the uncertainties, the scale lengths are equal, and possibly the H scale length is marginally shorter than the optical values if the Ferguson et al. (1998) dataset is considered.
The bright, starbursting centre of NGC 6946 (Engelbracht 1996) can be seen in the rapidly rising optical radial surface brightness profiles, and, within a radius of 1.5 kpc, the 12CO(1-0), 12CO(3-2) , H, total 6 cm, 20 cm thermal and nonthermal radio continuum emission and the 15 m profiles also show a steep rise.
|
-
a
The 12CO(3-2) image has too few independent data points for reliable correlations.
The H i profile, as noted by Rogstad & Shostak (1972), shows a slight decline towards the centre, as does the polarised intensity profile. The H i in NGC 6946 was noted by Tacconi & Young (1986) to differ from other tracers: it does not clearly follow spiral arms, unlike many other spiral galaxies for which interferometric H i data are available. The inner four spiral arms are not distinguishable at all and the inner H i disk is quite irregular. Some H hotspots are also H i concentrations, but not all, and there are many regions with H but where the H i is very weak. Although the very faint H arm in the north does have a clear H i counterpart, there is a long arm segment in the SW that is not discussed further here as it is located at a radius beyond all the other tracers’ limits.
The 12CO(3-2) scale length is the shortest measured, since the warm gas leading to emission of the 12CO(3-2) line is commonest in the densest and most active regions, which are concentrated towards the centre. The 12CO(3-2) profile in Fig. 10 appears, within the uncertainties, to follow the H, both in the approximate slope and shape (central steepening and slight bump at 100″).
The most striking aspect of Fig. 10 is that, although all profiles are clearly not well represented by single exponentials, and differ amongst one another greatly, the VRI, H, 15 m, 12CO(1-0) and FIR scale lengths over several kpc are the same to within 5%. Close correspondence between some of these profiles has been noted before by deGioia-Eastwood et al. (1984), Tacconi & Young (1986), Sofue et al. (1988), Devereux & Young (1993) and Malhotra et al. (1996).
The scale length of the thermal radio emission in Table 5 is very large, much larger than that of the H emission. Absorption in the H line is stronger in the inner region, so the H scale length in Table 5 is an upper limit, making the difference to the thermal radio emission even larger. We propose as an explanation an artifact of the thermal-nonthermal separation. According to Fig. 10, the radial profile of the thermal radio emission becomes flat in its outer part. Here, observational uncertainties in the baselevels and the spectral indices may cause a systematic overestimate of the thermal emission.
4.2 Two-dimensional correlation analysis of the disk
Combining an image into a line and then further reducing the line to a single value - the scale length - clearly discards much information. In this section we attempt to use the full 2-D distributions at various wavelengths to investigate, by correlating images, the relationship between the ISM’s components, the morphology, magnetic field and the SF in NGC 6946’s disk.
The correlations are determined using an algorithm that measures the logarithm of the intensity in the same spatial region in two images (Nieten 2001). The correlation is determined using a variety of different gridding and weighting schemes. The results presented here use 1/ weighting, where is the rms noise in each image. Four different hexagonal grids are used for each correlation to assess the effect of gridding on the resulting correlations, and a mean value adopted. The difference in the correlation coefficient for orthogonal or slightly offset hexagonal grids is typically a few percent. Only spatially independent points are selected. The Gaussian nature of the radio telescope beams means that the definition of “adjacent independent data points” is not well defined. Simulations using artificial data indicate that selecting regions separated by 1.98 beamwidths, at which point the Gaussians overlap by only 2% in one dimension, is a good compromise between independence and maximal data usage.
Care is taken to ensure that accurate zero levels are subtracted from each data point before the correlation is calculated. To reduce the effect of errors due to baselevel uncertainties and noise fluctuations, only datapoints with amplitudes of five times the rms noise are used. Thus both the magnitude of the resulting correlation and also the slope of the regression line can in principle contain physical information.
Since the physical processes associated with the central starburst are likely to be of a fundamentally different character to those occurring in the disk (Helfer & Blitz 1997), we excluded the points in the innermost (deprojected) arcminute of NGC 6946. For most images this had the effect of excising the few highest intensity values, which are few in number. For the 6cm images, a strong background source on the western side of the galaxy is removed before correlating.
The Pearson value measures a relation between two variables only to the extent to which it is linear. Since the most common relationships between variables of astrophysical interest is a power law, we correlated the logarithm of the intensities rather than the raw values. We then created a correlation matrix between all observed variables and inspected the values for expected and unexpected relations between variables, given the relative quality of the data. The results of this analysis is presented in Table 6. The slope of the regression line, the (Pearson’s ) correlation coefficient and the Student’s t value are listed. is the coefficient of determination, which measures the strength of the relationship between the two variables, while is a measure of the significance of the correlation.
The significance of the correlations is not well determined. One problem is that, due to the effect of noise making smaller values less reliable, in no case are the errors (deviations from the regression line) normally distributed. Thus our measure of the significance of the correlations is not well justified since the variability of the dependent variables is not normally distributed, nor is the variability the same for all values of the dependent variable. However, this problem becomes less important as more independent data points are included in the correlation. When the number of points exceeds 50, Monte Carlo simulations suggest that the error distribution does not introduce serious biases, and when the number exceeds 100, the non-normal error distribution does not significantly affect the result of the correlation analysis. We considered the effect of outliers on the value of the correlations by inspecting the scatter plots individually. Since most of the images are of high quality over the area common to all of them or are heavily spatially smoothed to the resolution of the CO data, the above condition is easily met for all images, except the 12CO(3-2) data which has a limited spatial extent. Each correlation is the result of between 95 and 312 independent data points. As the reliability of the correlation coefficient increases with its absolute value, relatively small differences between large correlation coefficients can be significant. As a guideline, well-correlated samples in our dataset have values of 12 or higher.
The strongest correlations, all of which have high statistical significance, are: 7 m–6 cm total power, 7 m–R-band, 6 cm–nonthermal, R-band–6 cm, 15 m–6 cm total power, 15 m–R-band, 7 m–H and 7,15 m–CO(1-0). The two MIR images are also significantly correlated with the nonthermal emission, and the 12CO(1-0) correlates with the 6 cm total power and the nonthermal emission. The weakest correlations are those involving H i or 12CO(3-2) . In particular, the H i image does not correlate with 12CO(1-0), and both thermal emission and H correlate very weakly with CO(1-0). The 6 cm polarised intensity also shows no significant correlation with any other image. In fact, as noted by Frick et al. (2001), the polarised intensity is, on some spatial scales, anticorrelated with other tracers. In particular, the spiral pattern in the polarised intensity falls almost exactly between the optical spiral arms.
5 Discussion
5.1 Correlations within exponential disks
A trivial observation that arises from correlation studies of spiral galaxies, demonstrated in Fig. 10, is that all the observed material components that radiate have an approximately exponential decline with radius (Hoernes et al. 1998). A purely structureless disk will engender a strong correlation between any two tracers, so the extent to which small scale structures fail to correlate will be reflected in decreased correlations. To quantify the effect of, for example, correlations arising between various disk tracers due to the exponential disk scale length being similar, more sophisticated correlation techniques are required. Frick et al. (2001) used a wavelet correlation method to investigate spatial structures in NGC 6946 and find strong similarities between the total radio emission, red light and mid-infrared structures on all wavelet scales.
The high correlations between R-band, CO, MIR, 6 cm total and 20 cm nonthermal intensities are partly due to the bright exponential disks which contain a significant fraction of the total flux. In H, H i, 20 cm thermal and 6 cm polarised intensity, on the other hand, much of the spatial power in NGC 6946 is concentrated in the spiral arms rather than in the disk so that our correlations refer to relatively small scales.
In M31 and in the Galaxy, the gas and dust column densities are found to be well correlated (Savage & Mathis 1979; Xu & Helou 1996). Xu & Helou (1996) find that, in M31, the H i is correlated with the dust, which is not observed in NGC 6946, where the only significant correlation of H i is with H. This is because the H i distribution in NGC 6946 is essentially featureless within the optical disk, but the two outer H i arms have counterparts in the wide-field H image.
The contrast between the H i and 12CO(1-0) disks in NGC 6946 is revealing. A small depression in the radial H i profile is common for spiral galaxies, but in NGC 6946 the slope of the H i profile is positive out to a radius of about 190″ or some 5 kpc (Fig. 10 and Fig. 10 of Boulanger & Viallefond (1992)). The H i disk correlates poorly with both the main molecular gas tracer and with the SF tracers H. The spatial relationship between molecular clouds and H ii regions is also of interest. Solomon et al. (1985) find that 25% of warm molecular clouds in the Galaxy are associated with H ii regions. Averaged over the beam area, a similar association in NGC 6946 would lead to a strong correlation between the H and 12CO(1-0) images. However, these two images, although somewhat correlated (), are much less so than the 12CO(1-0) is with the nonthermal radio continuum or H is with the 15 m. Similarly, the 12CO(1-0) is relatively poorly correlated with the 20 cm thermal radio continuum.
5.2 The mid-infrared – radio continuum correlation
That the 15 m emission is well correlated with the molecular gas and H is unsurprising, indicating that the bulk of the 15 m emission comes from warm dust grains and PAH molecules in NGC 6946, and that these particles are in turn concentrated near regions of current star formation. We find here, as Vogler et al. (2001) find for M 83, that the mid-infrared (MIR) images in the 7 m and 15 m bands are highly similar and most probably dominated by PAHs, except in the central region where the strong radiation field destroys some fraction of the PAHs. Vogler also found that the 7 m and 15 m bands are most strongly correlated with the total radio continuum. However, as no separation of thermal and nonthermal radio continuum components was possible in M83, Vogler et al. (2001) could not further investigate the origin of their correlations. The weakness of the correlation between H and the thermal radio continuum may be a result of strongly varying absorption, not reflected in the mid infrared images, which better trace PAHs than dust temperature.
Table 6 shows red light to be highly correlated with 7 m. If the latter is indeed due primarily to PAHs, we may conclude that PAHs are heated by the general radiation field.
NGC 6946 is one of the few nearby spiral galaxies for which separate images of the thermal and nonthermal radio continuum components are available. If the radio – MIR correlation would be simply due to the radiation field near star-forming regions, heating the PAHs and ionising the gas, we would expect the best correlation between the MIR and the thermal radio intensities. Table 6 tell us that this is not the case: the thermal emission is less correlated with the MIR emission than the nonthermal emission. According to Table 6, the best correlation is between MIR and total radio continuum. This indicates that there are in fact two relationships between radio continuum and MIR emission, one for each component, clumpy and diffuse. The diffuse radio component is mainly nonthermal (a thick disk, if observed edge-on), while the clumpy radio component is mainly thermal emission from HII regions in a thin disk. While the physical relationship between the clumpy components is obvious, the other relationship, between the diffuse MIR component and the synchrotron radio component, is much more difficult to explain. The physical background of this correlation must be nonthermal. The assumption of enhanced production of cosmic-ray particles in star-forming regions is a possible explanation only if the magnetic field strength is constant everywhere in NGC 6946. As the intensity of synchrotron emission depends only on the first power of the cosmic-ray density, but on a power between two and four of the field strength, depending how well the energy equipartition condition is fulfilled, even small fluctuations in field strength will dominate the intensity distribution.
We propose a close connection between magnetic fields and gas clouds as the physical background of the radio – MIR correlation, as already suggested for the radio – far-infrared correlation by Niklas & Beck (1997) and Hoernes et al. (1998). In this case we also expect a high correlation between the nonthermal intensity and the total gas density.
Such a correlation was found in M 31 (Hoernes et al. 1998), but is much less convincing in NGC 6946. The correlation between nonthermal radio emission and 12CO(1-0) is reasonable, but the correlation with the total gas is not significant (Table 6).
We conclude that the magnetic fields in NGC 6946 are not closely related to the neutral gas as observed in the 12CO(1-0) or HI lines, but to the gas in which the PAHs are embedded, the warm gas. This gas needs heating by the general radiation field and has a sufficiently high degree of ionisation to couple the field lines. This can be tested by comparing the nonthermal radio emission with tracers of the warm gas, e.g. C+ or CO transitions higher than (3-2).
5.3 Gas, star formation the role of the magnetic field in NGC 6946
The absence of association between H i and H taken together with the considerable molecular gas reservoir throughout the disk argues against the hypothesis (e.g. Allen et al. 1986; Smith et al. 2000) that H i is always the product of star formation, in the sense that H2 is photodissociated by UV radiation from young stars. If H i was produced in this way, then one would expect an association of H i with the causes of the photodissociation. All correlations with a total gas mass image (made from summing the atomic and molecular contributions) are worse than with CO alone. Thus the situation is different from that in M31 where the correlation between radio continuum and FIR is better with total gas mass than with CO or HI alone (Hoernes 1997). This reflects the unusually high ratio of molecular to atomic gas in NGC 6946.
Compared with other nearby galaxies of comparable morphological type, luminosity and central surface brightness for which appropriate parameters are available in the literature, NGC 6946 can be seen to distinguish itself in several ways. The unusually strong FIR (Devereux & Young 1993) is likely to be associated with dust which is coextensive with the molecular gas (Davies et al. 1999). The 850m image of Bianchi et al. (2000), shows, at least on the eastern side, that the cold dust distribution is qualitatively very similar to that of the mid-IR emitting dust and the molecular gas.
Although the total gas mass and total fractional gas mass, while high, fall within the range seen in Sc galaxy samples (e.g. Schombert et al. 2001 and references therein), the molecular gas mass is an order of magnitude higher than is typical (Boselli et al. 1997). This latter result holds even when normalised by the dynamical mass (c.f. Fig. 2 of Casoli et al. 1998). The presence of so much molecular gas raises questions such as where did it come from? Why has it not formed stars?
The idea that star formation is enhanced when the rate of cloud collisions increases (Tan 2000) typically invokes an interaction as the stimulus. Recently Karachentsev et al. (2000) and Pisano & Wilcots (2000) describe a small group of dwarf galaxies around NGC 6946 and Burton et al. (1999) reported the discovery of Cep 1, a low-surface-brightness spiral galaxy in close spatial and kinematic proximity to NGC 6946. However, these studies find only low-mass objects with no obvious signs of interaction with NGC 6946. Placing NGC 6946 on the colour-asymmetry diagrams of Conselice et al. (2000) argues against an interaction-driven trigger for the starburst in NGC 6946. An alternative to a single major interaction, is the possibility of a series of minor mergers of gas-rich dwarf galaxies (e.g. Bekki 1998; 2001: Rudnick et al. 2000). However it would require flurry of some tens of typical dwarfs (Swaters 1999) to descend upon NGC 6946, even assuming that all of their neutral gas were to join the molecular ISM.
A rather more speculative alternative arises out of the work of Walker & Wardle (1998; 1999) and Wardle & Walker (1999), who revisit the ideas of Pfenniger et al. (1994) and others, to imagine Galactic halo dark matter consisting of cold, dense clouds of molecular hydrogen and atomic helium. NGC 6946’s isolation may have allowed a relatively fragile baryonic halo to have survived until some recent event, such as a minor merger, heated and disrupted some fraction of the cold halo clouds, which are known to be vulnerable to collisional disruption, distributing them into the disk’s ISM. This gas would settle into a disk on an orbital time-scale. A problem with this scenario is that the disrupted gas would initially be expected to be in atomic form. Placing NGC 6946 on the dark matter scaling relations of Broeils (1992) (using the relatively well-determined parameter, the dark halo mass within seven disk scale lengths (Walsh 1997)), one finds that NGC 6946’s dark halo is significantly less massive than expected for a galaxy of its maximum rotation speed.
Star formation efficiency (SFE) in a galaxy is generally defined as the ratio of the mass of recently formed stars to the mass of molecular gas from which they are presumed to have formed. The SFE may be estimated by using H and/or infrared luminosities to trace the young stars and 12CO(1-0) observations to probe the molecular gas mass. Both the mean star formation rate and the overall SFE for NGC 6946 are close to the mean value for Scd galaxies (Young et al. 1996; Kennicutt 1998; Casoli et al. 1998). Rownd & Young (1999) using H and 12CO(1-0) observations to consider the SFE in a large sample of spiral galaxies, do not observe large SFE gradients across star-forming disks, but their data have at at most a few detected positions across any one disk.
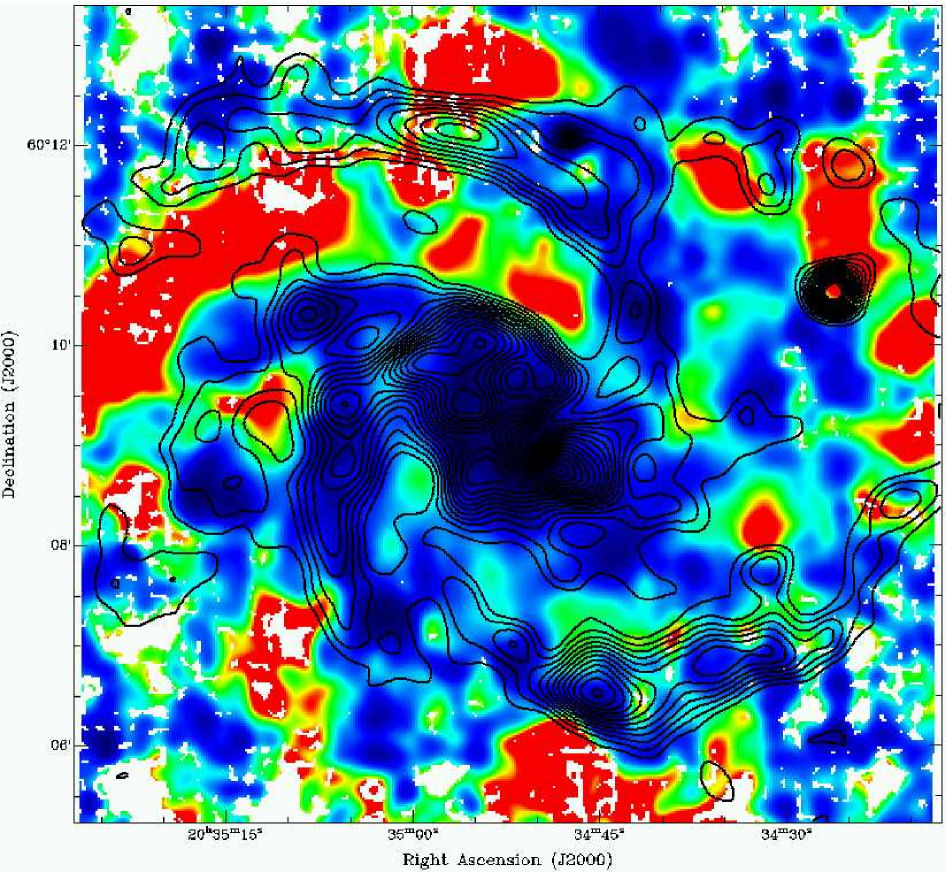
We show in Fig. 11 the local SFE in NGC 6946 with the 6 cm polarised radio emission, representing the regular part of the magnetic field, overlaid as contours. The SFE has been estimated by dividing the H image by the 12CO(1-0) image, after selecting points of greater than significance and smoothing to the same spatial resolution: this image is shown in false colour in Fig. 11. Fig. 11, an important and novel result, has several remarkable features. In Fig. 11 the SFE ranges by over two orders of magnitude with highest values found in the northeastern spiral arm. Low values are found in the central regions, but it is not clear to what extent this is due to the high CO brightnesses combined with the high central optical extinction (c.f. Fig. 2 of Devereux & Young 1993). Beyond the high extinction region, considerable variations of SFE occur, with high values coincident with the outer spiral arms. That the SFE is generally greater at larger radii is not unprecedented in the sample of Rownd & Young (1999), but the maximum variation in SFE is larger than in any of their sample.
A striking feature of Fig. 11 is the way in which the contours representing the regular part of the magnetic field trace out regions of low SFE. Polarised emission is strong both north and south of the northeastern spiral arm, but entirely absent within it. The polarised emission even traces out two regions of low SFE within the arm (at and (J2000)). Regions of higher SFE also avoid the polarised emission in the south. We performed a two-dimensional correlation analysis on the SFE and 6 cm polarised emission images using the methodology described in Sect. 4.2. The result of a linear correlation analysis is a regression line with slope and a Pearson’s correlation coefficient of . The analysis is sensitive to a few high points in the SFE image, and when these points are excised, the slope decreases by a factor of three, the correlation coefficient becomes . However in both cases the significance of the correlation is low, with the Student’s value less than 4. The significance of the correlation is only slightly increased () when the correlation is performed logarithmically. Thus the apparent strong anticorrelation is possibly coincidental, given that the definition of the “regular” part of the magnetic field is related to the resolving beamsize and is not an intrinsic property of the galaxy. The appearance of Fig. 11 may be due to SF tangling the field within the spiral arms, the dynamo producing regular fields preferably in interarm regions where turbulence and/or diffusivity is smaller (c.f. Rohde et al. 1999), or a hitherto unsuspected relationship between large scale magnetic fields and molecular cloud and/or star formation.
6 Conclusions
-
1.
We have mapped the 12CO(1-0) and 12CO(3-2) emission in NGC 6946, using the IRAM 30-m radio telescope and the Heinrich Hertz Telescope, respectively. The beam width of 22″ at 115 GHz and 345 GHz corresponds to a linear size of 590 pc at the assumed distance of 5.5 Mpc. Extended CO emission is imaged in both lines across the entire disk of this gas–rich, actively star–forming galaxy.
-
2.
We find that warm, dense gas appears to be distributed over an area of some 3 kpc in NGC 6946 and is also located at non-central positions. The 12CO(3-2) images contain considerable diffuse emission between hotspots and spiral arms indicating that molecular clouds containing warm and dense gas are distributed throughout the inner disk of NGC 6946.
-
3.
The arm–interarm contrast in two selected areas of the NE spiral arm is in 12CO(1-0), similar to that of the H i gas, and in 12CO(3-2), measured over the same areas. The larger contrast of 12CO(3-2) suggests that molecules in the spiral arms are warmer or reside for longer in the spiral arm.
-
4.
The rotation curve derived from the 12CO(1-0) velocity field agrees, within the uncertainties, with the H i rotation curve of Carignan et al. (1990). The velocity dispersion is km s-1 in the inner 2 kpc and km s-1 in the disk, without tendency to increase in the spiral arms.
-
5.
We find that the total molecular gas mass is exceptionally massive, with M, which is about an order of magnitude more than that of both the Galaxy and the median for the large sample of spiral galaxies studied by Casoli et al. (1998), and thus confirm that the molecular component in NGC 6946 is almost as massive as the atomic gas, with .
-
6.
We have observed the excitation conditions as a function of location of the gas clouds relative to the star-forming regions in NGC 6946. Using a large-velocity gradient code, we modeled the temperature and density of the gas and find that, in the centre of NGC 6946 the beam-averaged gas kinetic temperature is K and the molecular gas density is cm-3. The optical depth of the 12CO(3-2) line is high, with .
-
7.
We find a lack of association between the large-scale distributions of the main molecular gas tracer, 12CO(1-0), and the atomic gas. Taken together with the considerable star formation in the disk, this argues against the hypothesis that H i is the product of H2 photodissociation by UV radiation from young stars.
-
8.
The highest correlation between any pair of tracers is found between the 7 m MIR emission and the total radio continuum emission at 6 cm. This cannot be due to dust heating and gas ionisation in star-forming regions because the thermal radio emission is less correlated with the MIR emission than the nonthermal emission. A coupling of magnetic fields to gas clouds is a possible scenario.
-
9.
When the 6 cm polarised emission, which traces the regular part of the magnetic field, is overlaid on an image made from the smoothed H map divided by the molecular gas map (the SFE image), it is seen that the magnetic field traces out regions of low SFE.
Acknowledgements.
We thank the staff at IRAM and SMTO for extensive help with the observations. We are grateful to S. Larsen, D. Dale, A. Ferguson, R. Dettmar, M. Trewhella and R. Kamphuis for providing us with their datasets. It is a pleasure to thank E. Berkhuijsen, C. Henkel, A. Schulz, A. Vallenari, M. Walker and an anonymous referee for discussions that added to the content of this paper, and C. Nieten for help with his correlation software.References
- (1) Allen, R.J., Atherton, P.D. & Tilanus, R.P.J., 1986, Nature, 319, 296
- (2) Alton, P., Trewhella, M., Davies, J.I., et al., 1998, A&A, 335, 807
- (3) Arimoto, N., Sofue, Y. & Tsujimoto, T. 1996, PASJ, 48, 275
- Baars et al. (1999) Baars, J.W.M., Martin, R.N., Mangum, J.G., McMullin, J.P. & Peters, W.L., 1999, PASP, 111, 627
- (5) Baffa, C., Giovanardi, C. & Hunt, L.K. Universita di Lecce and Banca Popolare di Lecce, National Conference on Infrared Astronomy, 3rd, Gallipoli, Italy, Sept. 19-22, 1989) Societa Astronomica Italiana, Memorie (ISSN 0037-8720), vol. 61, no. 1, 1990, p. 133-135.
- (6) Balcells, M. & Peletier, R.F., 1994, AJ, 107, 135
- Ball et al. (1985) Ball, R., Sargent, A.I., Scoville, N.Z., Lo, K.Y. & Scott, S.L., 1985, ApJ, 298, L21
- (8) Beck, R., 1991, A&A 251, 15
- (9) Beck, R. & Hoernes, P., 1996, Nature, 379, 47
- Begeman (1989) Begeman, K.G., 1989, A&A, 223, 47
- Bekki (1998) Bekki, K. 1998, A&A, 334, 814
- Bekki (2001) Bekki, K. 2001, ApJ, 546, 189
- (13) Bertoldi, F. & McKee, C., 1996, In “Amazing Light”, ed. R.Y. Chiao, New York: Springer Verlag, p.41
- (14) Bianchi, S., Davies, J.I., Alton, P.B., Gerin, M. & Casoli, F., 2000, A&A, 353, 13
- (15) Blitz, L., Magnani, K. & Mundy, L. 1984, ApJ, 282, L9
- (16) Boselli, A., Gavazzi, G., Lequeux, J., Buat et al., 1997, A&A, 327, 522
- Boulanger & Viallefond (1992) Boulanger, F. & Viallefond, F., 1992, A&A 266, 37
- Braine et al. (1997) Braine, J., Guelin, M., Dumke, M., Brouillet, Herpin, F. & Wielebinski, R., 1997, A&A, 326, 963
- (19) Broeils, A.H. 1992, PhD thesis, University of Groningen
- Carignan et al. (1990) Carignan, C., Charbonneau, P., Boulanger, F. & Viallefond, F., 1990, A&A, 234, 43
- Casoli et al. (1990) Casoli, F., Clausset, F., Viallefond, F., Combes, F. & Boulanger, F., 1990, A&A, 233, 357
- Casoli et al. (1998) Casoli, F., Sauty, S., Gerin, M., et al., 1998, A&A, 331, 451
- (23) Combes, F., 1999, In: “H2 in Space”, Eds.: F. Combes & G. Pineau des Forêts, Cambridge University Press, Astrophysics Series, astro-ph/9910296
- Combes & Becquaert (1997) Combes, F. & Becquaert, J.-F. 1997, A&A, 326, 554.
- (25) Conselice, C.J., Bershady, M.A. & Gallagher, J.S., III, 2000, A&A, 354, L21
- Dale et al. (1999) Dale, D., Helou, G., Silbermann, N.A. et al. 1999, AJ, 118, 2055
- Dale et al. (2000) Dale, D., Silbermann, N.A., Helou, G., et al., 2000, AJ, 120, 583
- Davies et al. (1999) Davies, J. I., Alton, P., Trewhella, M., Evans, R., & Bianchi, S. 1999, MNRAS, 304, 495
- (29) deGioia-Eastwood, K., 1985, ApJ, 288, 175
- deGioia-Eastwood, K., et al. (1984) deGioia-Eastwood, K., Grasdalen, G.L., Strom, S.E. & Strom, K.M., 1984, ApJ, 278, 564
- Devereux & Young (1993) Devereux, N.A. & Young, J.S., 1993, AJ, 106, 948
- Dumke et al. (2001) Dumke, M., Nieten, C., Thuma, G., Wielebinski, R. & Walsh, W., 2001, A&A, 373, 853
- (33) Dutil, Y. & Roy, J., 1999, ApJ, 516, 62
- Elmegreen et al. (1998) Elmegreen, D.M., Chromey, F.R. & Santos, M., et al., 1998, AJ 116, 1221
- Elmegreen, Efremov, & Larsen (2000) Elmegreen, B. G., Efremov, Y. N., & Larsen, S., 2000, ApJ, 535, 748
- (36) Emerson, D.T. & Gräve, R., 1988, A&A 190, 353
- Engargiola (1991) Engargiola, G. 1991, ApJS, 76, 875
- (38) Engelbracht, C.W., Rieke, M.J., Rieke, G.H. & Latter, W.B., 1996, ApJ, 467, 227
- (39) Evans, N.J. II, 1999, ARAA, 37, 311
- (40) Ferguson, A.M.N., Wyse, R.F.G., Gallagher, J.S. & Hunter, D.A., 1998, ApJ, 506, L19
- Frick et al. (2000) Frick, P., Beck, R., Shukurov, A., et al., 2000, MNRAS, 318, 925.
- Frick, Beck, Berkhuijsen, & Patrickeyev (2001) Frick, P., Beck, R., Berkhuijsen, E. M., & Patrickeyev, I., 2001, MNRAS, 327, 1145
- (43) Glassgold, A.E. & Langer, W.D., 1973, ApJ, 186, 859
- (44) Goldreich, J. & Kwan, J., 1974, ApJ, 191, 93
- (45) Green, S. & Chapman, S., 1978, ApJS, 37, 169
- (46) Helfer, T.T. & Blitz, L., 1997, ApJ, 478, 162
- (47) Hoernes, P., 1997, PhD Thesis, University of Bonn
- (48) Hoernes, P., Berkhuijsen, E.M. & Xu, C., 1998, A&A, 334, 57
- Hollenbach & Tielens (1997) Hollenbach, D.J. & Tielens, A.G.G.M., 1997, ARAA, 35, 179
- (50) Horellou, C. & Booth, R. 1997, A&AS, 126, 3
- (51) Hunter, S.D., Bertsch, D.L., Catelli, J.R., et al., 1997, ApJ, 481, 205
- Ishizuki et al. (1990) Ishizuki, S., Kawabe, R., Ishiguro, M., et al., 1990, ApJ, 355, 436
- (53) Issa, M.R., MacLaren, I., & Wolfendale, A.W., 1990, A&A, 236, 237
- (54) Kamphuis, J. 1993, Phd Thesis, University of Groningen
- (55) Kamphuis, J. & Sancisi, S., 1993, A&A, 273, L31
- Karachentsev, Sharina, & Huchtmeier (2000) Karachentsev, I. D., Sharina, M. E., & Huchtmeier, W. K. 2000, A&A, 362, 544
- (57) Kennicutt, R., 1983, ApJ, 272, 53
- (58) Kennicutt, R., 1998, ApJ, 334, 144
- (59) Knapen, J.H. & van der Kruit, P.C., 1991, A&A, 248, 57
- Knapp (1980) Knapp, G.R. Leighton, R.B., Wannier, P.G., Phillips, T.G. & Huggins, P.J., 1980, ApJ, 240, 60
- Knapp (1998) Knapp, G.R. Young, K, Lee, E. & Jorissen, A., 1995, ApJSS, 117, 209
- Larsen & Richter (1999) Larsen, S.S. & Richter, T., 1999, A&A, 345, 59
- (63) Lasker, B.M., Sturch, C.R., McLean, B.J. et al., 1990, AJ, 99, 2019
- (64) Lavezzi, T.E. & Dickey, J.M. 1998, AJ, 116, 2672
- (65) Lequeux J., 1995, in ”The interplay between massive star-formation, the interstellar medium and galaxy evolution”, Kunth et al. (ed.) Fronti res p. 105
- (66) Lu, N.Y., Helou, G., Tuffs, R., et al., 1996, A&A, 315, 153
- Madden et al. (1993) Madden, S. C., Geis, N., Genzel, R. et al., 1993, ApJ, 407, 579
- Malhotra (1994) Malhotra, S. 1994, ApJ, 433, 687
- Malhotra et al. (1996) Malhotra, S., Helou, G., van Buren, D. et al., 1996, A&A, 315, L161
- (70) Mao, R.Q., Henkel, C., Schulz, A., et al., 2002, A&A, in press
- (71) Mauersberger, R. & Henkel, C., 1993, Astron. Ges., Rev. Mod. Astr., 6, 69
- Mauersberger et al. (1999) Mauersberger, R., Henkel, C., Walsh, W. & Schulz, A., 1999, A&A 341, 256
- Morris & Lo (1978) Morris, M. & Lo, K.Y., 1978, ApJ, 223, 803
- Morris & Rickard (1982) Morris, M. & Rickard, L.J., 1982, ARAA, 20, 517
- (75) Nakai, N. & Kuno, N., 1995, PASJ, 47, 761
- Nieten (2001) Nieten, C. 2001, PhD Thesis, University of Bonn
- Nieten et al. (1999) Nieten, C., Dumke, M., Beck, R. & Wielebinski, R., 1999, A&A, 347, L5
- (78) Niklas, S. & Beck, R., 1997, A&A, 320, 54
- (79) Papadopoulos, P.P. & Allen, M.L. 2000, ApJ, 537, 631
- (80) Parravano, A., 1989, ApJ, 347, 812
- (81) Patel, K. & Wilson, C.D., 1995, ApJ, 453, 162
- Penzias et al. (1972) Penzias, A.A., Solomon, P.M., Jefferts, K.B. & Wilson, R.W., 1972, ApJ, 174, L43
- Petitpas & Wilson (2000) Petitpas, G. R. & Wilson, C. D. 2000, ApJL, 538, L117
- (84) Pfenniger, D., Combes, F., & Martinet, L. 1994, A&A, 285, 79
- Pisano & Wilcots (2000) Pisano, D. J. & Wilcots, E. M. 2000, MNRAS, 319, 821
- (86) Ptak, A., Serlemitsos, P., Yaqoob, T., & Mushotzky, R., 1999, ApJS, 120, 179
- Regan & Vogel (1995) Regan, M.W. & Vogel, S.N., 1995, AJ, 452, L21
- Rickard & Palmer (1981) Rickard, L.J. & Palmer, P., 1981, A&A, 102, 13
- (89) Rice, W., Lonsdale, C.J., Soifer, B.T., et al., 1988, ApJS, 68, 91
- (90) Roberts, W.W. & Yuan, C., 1970, ApJ, 161, 887
- (91) Rogstad, D.H., & Shostak, S., 1972, ApJ176, 315
- (92) Rogstad, D.H., Shostak, S. & Rots, A., 1973, A&A, 22, 111
- Rohde et al. (1999) Rohde, R., Beck, R. & Elstner, D., 1999, A&A, 350, 423
- Rohlfs & Wilson (1996) Rohlfs, K. & Wilson, T., 1996 “Tools of Radioastronomy”, Springer: Berlin
- Rownd & Young (1999) Rownd, B. K. & Young, J. S. 1999, AJ118, 670
- Roy & Belley (1993) Roy, J-R. & Belley, J., 1993, ApJ, 406, 60
- Rudnick, Rix, & Kennicutt (2000) Rudnick, G., Rix, H., & Kennicutt, R. C. 2000, ApJ, 538, 569
- (98) Ryder, S.D. & Dopita, M.A., 1994, ApJ, 430, 142
- (99) Sauty, S., Gerin, M. & Casoli, F., 1995, A&A, 339, 19
- (100) Savage, B.D. & Mathis, J.S., 1979, ARAA, 17, 73
- Schlegel (1994) Schlegel, E.M., 1994, ApJ, 434, 523
- (102) Schlegel, D.J., Finkbeiner, D.P. & Davis, M., 1998, ApJ, 500, 525
- (103) Schlegel, E.M., Blair, W.P. & Fesen, R.A., 2000, AJ, 120, 791
- Schombert, McGaugh, & Eder (2001) Schombert,J. M., McGaugh, S. S., & Eder, J. 2001, AJ, 121, 2420
- Sellwood & Balbus (1999) Sellwood, J. A. & Balbus, S. A. 1999, ApJ, 511, 660.
- (106) Siebenmorgen R. & Krügel E., 1992, A&A, 259, 614
- (107) Smith, D.A., Allen, R.J., Bohlin, R.C., Nicholson, N. & Stecher, T.P., 2000, ApJ, 538, 608
- Sofue (1996) Sofue, Y. 1996, ApJ, 458, 120
- Sofue et al. (1988) Sofue, Y. Doi, M, Ishizuki, S., Nakai, N. & Handa, T., 1988, PASJ, 40, 511
- (110) Solomon, P.M., Sanders, D.B., & Rivolo, A.R., 1985, ApJ, 292, L19
- (111) Solomon, P.M., Rivolo, A.R., Barrett, J.W., & Yahil, A., 1987, ApJ, 319, 730
- (112) Solomon, P.M., Downes,D., Radford, S.J.E., & Barett, J.W., 1997, ApJ, 478, 144
- Stanek et al. (1995) Stanek, K.Z., Knapp, G.R., Young, K. & Phillips, T.G., 1995, ApJSS, 100, 169
- Stark (1984) Stark, A. A. 1984, ApJ, 281, 624
- Stark & Brand (1989) Stark, A. A. & Brand, J. 1989, ApJ, 339, 763
- (116) Strong, A.W., Bloemen, J.B.G.M., Dame, T.M., et al., 1988, A&A, 207, 1
- (117) Strong, A.W., Bennett, K., Bloemen, J.B.G.M., et al., 1994, A&A, 292, 82
- (118) Swaters, R. A. 1999, PhD thesis, University of Groningen
- Tacconi & Young (1986) Tacconi, L.J. & Young, J.S., 1986, ApJ 308, 600
- Tacconi & Young (1989) Tacconi, L. J. & Young, J. S. 1989, ApJS, 71, 455
- Tacconi & Young (1990) Tacconi, L. J. & Young, J. S. 1990, ApJ, 352, 595
- (122) Tan, J.C., 2000, ApJ, 536, 173
- (123) Telesco, C.M. & Harper, D.A., 1980, ApJ, 235, 392
- (124) Tilanus, R.P.J. & Allen, R.J. 1989, ApJ, 339, 57
- Trewhella (1998) Trewhella, M., 1998, MNRAS, 297, 807
- Tully (1998) Tully, R.B., 1988, “Nearby Galaxies Catalog”, Cambridge, Cambridge University Press
- Turner & Ho (1983) Turner, J.L. & Ho, P.T.P., 1983, ApJ, 268, L79
- (128) Turner, J.L. & Hurt, R.L. 1992, ApJ, 384, 72
- (129) Valentijn, E.A., van der Werf, P.P., de Graauw, T. & de Jong, T., 1996, A&A, 315, 145
- Verter & Hodge (1995) Verter, F. & Hodge, P., 1995, ApJ, 446, 616
- (131) Vogler, A., Madden, S., Sauvage, M., et al., 2002, A&A, submitted
- Walker & Wardle (1999) Walker, M. & Wardle, M. 1999, PASA, 16, 262
- Walker & Wardle (1998) Walker, M. & Wardle, M. 1998, ApJL, 498, L125
- (134) Wall, W.F., Jaffe, D.T., Bash, F.N. et al., 1993, ApJ, 414, 98
- (135) Walsh, W.M. 1997, PhD thesis, University of New South Wales
- Walsh et al. (2001) Walsh, W.M., Taylor, C.L., Fritz, T., & Hüttemeister, S., 2002, A&A, in press
- Wang (1994) Wang, Y., Jaffe, D.T., Graf, U., & Evans, N., 1995, ApJ, 95, 503
- Wardle & Walker (1999) Wardle, M. & Walker, M. 1999, ApJL, 527, L109
- (139) Weiss, A., 2000, PhD thesis, University of Bonn
- Weiss, Neininger, Hüttemeister, & Klein (2001) Weiss, A., Neininger, N., Hüttemeister, S., & Klein, U. 2001, A&A, 365, 571
- Weliachew et al. (1988) Weliachew, L., Casoli, F. & Combes, F., 1988, A&A, 199, 29
- Wielebinski et al. (1999) Wielebinski, R., Dumke, M. & Nieten, C., 1999, A&A, 347, 634
- Wild (1999) Wild, W., 1999, “The 30m Manual”, IRAM: Granada
- (144) Wirth, A. & Shaw, R., 1983, AJ, 88, 171
- (145) Wolfire, M., Hollenbach, D.J. & Tielens, A.G.G.M., 1993, ApJ, 402, 195
- (146) Xu, C. & Helou, G., 1996, ApJ, 456, 163
- Young (1995) Young, K., 1995, ApJ, 445, 872
- (148) Young, J.S., Scoville, N.Z. & Brady, E., 1985, ApJ, 288, 487
- Young et al. (1995) Young, J.S., Xie, S., Tacconi, L., et al., 1995, ApJS, 98, 219
- Young et al. (1996) Young, J. S., Allen, L., Kenney, J. D. P., Lesser, A., & Rownd, B. 1996, AJ, 112, 1903
- Young Scoville (1982) Young, K. & Scoville, N., 1982, ApJ, 258, 467