The Type Ic Hypernova SN 2002ap
Abstract
Photometric and spectroscopic data of the energetic Type Ic supernova (SN) 2002ap are presented, and the properties of the SN are investigated through models of its spectral evolution and its light curve. The SN is spectroscopically similar to the “hypernova” SN 1997ef. However, its kinetic energy [ erg] and the mass ejected (2.5–5 M⊙) are smaller, resulting in a faster-evolving light curve. The SN synthesized M⊙ of 56Ni, and its peak luminosity was similar to that of normal SNe. Brightness alone should not be used to define a hypernova, whose defining character, namely very broad spectral features, is the result of a high kinetic energy. The likely main-sequence mass of the progenitor star was 20–25 M⊙, which is also lower than that of both hypernovae SNe 1997ef and 1998bw. SN 2002ap appears to lie at the low-energy and low-mass end of the hypernova sequence as it is known so far. Observations of the nebular spectrum, which is expected to dominate by summer 2002, are necessary to confirm these values.
Subject headings:
supernovae: general – supernovae: individual (SN 2002ap) – line: identification – line: formation – nucleosynthesis – gamma rays: bursts1. Introduction
One of the most interesting recent developments in the study of supernovae (SNe) is the discovery of some very energetic Type Ic SNe (SNe Ic; see Filippenko 1997 for a general review), whose kinetic energy () exceeds erg, about 10 times the of normal core-collapse SNe (hereafter erg). The most luminous and powerful of these objects, SN 1998bw, was probably linked to GRB 980425 (Galama et al. 1998), thus establishing for the first time a connection between the enigmatic gamma-ray bursts (GRBs) and the well-studied phenomenon of core-collapse SNe. However, SN 1998bw was exceptional for a SN Ic: it was as luminous at peak as a SN Ia, indicating that it synthesized M⊙ of 56Ni, and its was estimated at erg (Iwamoto et al. 1998; Woosley et al. 1999). Because of its large , SN 1998bw was classified as a “hypernova”. Signatures of asymmetry were detected in SN 1998bw, such as polarization (Patat et al. 2001) and peculiar nebular-line profiles (Mazzali et al. 2001; Maeda et al. 2002).
Subsequently, other “hypernovae” of Type Ic have been discovered or recognised, such as SN 1997ef (Iwamoto et al. 2000; Mazzali et al. 2000) and SN 1997dq (Matheson et al. 2001; Mazzali et al. 2002, in preparation), although their was not as large as that of SN 1998bw, and they did not appear to be associated with GRBs. The analysis of these various objects suggests that the may be related to the progenitor’s main-sequence mass, which was M⊙ for SN 1998bw and M⊙ for SN 1997ef. These values place hypernovae at the high-mass end of SN progenitors. Another possible hypernova, although of Type IIn, was SN 1997cy, which was also estimated to have a large mass ( M⊙; Germany et al. 2000; Turatto et al. 2000). It is not yet clear whether the large mass is the discriminating factor for the birth of a hypernova or the connection with a GRB.
In this paper we present a first analysis of the properties of the recently discovered SN Ic 2002ap in M74 (Hirose 2002). The SN was immediately recognised as a hypernova from its broad spectral features (Kinugasa et al. 2002; Meikle et al. 2002; Gal-Yam et al. 2002a; Filippenko & Chornock 2002). This indicates high velocities in the ejected material, which is the typical signature of hypernovae. It was therefore followed from several observatories, and the relative proximity also favored observations with small telescopes. Luckily, the SN was discovered very soon after it exploded: the discovery date was January 29, while the SN was not detected on January 25 (Nakano et al. 2002). This is among the earliest any SN has been observed, with the obvious exceptions of SN 1987A and SN 1993J.
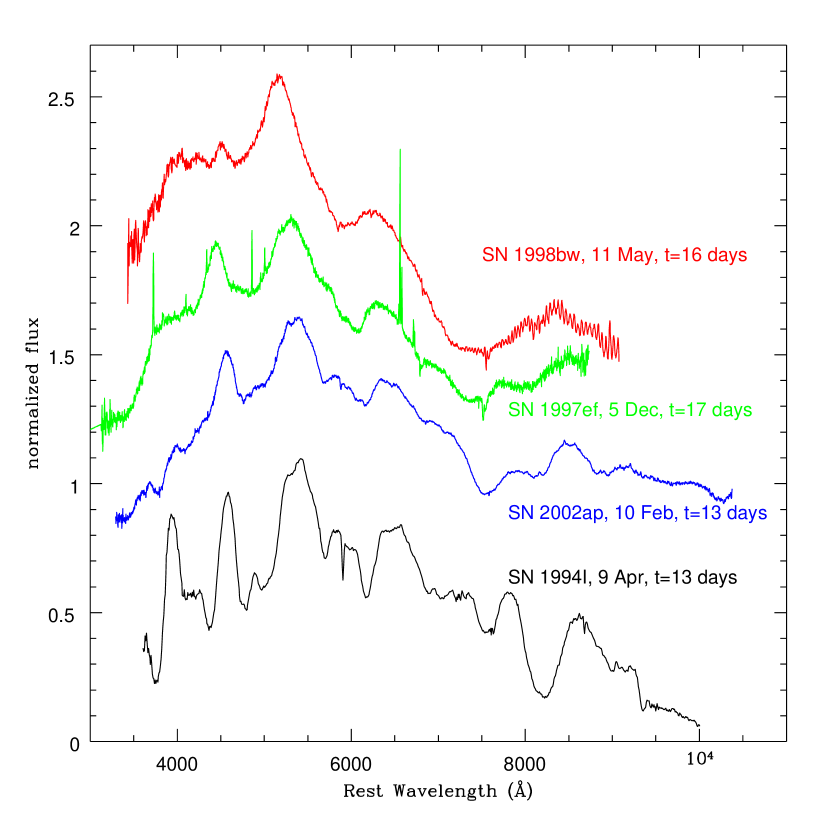
Figure 1 shows the near-maximum spectra of SN 2002ap, of the hypernovae SNe 1998bw and 1997ef, and of the normal SN Ic 1994I. If line width is the distinguishing feature of a hypernova, then clearly SN 2002ap is a hypernova, as its spectrum resembles that of SN 1997ef much more than that of SN 1994I. Line blending in SN 2002ap and SN 1997ef is comparable. However, some individual features that are clearly visible in SN 1994I but completely blended in SN 1997ef can at least be discerned in SN 2002ap (e.g. the Na i–Si ii blend near 6000 Å and the Fe ii lines near 5000 Å). Therefore, spectroscopically SN 2002ap appears to be located just below SN 1997ef in a “velocity scale,” but far above SN 1994I.
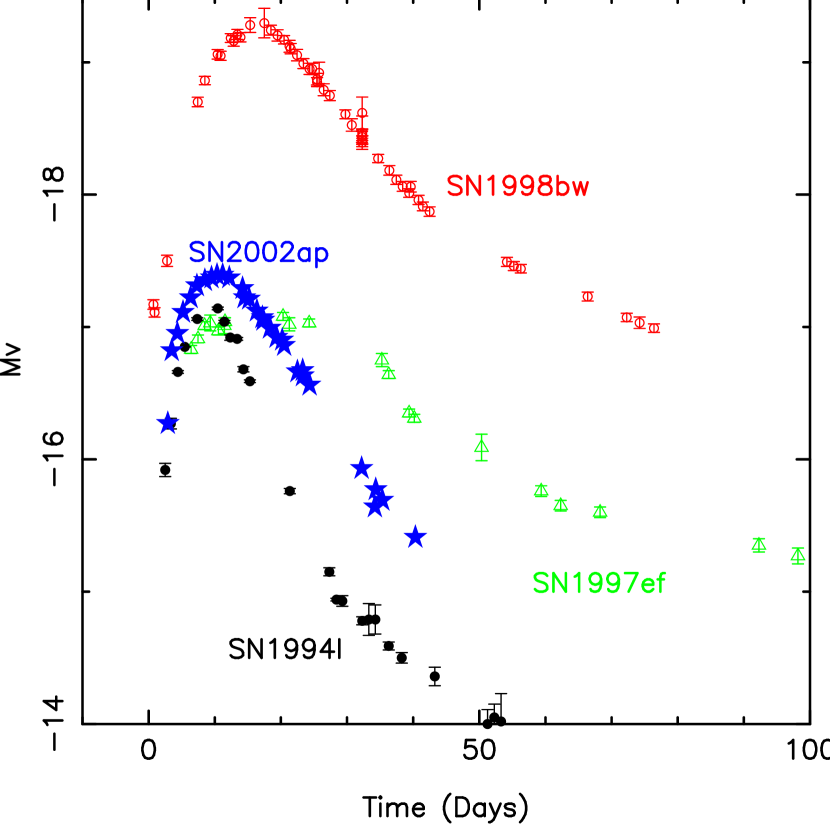
This appears to be confirmed by the light curve. Figure 2 shows the -band light curves of the same four SNe as in Figure 1. SN 2002ap reached maximum on about February 8 at mag. SN 2002ap peaks earlier than both hypernovae 1998bw and 1997ef, but later than the normal SN 1994I, suggesting an intermediate value of the ejecta mass .
Using a distance to M74 of 8 Mpc ( mag; Sharina et al. 1996), and a combined Galaxy and M74 reddening of mag (estimated from a Subaru HDS spectrum; Takada-Hidai et al. 2002, in preparation), the absolute magnitude is . This is comparable to SN 1997ef and fainter than SN 1998bw by almost 2 mag. Since peak brightness depends on the ejected 56Ni mass, SNe 2002ap, 1997ef, and 1994I appear to have synthesized similar amounts of it. Estimates were M⊙ for SN 1994I (Nomoto et al. 1994) and 0.13 M⊙ for SN 1997ef (Mazzali et al. 2000).
Section 2 of this paper describes how an explosion model was selected that gives reasonable fits to the spectra of SN 2002ap, thus establishing the properties of the SN. In § 3 we show synthetic light curves obtained with our best models, which confirm the results of the spectroscopic analysis. In § 4 we discuss implications for the progenitor of SN 2002ap.
2. Spectroscopic Models
Iwamoto et al. (1998) showed that synthetic light curves of SNe Ic are degenerate with respect to particular sets of the parameters , , and the opacity. Spectra must also be used to determine those parameters, as their dependence is different. Therefore we started the analysis from the spectra. We used the Monte-Carlo SN spectrum synthesis code described by Mazzali & Lucy (1993) and modified as in Lucy (1999) and Mazzali (2000).
We tested several versions of the hypernova explosion models CO138 (used for SN 1998bw; Iwamoto et al. 1998) and CO100 (used for SN 1997ef; Mazzali et al. 2000). Both of the models turned out to be too massive. In fact, since SN 2002ap rises very rapidly in brightness, the epochs of its spectra are smaller than those of similar-looking spectra of both SNe 1997ef and 1998bw. In particular, the earliest spectrum of SN 2002ap, taken on January 30, has an epoch of at most 4 days, but it resembles the spectra of SNe 1997ef and 1998bw at epochs of about 8 days, indicating similar temperatures and expansion velocities. The densities in the massive models at such an early epoch are much too high, and no good solution can be obtained unless most of the mass is composed of He, which contributes very little both to the electron density and to line opacity.
As the subsequent evolution of SN 2002ap more closely resembles that of SN 1997ef (albeit at a faster rate) than that of SN 1998bw, we selected model CO100 and rescaled it to lower masses, and hence lower . We tried a model with half the mass (model CO100/2: = 4.8 M⊙; ) and one with a quarter of the mass (model CO100/4: = 2.4 M⊙; ). Model CO100/2 is too massive, while model CO100/4 appears to be roughly appropriate for SN 2002ap. Figure 3 shows a series of fits obtained with that model.
Also, the earliest spectrum (Meikle et al. 2002) requires a large degree of line blending, as shown by the apparent lack of any separation between O i 7774 and the Ca ii near-infrared triplet. This requires the presence of sufficient material at km s-1. In the case of SN 1997ef, this blending was obtained by adding an outer “flat” part to the density profile (Mazzali et al. 2000). Blending in the O i–Ca ii feature in the earliest observed spectrum of SN 1997ef line was weaker, but the epoch of this spectrum is later than the first spectrum of SN 2002ap. We also modified model CO100 slightly by limiting the velocities to 65,000 km s-1, to match the observations.
Because the first spectrum was obtained so early, it was possible to establish its age fairly accurately using synthetic spectra. Age and velocity must in fact combine to give an acceptable temperature, but velocity can be checked against the blueshift of the line absorptions. For January 30 we find days.
The first spectrum has a photospheric velocity km s-1, and thus the photosphere is located just below the outer flat extension of the density profile. Hence line blending is very strong, and the spectrum resembles that of SN 1998bw. But already the next spectrum, with days, has km s-1, which is in the steep part of the density distribution, so blending becomes less severe. Note that the Ca ii near-IR triplet can blend with the O i line even with a very small abundance of Ca at high velocity, because it is a very easy line to excite. We see that continues to decrease with time, but the rate of decrease becomes smaller as the light curve reaches peak, which is expected as the photosphere then enters the inner flat part of the density distribution.
Oxygen dominates the composition in all the spectra we have modeled. However, the earliest spectrum contains % He by mass, suggesting that the SN exploded with about 0.05 M⊙ left from the He envelope. This appears to be consistent with the early detection of an absorption at about 1.03 m, which could be He i 10830, although Mg ii and C i could also contribute to it (Fig. 3; Motohara et al. 2002). Synthetic spectra can only reproduce this feature if significant nonthermal ionization of He is active, which is also not unexpected. The abundances of Si and other intermediate-mass elements, and those of the Fe-group elements, increase with depth in the ejecta, which is in accord with expectations.
Several problems remain in the models. The synthetic O i and Ca ii absorptions are too blue at the more advanced epochs, suggesting that the density profile we have adopted may overestimate the mass at high velocities. Also, the ratio of the Fe ii lines in the absorption near 4800 Å is not correct. Further, more refined analysis is therefore needed. However, we do not expect that our general results will change significantly.
3. Light-Curve Models
We constructed the UVOIR bolometric light curve of SN 2002ap mainly from the photometry obtained with the MAGNUM telescope (Yoshii et al. 2002). We also included 5 data points based on observations from Wise Observatory (Gal-Yam et al. 2002b), the U.K. Infrared Telescope (Mattila et al. 2002), MDM (Gerardy et al. 2002, in preparation) and the Subaru Telescope (Motohara et al. 2002). We estimate the errors at 0.3 mag, mostly owing to the uncertainty in the distance modulus ( mag) and the nonstellar nature of the spectrum. The UVOIR magnitudes and the bolometric magnitudes derived from the synthetic spectra agree to within 0.1 mag. The IR flux accounts for a significant fraction of the total flux, ranging from % on February 4 to % on March 10, while the UV flux observed by XMM-Newton on February 3 (Pascual et al. 2002) contributes only %.
Synthetic light curves were computed with an LTE radiation hydrodynamics code and a gray -ray transfer code (Iwamoto et al. 2000). TOPS opacities (Magee et al. 1995) were fitted to the ejecta models in order to find an empirical relationship between the Rosseland mean and the electron-scattering opacity.
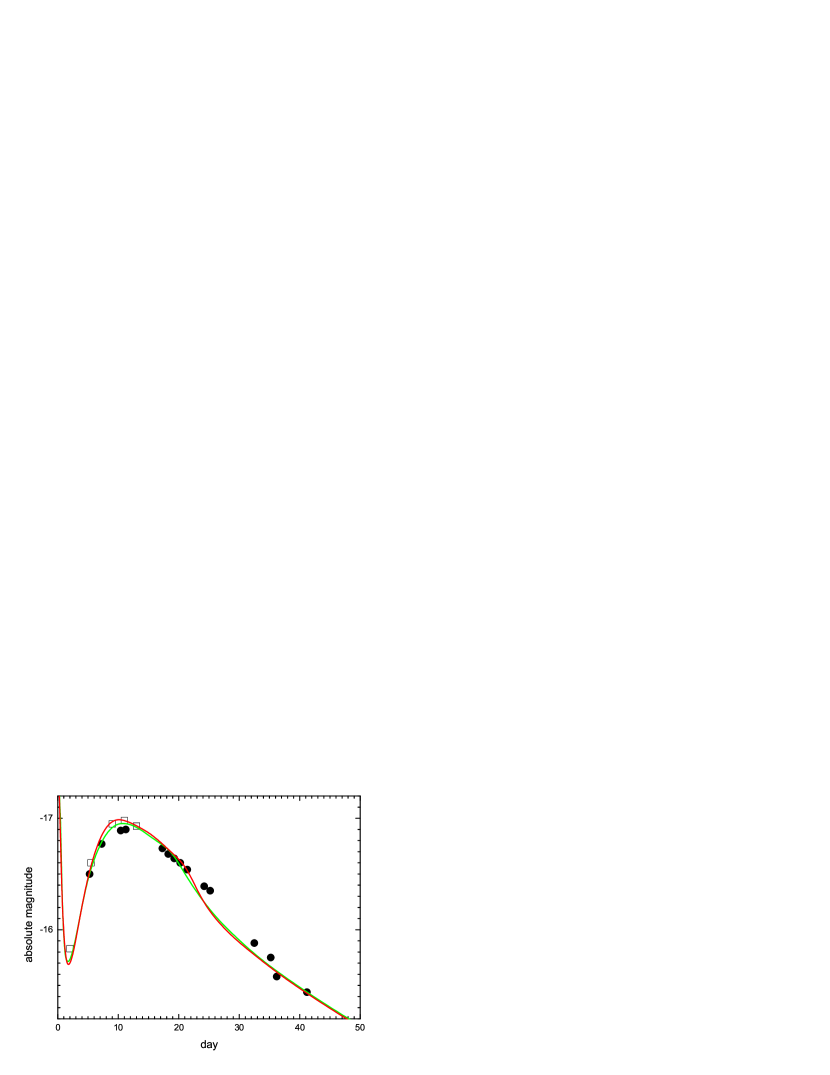
Figure 4 shows the bolometric data and two synthetic light curves computed with the same density structures used for spectrum synthesis. The two models produce very similar light curves, demonstrating the parameter degeneracy (§2). Both model light curves give a satisfactory fit to the observations, confirming the results of the spectral analysis.
To reproduce the observed peak luminosity, a total of 0.07 M⊙of 56Ni is used. In order to achieve a rapid rise of the light curve, and in particular to reproduce the earliest bolometric point on day 2, we had to mix 56Ni out to high velocities, which introduces a local concentration of 56Ni very close to the surface, as in the best-fit model for SN 1998bw (Nakamura et al. 2001). Such significant outward mixing of the newly synthesized 56Ni is consistent with our spectral analysis.
Considering the uncertainties in the UVOIR bolometric light curve, we suggest that Ni) = M⊙. One should not be misled by the fact that SN 2002ap is more luminous in the band than SN 1994I to conclude that the former has a larger 56Ni mass. In fact, the bolometric corrections (B.C. ) in SN 2002ap are quite large, ranging from 0.5 to 0.3, during the first 20 days. In contrast, SN 1994I shows a small B.C. of 0.05 at the luminosity maximum (Iwamoto et al. 1994). Large values for the B.C. are also found in SN 1997ef (Mazzali et al. 2000).
4. Discussion and Conclusions
The spectral evolution of SN 2002ap appears to follow closely that of SN 1997ef, at about twice the rate. The spectra and the light curve of SN 2002ap can be well reproduced by a model with ejected heavy-element mass = 2.5–5 M⊙ and –10. Both and are much smaller than those of SNe 1998bw and 1997ef (but they could be larger if a significant amount of He is present). The 56Ni mass is estimated to be M⊙, which is similar to that of normal core-collapse SNe such as SNe 1987A and 1994I.
Although SN 2002ap appears to lie between classical core-collapse SNe and hypernovae, it should be regarded as a hypernova because its kinetic energy is distinctly higher than for classical core-collapse SNe. In other words, the broad spectral features that characterize hypernovae are the results of a high kinetic energy. Also, SN 2002ap was not more luminous than normal core-collapse SNe. Therefore brightness alone should not be used to discriminate hypernovae from normal SNe, while the criterion should be a high kinetic energy. Further examples of hypernovae are necessary in order to establish whether a firm boundary between the two groups exists.
For these values of , , and Ni), we can constrain the progenitor’s main-sequence mass and the remnant mass . Modeling the explosions of C+O stars with various masses, we obtain Ni) as a function of the parameter set (, , ). The model which is most consistent with our estimates of (, ) is one with M⊙, M⊙, and . The 5.0 C+O core forms in a He core of mass M⊙, corresponding to a main-sequence mass –25 M⊙. The relation depends on convection and metallicity (e.g., Nomoto & Hashimoto 1988; Umeda & Nomoto 2002). Given the non-detection of the progenitor in pre-discovery images of M74 (Smartt et al. 2002), the above mass range seems to be most consistent with the progenitor being a member of an interacting binary system.
In order to determine the mass of O and that of 56Ni, whose decay to 56Fe via 56Co will be powering the nebular spectrum, it is very important that spectra are taken in the fully nebular epoch. There is already some evidence for net emission in the Ca ii near-IR triplet in a February 21 spectrum, which has an epoch of 24 days and looks similar to SN 1997ef on about day 42. Eventually, though, O i 6300 should become the strongest line. Because of the fast evolution of SN 2002ap, the time when the SN is again visible (late June 2002), corresponding to an epoch of 5 months, should already be suitable.
The estimated progenitor mass and explosion energy are both smaller than those of previous “hypernovae” such as SNe 1998bw and 1997ef, but larger than those of normal core-collapse SNe such as SN 1999em. There appears to be a correlation between initial stellar mass and explosion energy, but further observational examples are needed to establish the relation. In particular, it is unclear what fraction of massive stars with M⊙ explode energetically. Massive core-collapse SNe with either a normal explosion energy (e.g., SN 1984L; Swartz & Wheeler 1991) or a very small one (SN 1997D; Turatto et al. 1999) also appear to exist.
Given the estimated mass of the progenitor, binary interaction including the spiral-in of a companion star (Nomoto et al. 2001) is probably required in order for it to lose its hydrogen and some (or most) of its helium envelope. This would suggest that the progenitor was in a state of high rotation. It is possible that a high rotation rate and/or envelope ejection are also necessary conditions for the birth of a hypernova.
The high explosion energy of SNe 1998bw and 1997ef may be related to the formation of a black hole through the extraction of energy from the black hole-accretion disk system. Also in the case of SN 2002ap, the expected remnant mass ( M⊙) exceeds the maximum neutron star mass, even though the estimated main-sequence mass (20-25 M⊙) is not extremely large.
SN 2002ap was not apparently associated with a GRB. This may actually be not so surprising, since the explosion energy of SN 2002ap is about a factor of 5-10 smaller than that of SN 1998bw, as also indicated by the weak radio signature (Berger et al. 2002). The present data show no clear signature of asymmetry, except perhaps for some polarization (Wang et al. 2002; Kawabata et al. 2002), which is smaller than that of SN 1998bw. This suggests that the degree of asphericity is smaller in SN 2002ap and that the possible “jet” may have been weaker, which makes GRB generation more difficult. It will therefore be interesting to see whether the photosphere persists to very low velocities, as it did in SN 1997ef, in apparent contradiction with one-dimensional explosion models.
Acknowledgements. We thank Peter Meikle for allowing us to use the 30 January spectrum prior to publication. This work would not have been possible without the effort and enthusiasm of the staff at all the different observatories. This work has been supported in part by the grant-in-Aid for Scientific Research (12640233, 14047206, 14540223) and COE research (07CE2002) of the Ministry of Education, Science, Culture, Sports, and Technology in Japan. J.S. Deng is supported by a JSPS Postdoctoral Fellowship for Foreign Researchers.
References
- Berger et al. (2002) Berger, E., Kulkarni, S. R., & Frail, D. A. 2002, IAU Circ., No. 7817
- Filippenko (1997) Filippenko, A. V. 1997, ARA&A, 35, 309
- Filippenko & Chornock (2002) Filippenko, A. V., & Chornock, R. 2002, IAU Circ., No. 7825
- Galama et al. (1998) Galama, T. J., Vreeswijk, P. M., van Paradijs, J., et al. 1998, Nature, 395, 670
- Gal-Yam et al (2002a) Gal-Yam A., & Shemmer, O. 2002a, IAU Circ., No. 7811
- Gal-Yam et al (2002b) Gal-Yam A., Ofek, E.O., & Shemmer, O. 2002b, MNRAS, in press
- Germany (00) Germany, L.M., Reiss, D.J., Schmidt, B.P., & Sadler, E.M. 2000, ApJ, 533, 320
- Hirose (2002) Hirose, Y. 2002, IAU Circ., 7810
- Hurley et al. (2002) Hurley, K., Mazets, E., Guidorzi, C., et al. 2002, GCN GRB Observation Report, No. 1252
- Iwamoto et ql. (1994) Iwamoto, K., Nomoto, K., Hoflich, P., et al. 1994, ApJ, 437, L115
- Iwamoto et al. (1998) Iwamoto, K., Mazzali, P. A., Nomoto, K., Umeda, H, et al. 1998, Nature, 395, 672
- Iwamoto et al. (2000) Iwamoto, K., Nakamura, T., Nomoto, K., Mazzali, P. A, et al. 2000, ApJ, 534, 660
- Kawabata et al. (2002) Kawabata, K. S., Kosugi, G., Sasaki, T., et al. 2002, IAU Circ., No. 7835
- Kinugasa et al. (2002) Kinugasa, K., Kawakita, H., Ayani, K. et al. 2002, IAU Circ., No. 7811
- Lucy (1999) Lucy, L. B. 1999, A&A, 345, 211
- Maeda et al. (2002) Maeda. K., Nakumura, T., Nomoto, K., Mazzali, .P.A., et al. 2002, ApJ, 565, 405
- Magee et al. (1995) Magee, N. H., Abdallah, J. Jr., Clark, R. E. H, et al. 1995, in ASP Conf. Ser. 78., ed. S. J. Adelman, & W. L. Wiese (San Francisco: ASP), 51
- Matheson et al. (2001) Matheson, T., Filippenko, A. V., Li, W., Leonard, D. C., & Shields, J. C. 2001, AJ, 121, 1648
- Mattila (2002) Mattila, S., Meikle, P., & Chambers, K. 2002, IAU Circ., No. 7820
- Mazzali (2000) Mazzali, P. A. 2000, A&A, 363, 705
- Mazzali et al. (2000) Mazzali, P. A., Iwamoto, K, & Nomoto, K 2000, ApJ, 545, 407
- Mazzali et al. (2001) Mazzali, P. A., Nomoto, K., Patat, F., & Maeda, K. 2001, ApJ, 559, 1047
- Mazzali, P.A., & Lucy, L.B. (1993) Mazzali, P. A., & Lucy, L. B. 1993, A&A, 279, 447
- Meikle et al. (2002) Meikle, P., Lucy, L., Smartt, S., et al. 2002, IAU Circ., No. 7811
- Motohara et al. (2002) Motohara, K., Nomoto, K., Gerardy, C., et al. 2002, IAU Circ., No. 7834
- Nakamura et al. (2001) Nakamura, T., Mazzali, P. A, Nomoto, K., & Iwamoto, K. 2001, ApJ, 565, 405
- Nakano (2002) Nakano, S., Kushida, R., & Li, W. 2002, IAU Circ., 7810
- Nomoto & Hashimoto (1988) Nomoto, K., & Hashimoto, M. 1988, Phys. Rep., 163, 13
- Nomoto et al. (1994) Nomoto K., Yamaoka H., Pols. O. R., et al. 1994, Nature, 371, 6494
- Nomoto et al. (2001) Nomoto, K., et al. 2001, in “Supernovae and Gamma Ray Bursts,” ed. M. Livio, et al. (Cambridge: Cambridge University Press), 144
- Pascual et al. (2002) Pascual, P. R., Riestra, R. G., Garcia, B. G., et al. 2002, IAU Circ., No. 7821
- Patat et al. (2001) Patat, F, Cappellaro, E., Danziger, J., Mazzali, P. A., et al. 2001, ApJ, 555, 900
- Sharina et al. (1996) Sharina, M. E., Karachentsev, I. D., & Tikhonov, N. A. 1996, A&AS, 119, 499
- Smartt et al. (2002) Smartt, S. J., Vreeswijk, P., Ramirez-Ruiz, E., et al. 2002, ApJ, submitted
- Swartz & Wheeler (1991) Swartz, D. A., & Wheeler, J. C. 1991, ApJ, 379, L13
- Turatto etal (2000) Turatto, M., Suzuki, T., Mazzali, P.A., et al. 2000, ApJ, 534, L57
- Umeda & Nomoto (2002) Umeda, H., & Nomoto, K. 2002, ApJ, 565, 385
- Wang et al. (2002) Wang, L., Baade, D., Fransson, C., et al. 2002, IAU Circ., No. 7820
- Woosley et al. (1999) Woosley, S. E., Eastman, R. G., & Schmidt, B. P. 1999, ApJ, 516, 788
- Yoshii et al. (2002) Yoshii, Y., Minezaki, T., Aoki, T., et al. 2002, IAU Circ., No. 7826