Metallicity Evolution of Damped Lyman Alpha Systems In CDM Cosmology
Abstract
Utilizing a new, high mass resolution () hydrodynamic simulation of a spatially flat CDM cosmological model with detailed microphysics and galaxy formation, including radiation shielding, energy deposition and metal enrichment from supernovae and associated metal cooling/heating, we compute the metallicity evolution of damped Lyman alpha systems (DLAs) and find a reasonable agreement with observations. In particular, the observed slow evolution of the DLA metallicity occurs naturally in the simulation due to the combined effects of physical and observational selection. The slow metallicity evolution is caused by the steady transformation, with increasing time, of the highest metallicity systems to “galaxies”, thus depleting this category, while all the lower metallicity systems show, individually, an increase in metallicity. Although the trend of DLA metallicity with redshift is in good agreement with observations, it appears that the average metallicity of simulated DLAs is higher than observed by dex in the probed redshift range (). Our study indicates that this difference may be attributed to observational selection effects due to dust obscuration. If we allow for a dust obscuration effect, our model reproduces the observed metallicity evolution in both amplitude and slope.
We find that DLAs are not a simple population but probe a range of different systems and the mix changes with redshift. The median luminosity of a DLA, , in units of typical galaxy luminosity at that redshift, , that is, , decreases from to as redshift declines from to , but the absolute luminosity of the median DLA system increases in the same interval by a factor of five from to . About 50% of all metals in the gaseous phase is in DLAs at all times from to , making a rapid downturn at to by , as metals are swept into the hotter components of the IGM as well as locked up in stars.
While not the primary focus of this study, we find that the model provides good matches to observations with respect to column density distribution and evolution of neutral gas content, if the same dust obscuration is taken into account. We find , depending on the effect of dust obscuration.
1 Introduction
Since their discovery, it has been recognized that studies of the damped Ly systems help reveal the chemical enrichment history of the universe in neutral gas. These quasar absorption line systems, defined to exhibit , dominate the neutral hydrogen content of the universe up to (Storrie-Lombardi and Wolfe 2000; Peroux et al. 2002) and exhibit metal-line profiles which yield accurate metallicity measurements (e.g., Prochaska et al. 2001). The first comprehensive metallicity survey of the damped systems (Pettini et al. 1994) revealed a sub-solar metallicity in systems at with a considerable scatter from system to system. By weighting these individual Zn metallicity measurements by the value of the system, the authors derived a global mean metallicity dex. This important quantity is independent of the morphology, age, and history of the individual damped Ly systems. Further observations (Pettini et al. 1997) supported the initial work and suggested minimal evolution in from (Pettini 1999).
Prochaska & Wolfe (2000a) extended metallicity surveys of the damped systems to through echelle observations on the Keck I 10m telescope. Their results also favored minimal evolution in the metallicity of HI gas from , although their initial sample suffered from small number statistics. More recently, Prochaska, Gawiser, & Wolfe (2001) and Prochaska & Wolfe (2002) have enlarged the sample to systems at and have confirmed the main conclusions from Prochaska & Wolfe (2000a): (1) the -weighted mean metallicity exhibits minimal evolution from and a small but significant decline at ; (2) no individual damped system shows a metallicity below 1/1000 solar; and (3) the unweighted mean metallicity closely tracks the weighted mean over this entire redshift range.
At low redshift ), the situation is far less certain. There are many fewer observations (Boissé et al. 1998; Pettini et al. 2000) and the majority of systems have very low values such that the weighted mean is entirely dominated by one or two DLAs. Although the current value for at roughly matches the values, it is very possible that this is the result of small number statistics (Kulkarni & Fall 2002).
On the theoretical front, various groups have composed models to predict the chemical evolution history of the universe. The majority of these (Pei & Fall 1995; Pei et al. 1999; Malaney & Chaboyer 1996; Edmunds & Phillips 1997) compute the evolution of gas metallicity globally. All such calculations have been constrained to yield at and all predict marked evolution in from to the present epoch. In comparison with the observations, these scenarios predict more substantial evolution in at high redshift than is currently observed. As our subsequent results would indicate, this global approach does not accurately reflect the unique evolution of the DLA sub population. Somerville, Primack, & Faber (2001) used semi-analytic models to derive metallicity evolution and find reasonable agreement with observations. It is, however, difficult to gauge whether the lack of treatment of the intergalactic medium in the semi-analytic models has substantially affected the metallicity in DLAs.
We have followed a direct approach using cosmological hydrodynamic simulations with galaxy formation. In an earlier paper (Cen & Ostriker 1999) we attempted to compute cosmic chemical evolution using a simulation with a baryonic mass resolution of and a spatial resolution of kpc comoving. While the agreement with observations found in a variety of environments ranging from rich clusters of galaxies to low column density Lyman alpha clouds was encouraging, we found ourselves unable to adequately address the evolution of metallicity of dense and small systems such as DLAs. Tissera et al. (2001) also used direct (SPH) simulations to study the chemical evolution of DLAs but their simulations suffered substantially from limited mass resolution. Since DLAa are the prime repository of cool gas phase baryons, we thought it important to study them using a new simulation especially designed for this purpose. Our new simulation has a baryonic mass resolution of and a spatial resolution of kpc comoving, and we now investigate the evolution of metallicity of DLAs. The central questions that we would like to address are: Why is the observed evolution of metallicity of DLAs so mild from , while we know that the star formation primarily occurs during this redshift interval? What is the expected distribution of metallicity among DLAs? How does the evolution of metallicity of DLAs compare to that of the all gas in the universe globally averaged and to stellar metallicity? In what sense (if any) are DLAs progenitors of normal galaxies? A description of the simulation is given in §2. Results are presented defined in §3, followed by conclusions in §4.
We would like to point out at outset that we are interested in “cosmic chemical evolution” of DLAs, which is a convolution of true galactic evolution and observational selection of DLAs. This has a different meaning for investigators who work in galactic studies where the same term means internal galactic chemical evolution with some chosen boundary conditions. Our simulations are admittedly inadequate for explaining any detailed chemical evolution of individual galaxies, for which studies such as that by Mathlin et al. (2001) can make much finer predictions to compare with respective observations. But, as they pointed out, galaxy interaction and merger, and gas infall/outflow (which are known to be important processes in hierarchical structure formation) may have played a major role but were ignored in their treatment. Our simulations, on the other hand, take into account mergers, gas infall/outflow and other galaxy interactions and thus provide a complementary approach to this problem.
2 Simulations
The results reported on here are based on a new computation of the evolution of the intergalactic medium in a cold dark matter model with a cosmological constant. The relevant model parameters are: , , , , km/s/Mpc and . The cosmological model is normalized to both the cosmic microwave background (CMB) temperature fluctuations measured by COBE on large scales (e.g., Bunn & White 1997) and the observed abundance of clusters of galaxies in the local universe (e.g., Cen 1998), and it is close to both the concordance model of Ostriker & Steinhardt (1995) and consistent with the recent high redshift supernova results (Reiss et al. 1998) and CMB measurement on intermediate scales (de Bernardis et al. 2000; Balbi et al. 2000). Retrospectively, this model is close to WMAP (Wilkinson Microwave Anisotropy Probe) normalized model (Spergel et al. 2003). The simulation box size is Mpc having gas cells and dark matter particles with the mean baryonic mass in a cell being and the dark matter particle mass being . The nominal spatial resolution for both gas and dark matter is comoving kpc. This mass resolution is considerably better than of most cosmological simulations, but the spatial resolution, while significantly inferior to that obtained in both the SPH and AMR schemes, is, we believe, adequate for the present purpose.
The initial conditions adopted are those for Gaussian processes with the phases of the different waves being random and uncorrelated. The initial condition is generated by the COSMICS software package kindly provided by E. Bertschinger (2001). The simulated box is an unconstrained and truly random realization of the model universe of that size. Numerical methods of the cosmological hydrodynamic code and input physical ingredients have been described in our earlier papers (Cen & Ostriker 1999a,b). Here we give a more detailed description.
The simulation integrates five sets of equations simultaneously: the Euler equations for gas dynamics, rate equations for different hydrogen and helium species at different ionizational states, the Vlasov equation for dynamics of collisionless particles, the Poisson’s equation for obtaining the gravitational potential field and the equation governing the evolution of the intergalactic ionizing radiation field, all in cosmological comoving coordinates. The gasdynamical equations are solved using the TVD shock capturing code (Ryu et al. 1993) on an uniform mesh. The rate equations are treated using sub-cycles within a hydrodynamic time step due to much shorter ionization timescales (i.e., the rate equations are very “stiff”). Dark matter particles are advanced in time using the standard particle-mesh (PM) scheme. The gravitational potential on an uniform mesh is solved using the Fast Fourier Transform (FFT) method.
The radiation field from eV to keV is followed in detail with allowance for self-consistently produced radiating sources and sinks in the simulation box and for cosmological effects, i.e., radiation transfer for the mean field is computed with stellar, quasar and bremsstrahlung sources and sinks due to Ly clouds etc. In addition, a local optical depth approximation is adopted to crudely mimic the local shielding effects: each cell is flagged with an hydrogen “optical depth” equal to the product of neutral hydrogen density, hydrogen ionization cross section and the cell size; equivalent ones for neutral helium and singly-ionized helium are also computed. In computing the global sink terms for the radiation field the contribution of each cell is subject to the shielding due to its own “optical depth”. In addition, in computing the local ionization and cooling/heating balance for each cell the same shielding is taken into account to attenuate the external ioinizing radiation field.
The simulation computes for each cell and each timestep detailed cooling and heating processes due to all the principal line and continuum processes for a plasma of primordial composition. Metals ejected from star formation (see below) are followed in detail in a time-dependent, non-equilibrium fashion. Cooling due to metals is computed using a code based on the Raymond-Smith code assuming ionization equilibrium (Cen et al. 1995): at each time step, given the ionizing background radiation field, we compute a lookup table for metal cooling in the temperature-density plane for a gas with solar metallicity, then metal cooling rate for each gas cell is computed using the appropriate entry in that plane multiplied by its metallicity (in solar units). In addition, Compton cooling due to the microwave background radiation field and Comption cooling/heating due to the self-consistently produced (see below) X-ray and high energy background are also included.
We follow star formation using a well defined (heuristic but plausible) prescription used by us in our earlier work (Cen & Ostriker 1992,1993) and similar to that of other investigators (Katz, Hernquist, & Weinberg 1992; Katz, Weinberg, & Hernquist 1996; Steinmetz 1996; Gnedin & Ostriker 1997). A stellar particle of mass is created (the same amount is removed from the gas mass in the cell), if the gas in a cell at any time meets the following three conditions simultaneously: (i) flow contracting, (ii) cooling time less than dynamic time, and (iii) Jeans unstable, where is the timestep, yrs), is the dynamical time of the cell, is the baryonic gas mass in the cell and is star formation efficiency. In essence, we follow the classic work of Eggen, Lynden-Bell & Sandage (1962) and assume that the dynamical free-fall and galaxy formation timescales are simply related. Each stellar particle has a number of other attributes at birth, including formation time , initial gas metallicity and the free-fall time in the birth cell . The typical mass of a stellar particle in the simulation is about one million solar masses; in other words, these stellar particles are like coeval globular clusters.
Stellar particles are subsequently treated dynamically as collisionless particles, except that feedback from star formation is allowed in three forms: UV ionizing field, supernova kinetic energy, and metal rich gas, all being proportional to the local star formation rate. Supernova energy and metals are ejected into the local gas cells where stellar particles are located. Supernova energy feedback into the intergalactic medium (IGM) is included with an efficiency (in terms of rest-mass energy of total formed stars) of ; i.e., for of stars formed amount of energy from supernovae is released to the IGM, where is the speed of light. Two types of ionizing radiation sources are used: one characteristic of star formation regions and the other characteristic of quasars, with efficiencies (i.e., the fraction of rest-mass energy converted into ionizing radiation) of , and , respectively. We adopt the emission spectrum of massive stars from Scalo (1986) and that of quasars from Edelson & Malkan (1986). In addition, hot, shocked regions (like clusters of galaxies) emit ionizing photons due to bremsstrahlung radiation. The temporal release of the all three feedback components at time has the same form: , where is the formation time of a stellar particle. The UV component is simply averaged over the box, since the light propagation time across our box is small compared to the timesteps.
It is useful to state clearly how we treat the chemical evolution in our simulations. We did not separately make any adjustments to fit to the observed distributions and evolution of metals, but assumed a specific efficiency of metal formation, an adopted “yield” (Arnett 1996), the percentage of stellar mass that is ejected back into IGM as metals, of . This is the only adjustable parameter which significantly effects metallicity and, to zero-th order, all quoted metallicity scale with this assumed yield. Metals in the IGM (assuming the standard solar composition) are followed as a separate variable (analogous to the total gas density) with the same hydrocode. In essence, we compute in current simulations the metals enrichment process of the IGM due to type II supernovae. Furthermore, we use Zn to represent the total metals (i.e., O), i.e., we adopt . While the origin of Zn may be unclear, our justification is purely empirical based on observations. The assumption of is consistent with the extant, albeit, small set of DLAs whose oxygen abundances have been detected (Prochaska & Wolfe 2002; Pettini et al. 2002); there is no evidence to the contrary. We convert observed metallicities of DLAs expressed in other species to Zn abundance, calibrated by observed empirical relations for DLAs.
The model reproduces the observed UV background as a function of redshift, the redshift distribution of star formation (“Madau Plot”; Nagamine, Cen & Ostriker 1999), and the galaxy luminosity function (Nagamine et al. 2001b). We find that the computed metallicity distributions over a wide range of environments, including clusters of galaxies, damped Lyman systems, Lyman alpha forest and stars, are in broad agreement with observations (Cen & Ostriker 1999b; Nagamine et al. 2001a,b; Cen et al. 2001), lending us confidence that the computed metal distribution in the intermediate regions under consideration (between Lyman alpha forest and clusters of galaxies) in this high resolution simulation may be a good approximation to the model universe.
We identify a DLA with a system with a line-of-sight (LOS) neutral hydrogen column density higher than cm-2. This method is similar to what is employed to observationally classify DLAs. In addition, we can easily identify, in three-dimension, host galaxies that are responsible for DLAs. A host galaxy is associated with a DLA by comparing their spatial locations. Galaxies in the simulation box are identified using a scheme described in Nagamine et al. (2000), with each having a set of attributes including mean formation redshift and initial gas metallicity. Each galaxy consists of sub-units each with formation time, mass, metallicity and we compute the luminosity of each galaxy using a population synthesis code (e.g., Bruzual 2000). Each galaxy is also associated with the dark matter mass around it or dark matter halo and virial velocity of the whole system. We note that multiple DLAs may be associated with a single host galaxies, simply because different LOS through a galaxy may be observed as DLAs. The typical impact parameter is comparable to the cell size. Throughout the paper we refer to ”DLA galaxies” as the host galaxies of DLAs.
3 Results
3.1 Pictures
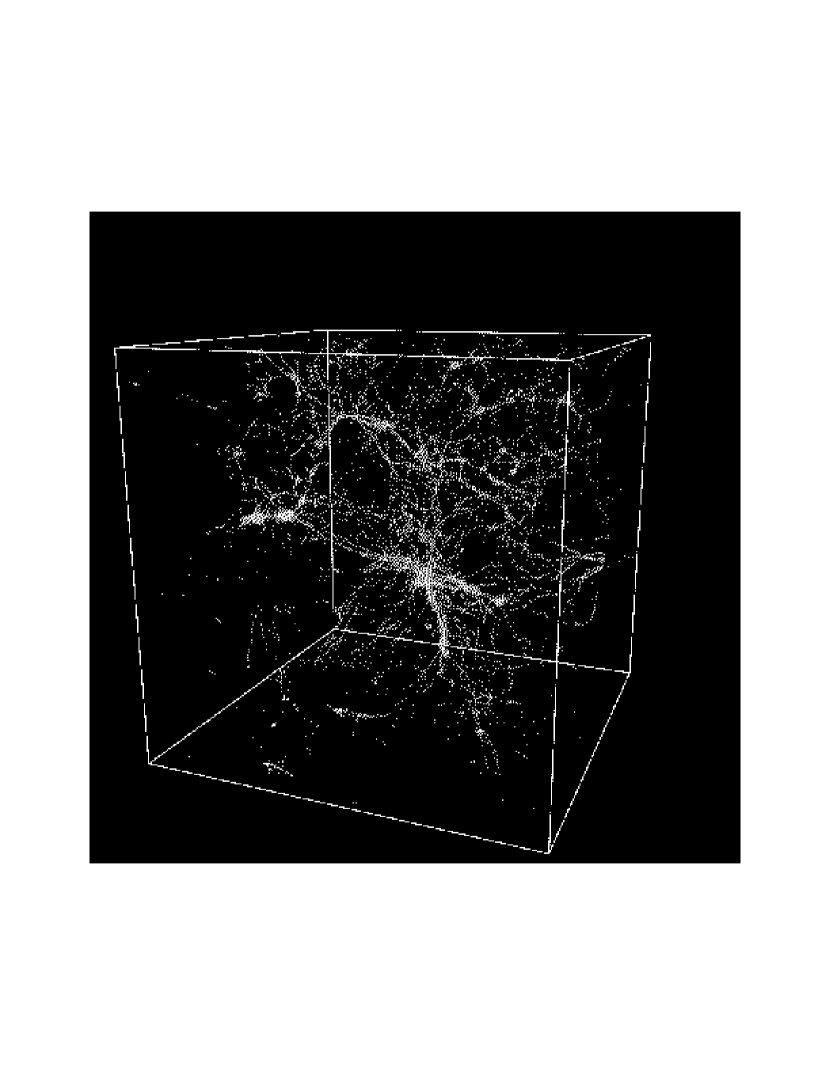
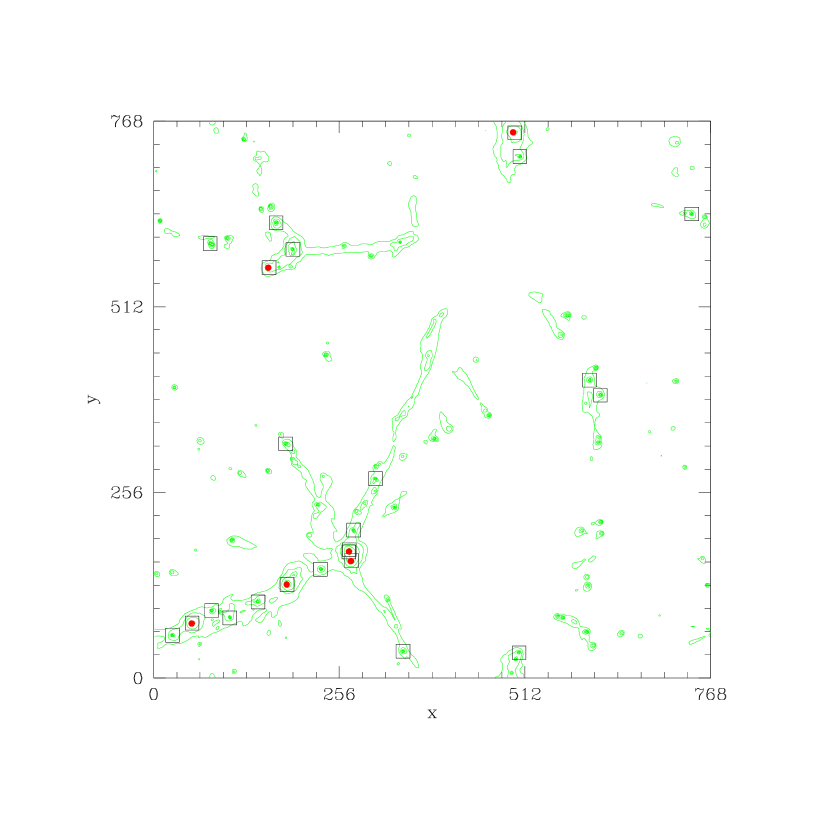
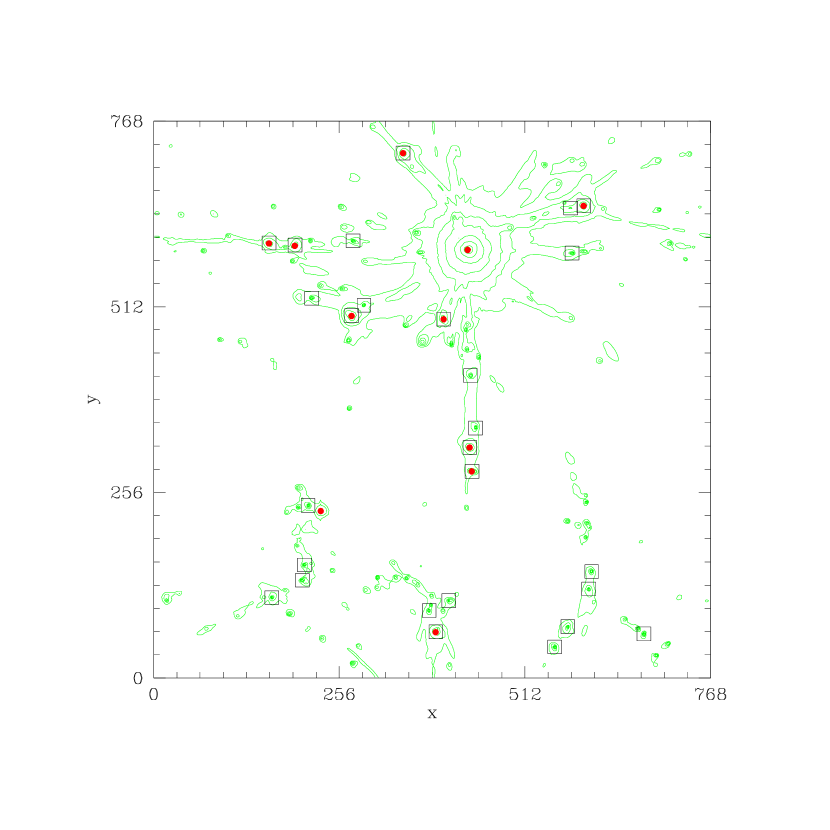
A visual impression of the gas distribution in our box is presented in Figure (1), which shows the total gas distribution at redshift . DLAs are typically located in or near the highest density regions denoted in red. More quantitatively, in Figure (2) we show two slices of gas density distribution with a size of Mpc3 each at . The left slice is typical and the right slice contains the richest cluster in the simulation. We see that rich clusters are hostile environments for DLAs; DLAs tend to reside in filaments which bridge and surround clusters. This is due to the same physical effect described in Blanton et al. (1999). DLAs are positively correlated with high total density but negatively correlated with high environmental temperature (at least at the high temperature end); the specification of one variable - density - does not enable one to predict the likely occurance of collapsed systems. While more quantitative comparisons can not be made, this finding appears to be consistent with the fact that the observed spiral galaxies in clusters have lower HI content (Haynes et al. 1990; Haynes & Giovanelli 1991). In Figure 2 red dots show galaxies having stellar mass and we see that roughly 30% of DLAs today are associated with massive galaxies like the Milky Way. We will return to this issue to present more quantitative results later.
3.2 Quantitative Results
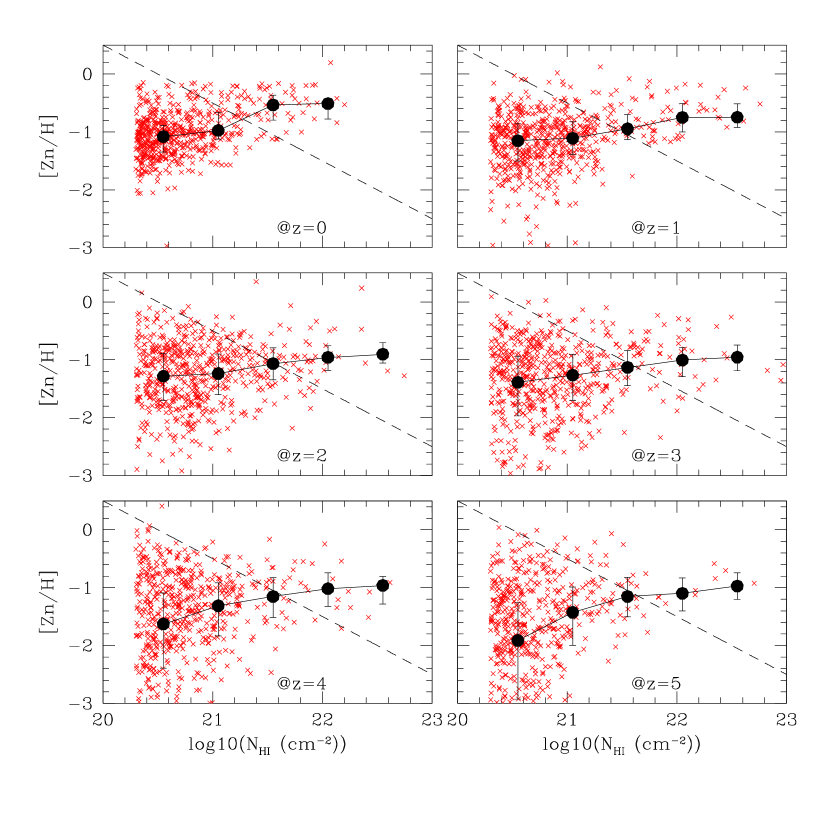

Let us now turn to quantitative results. Figure (3) shows the metallicity distribution of DLAs as a function of neutral hydrogen column density, . At each redshift there is a weak trend of higher metallicity correlating with higher column density. Although the variance is large, as indicated by the quartile errorbars, this is, at first sight, inconsistent with observations where the opposite trend is seen. There may be important observational selection effects that have not yet been included in our analyses, which have caused this apparent inconsistency. In particular, dust obscuration may have played a large role. We will explore this possibility here.
To illustrate the dust obscuration effect we show, in each panel in Figure 3, a dashed line with , intending to approximately separate the region that is expected to be affected by dust obscuration (upper right) and the region that is not (lower left), partly motivated by observations. If DLAs in the upper right side of the dashed lines had obscured QSOs, one would expect to see a large deficit of DLAs there. In fact, there is some observational indication that this effect may be there (Boissé et al. 1998). In Figure 4 we plot the median metallicities (with quartile errorbars) for the “unobscured” DLA population at . We see that the weak positive correlation between the median metallicity and column density of DLAs seen in Figure 3 is now reversed, with a result that is consistent with the observed trend (Boissé et al. 1998).
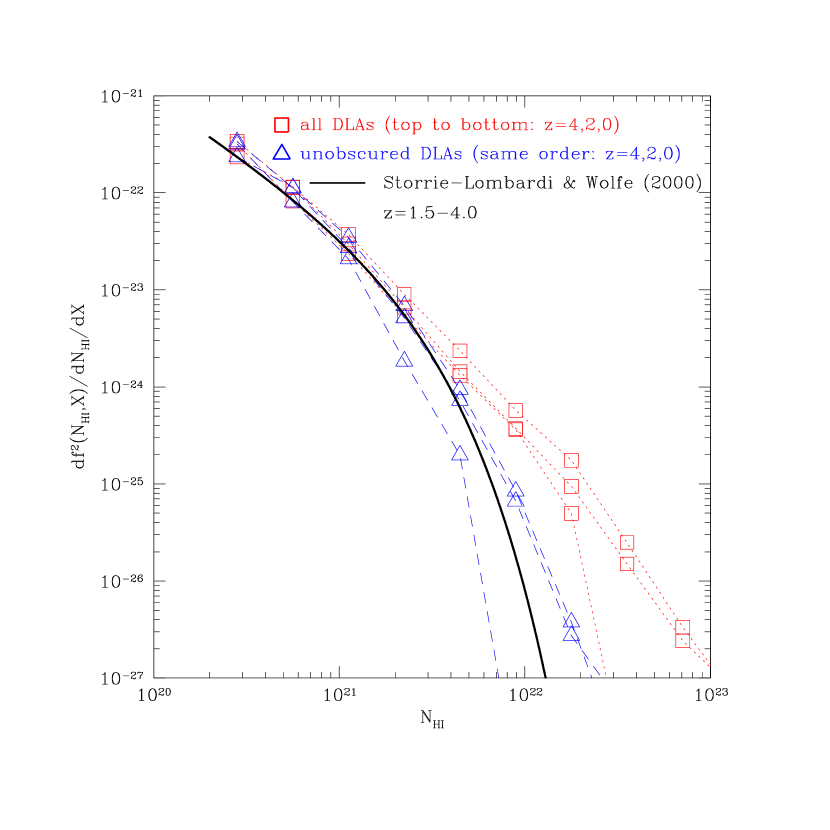
As a consistency check we show in Figure 5 the column density distributions of DLAs at three redshifts (). We plotted the total DLA population (squares) as well as the “unobscured” DLA population, as defined in Figure 3. Quite surprisingly, the “unobscured” DLA population provides a remarkably good fit to observations shown as the thick solid curve (Storrie-Lombardi & Wolfe 2000). Therefore, our assumption of dust obscuration is at least self-consistent and the model would provide a reasonable fit to observations, if the observed DLAs are a subset of total DLA population that is not obscured by dust. There is some indication that the model may be producing too many DLA at the low column density end even with the dust obscuration effect taken into account. This, however, may be telling us something about the small-scale power in the adopted cosmological model. It may be explained if the adopted LCDM model has too much small scale power, resulting in more numerous dense neutral cores; note that the small-scale power makes a much larger contribution to the DLA population at high redshift. This implication would be consistent with other independent observations including dwarf galaxies (Flores & Primack 1994; Burkert 1995; Klypin et al. 1999; Moore et al. 1999; McGaugh & de Blok 1998; Navarro & Steinmetz 2000). However, it could also be due to limited numerical simulation of the present simulation, which artificially enlarges density concentrations and thus produces more DLAs than there should be. Future high resolution simulations can check this. However, given that the metallicity dependence on column density is very weak, the conclusions drawn with regard to the metallicity of DLAs and its evolution are relatively robust.
Visual examination of Figure 3 may give the reader the impression that there appears to exist a significant number of DLAs at cm-2 in the model even for the “unobscured” DLA sub population. A more quantitative comparison with observations is now made. The simulation and observations indicate, respectively, that about (30%, 27%) of all DLAs have cm-2 at . At simulation produces about 26% of DLAs having cm-2 , while the corresponding observed number is 23%. The simulation is also in good agreement with observations at low redshift () where a high rate of occurance of such high column density DLAs is seen (Rao & Turnshek 2000). These results are consistent with the close agreement seen in Figure 5. At , however, simulation gives 20% of DLA with cm-2 at versus 2.5% for observed DLAs with cm-2. While the number of observed DLAs at the highest redshift range is still small, this discrepancy at high redshift may be revealing the same alleged flaw of excessive small-scale power in the simulated model.
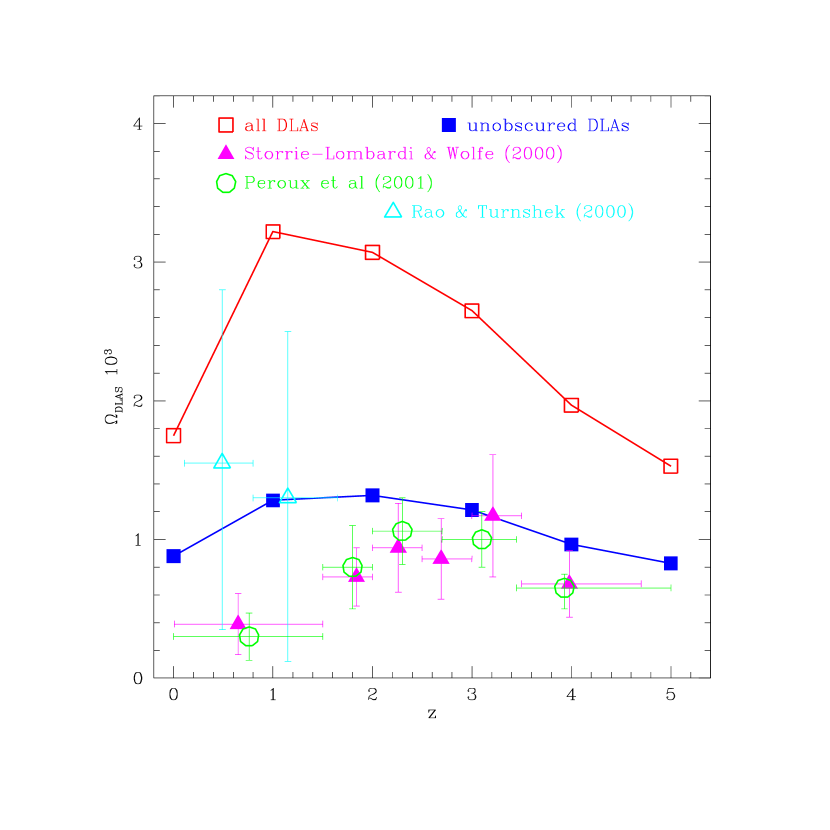
The neutral gas contained in DLAs is another extensively studied quantity, for its obvious link to stars in that the latter must form out of the former, and is closely related to the column density distribution shown in Figure 5. (But note that the converse statement is not necessarily true; not all DLAs are transformed to galaxies. We find many fall into clusters of galaxies and are added to hot, shocked gas.) It thus seems warranted to present the results from the simulation. The reader is reminded that, unlike the metallicity distributions but like the column density distribution shown in Figure 5, the computed fraction of the neutral gas in DLAs is much more prone to numerical effects as well as variations in the cosmological model. Figure 6 presents the neutral gas in DLAs as a function of redshift, compared to extant observations. Note that both the computed and observed neutral gas in DLAs are subject to the uncertainties on the upper limit of the column density distribution, since it is dominated the highest column density DLAs (given that the slope of the column density distribution is substantially flatter than ). Consequently but unsurprisingly, the computed neutral gas in total DLAs is significantly (about a factor ) higher than the observed values at all redshifts, in agreement with the overabundance of high column density DLAs in the simulation seen in Figure 5. But the “unobscured” DLAs provide a reasonable fit to observations, given both observational errors (especially at low redshifts) and numerical uncertainties. Our assumption of dust obscuration is again self-consistent.
Clearly, the real situation due to dust obscuration is much more complicated (see Fall & Pei 1993 for a more detailed treatment). For example, it is not clear what the relationship between dust content and metallicity should be and how large the scatter is. In addition, dust properties are largely uncertain. Nevertheless, such an approximate treatment evidently does have a quite large effect. It appears that the computed model would be in fair agreement with observations with regard to several major diagnostics shown above, if dust obscuration has played an important role. It is, however, too early to celebrate the existence of dust obscuration. There are other observations that indicate dust obscuration effect may not be as large as considered here (Ellison et al. 2001; Prochaska & Wolfe 2002). It is worth noting that we find that in the redshift range the fraction of the number of excluded DLAs due to dust obscuration (those that lie above the dashed lines in Figure 3) is 9.9%. Therefore, in the CORALS radio survey of Ellison et al. (2001) one would have expected to see, on average, only DLAs, that are dust obscured, in their sample of total DLAs. Clearly, a sample size of several-fold larger than the current one would greatly firm up the statistical significance of their important findings and determine the importance of dust obscuration unambiguously. Although the main conclusion of this paper that the metallicity of DLAs is substantially sub-solar and its evolution is relatively mild does not require the adoption of dust obscuration as proposed, other properties of DLAs, including column density distribution, evolution of neutral gas content and metal content in DLAs (see Figure 17 below and related text), are all seen to become consistent with observations under that assumption. Alternatively, there are at least two other possibilities to potentially explain the apparent discrepancies. First, the adopted cosmological model may contain flaws and require revision with regard to its properties related to the formation of DLAs. However, the adopted model is known to reproduce many other observations on scales that overlap with that related to DLAs, including galaxy abundance and clustering, although there is independent evidence that the adopted model may possess excessive power on small scales (see below). Second, it is possible that astrophysical processes related to star formation have not been treated adequately. In particular, metal enrichment of the intergalactic medium treated here is clearly oversimplified. We think this is a possibility that requires substantially more work and deserves further investigation with future simulations that possess more refined treatments of galaxy formation.
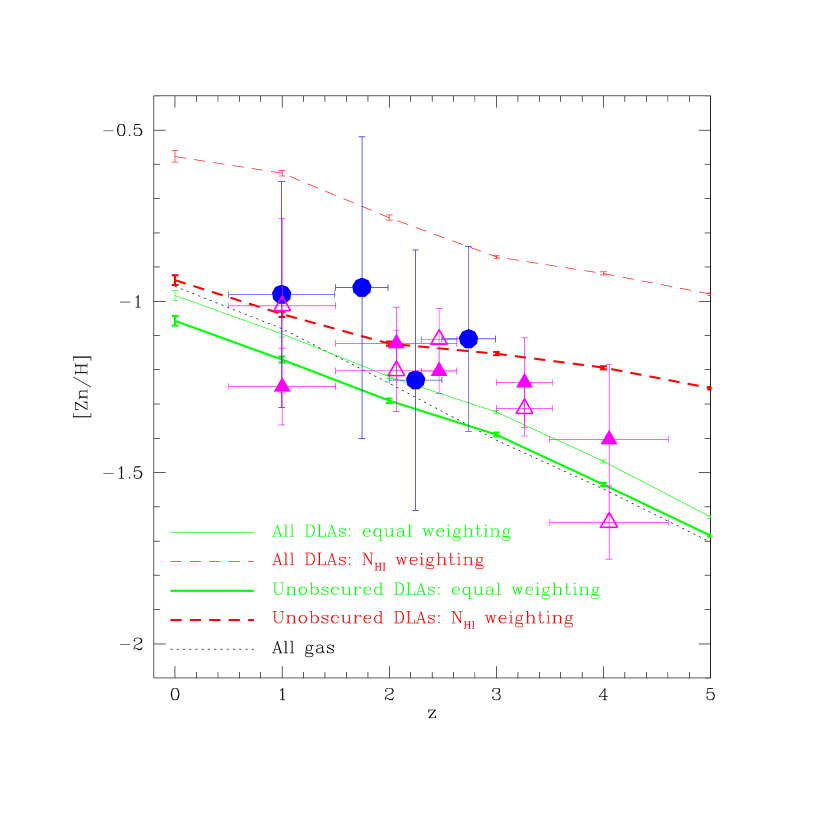
Let us now return to the main issue of metallicity evolution of DLAs. To compute this, we adopt two averaging methods used in analyzing observational data sets. The first method weights each DLA equally, , and the second method weights each DLA by its neutral hydrogen column density, . In Figure 7 we show (thin solid curve) and (thin dashed curve) as a function of redshift, averaged over all DLAs identified in the simulation. The thick solid and thick dashed dotted curves in Figure 7 are and averaged over only the “unobscured” DLAs. Also shown in Figure 7 as a thin dotted curve is the metallicity averaged over all the gas in the universe (using the second averaging method).
Several interesting points may be extracted from Figure 7. The evolution of of all DLAs (thin solid curve) follows rather closely the universal metallicity evolution of all gas (thin dotted curve), which is mainly a coincidence. The evolution of of all DLAs (thin dashed curve), while approximately parallel to and evolution of all gas, has an amplitude about 0.5 dex higher. This indicates that formation of dense neutral cores occurs preferentially in regions that have higher metallicity than the average regions of the universe at all epochs, with the trend that deviation from the mean increases with redshift. However, this systematic difference between and is substantially reduced to dex, if dust obscuration has a significant selection effect on DLAs, as evident from a comparison between the two thick curves, except at the high redshift end ().
There appears to be a reasonable agreement between the model and observations with regard to the evolution of metallicity of unobscured DLAs for both neutral hydrogen column density weighted and unweighted means. There is some mild indication that the unweighted mean of the model may be a little lower than observed or equivalently, there is an overabundance of low metallicity low column density DLAs in the simulation. A possible explanation may be that the current simulation underestimates star formation in small galaxies due to limited resolution; with an ideal resolution, metal enrichment from additional stars in small galaxies would have raised the metallicity in very low metallicity regions () in the present simulation to a higher level. Given the cost of the simulation, we will have to investigate this issue in future simulations. In addition, our oversimplified treatment of chemical evolution might have contributed to the discrepancy.
The most striking property that is borne out from both the simulation and observations is that a typical DLA has a metallicity substantially below the solar value and does not show significant evolution with redshift. Both can be understood by considering selection bias and the source and sink terms for objects termed DLAs. If one were to follow, in a Lagrangian sense, a typical region of dense gas one would find it steadily merging with other such units and finding itself (on average) in systems of higher and higher observed neutral hydrogen column density. Also, since star formation, whether steady or episodic, leads to a monotonic increase in metallicity, the fluid element would show an ever higher metallicity if observed. At some point in time it would be in a system with neutral column density cm-2 and, when observed would be called a “DLA” system. The physical system in which it is embedded would evolve to higher over time and ultimately be identified with either an optical galaxy or, if it should find itself in a very high temperature high density region and the gas be stripped/evaporated, to become an E or S0 system. Typically by the time the metallicity had reached solar values either gas would have been depleted (turned into stars), expelled (by supernovae), or stripped due to interaction with a hot phase intergalactic medium and so the system would no longer have cm-2. All the processes are included in our code, but of course limited by our numerical resolution. Subsequent fluid elements passing along this same sequence would have roughly the same metallicity at the same values of column density . Thus the relation would end up evolving far more slowly as a function of redshift than would the metallicity of a given fluid element.
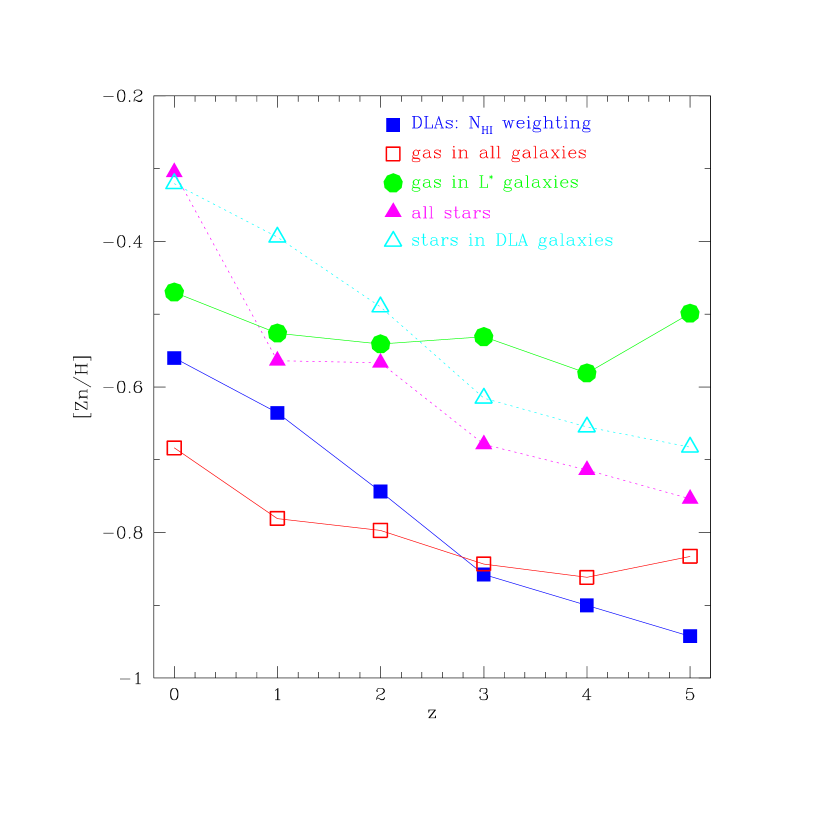
To further elucidate this physical picture, we show, in Figure 8, a comparison between the metallicity of DLA gas and the metallicity of stars. In addition to the globally averaged metallicity of DLA gas we show the stellar metallicity of all stars and stars in DLA galaxies, and gas in all galaxies and in massive (with stellar mass ) galaxies, respectively. A few interesting features may be noted from Figure 8. First, at all epochs the average stellar metallicity is always higher than the gas metallicity of DLAs or all galaxies, which in turn is higher than the average gas in the universe (see Figure 7). This finding is very interesting and perhaps seems counter-intuitive at first instance: since stars are formed out of gas in the galaxy, one naively would expect that the gas should always have a higher metallicity than stars due to enrichment by subsequently formed stars. This occurs in the “closed box” model, where the metallicity of gas in galaxies is typically twice the metallicity of the stars in that galaxy. But, in the hierarchical structure formation model, fresh, lower metallicity gas is continuously accreted onto DLAs (or DLAs-to-be) or DLAs form from mergers of smaller systems with gas of lower metallicity. In addition, metal rich gas is steadily ejected from galaxies through the action of supernovae. This process has been invoked to solve the so-called G-dwarf problem (Ostriker & Thuan 1975). It is also interesting to note that the gas in the massive galaxies at high redshift () does have higher metallicities than their resident stars, probably indicating that these massive galaxies constitute relatively closed boxes.
Second, the gas in the most massive galaxies has noticeably higher metallicity than both gas in DLAs and in all galaxies. This is consistent with the picture outlined above in that higher metallicity systems can not maintain the required high neutral hydrogen column density due to either hotter environment or hotter internal gas.
Third, stars in DLAs (open triangles) generally have higher metallicities than typical stars (solid triangles), especially at redshift . This would be consistent with observations that less massive galaxies generally have lower metallicity than higher mass galaxies, if DLAs are more massive than a typical galaxy at high redshift. This indeed turns out to be the case [see Figure 9 below, where we show that DLAs are more massive than the (one of the two parameters in the Schechter function) galaxies at .] At lower redshift, the trend is somewhat reversed (also consistent with Figure 9.)
Fourth, the metallicity of the gas in DLAs (solid squares) displays an interesting crossover at : at the average gas in all galaxies (open squares) has a higher metallicity than the average gas in DLAs, while the reverse is true at . This may indicate that at star formation in low mass systems is less efficient than in more massive systems so that gas is less metal enriched. This trend is further consistent with the result that the gas in the most massive galaxies (solid dots in Figure 6) has a metallicity higher than DLAs (solid squares).
Finally, we see by that the gas even in the most massive galaxies has a metallicity lower than average stars or stars in DLAs (stars in the same massive galaxies have comparable and very slightly higher metallicity than stars in DLAs at ; not plotted). If one associates the most massive galaxies with large spiral galaxies such as the Milky Way, one would expect to see gas metallicity typically higher than stellar metallicity. What is happening here is that these most massive galaxies are elliptical systems and live in clusters where galactic gas has been stripped off; thus the gas metallicity for these massive galaxies is actually the gas metallicity of the intra-cluster gas, whose value ( solar) seems consistent with observed cluster gas metallicity (Arnaud et al. 1994; Mushotzky et al. 1996; Tamura et al. 1996; Mushotzky & Lowenstein 1997), indicating that the adopted yield based on the theory of stellar interior is approximately correct empirically. Note that we do not include metal enrichment due to type Ia supernovae in the present simulations. Just as a consistency check, we find that 115 galaxies having [Zn/H]=[-0.1, 0.2], which is quite consistent with the number of galaxies that one expects from a simulation box of this size, indicating that Milky Way-like galaxies can properly be accounted for.
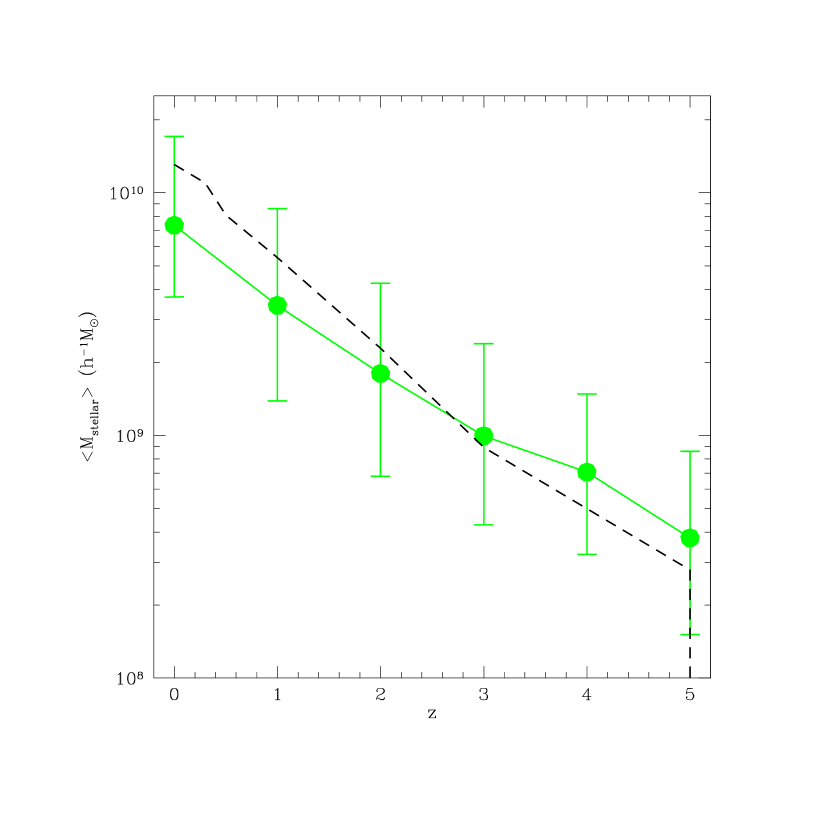
Needless to say galaxy formation and DLA formation are intimately related. It is important to know what type of galaxies constitute the host galaxies of DLAs. In Figure 9 we show the median stellar mass (with quartile errorbars) of DLAs as a function of redshift. Not surprisingly, and consistent with the depicted description above, DLAs correspond to progressively larger galaxies towards lower redshift. A typical DLA follows closely the at all redshifts, with a slight tilt such that at low redshift () a typical DLA is sub and the reverse is true at high redshift (). While about 30% of DLAs at are due to galaxies (consistent with the visual inspection of Figure 2), consistent with local observations (Rao & Turnshek 2000), DLAs at are typically in galaxies less luminous than with some fractian in very faint galaxies (). The median luminosity of a DLA, , in units of typical galaxy luminosity at that redshift, , that is, decreases from to as redshift declines from to , but the absolute luminosity of the median DLA system increases in the same interval by a factor of five from to . We note that the stellar masses for a typical DLA galaxy at is , about one order of magnitude lower than the stellar masses deduced for LBGs (Shapley et al. 2001). This implies that DLAs and LBGs are different populations or at least that a typical DLA galaxy does not correspond to an LBG (Colbert & Malkan 2001).

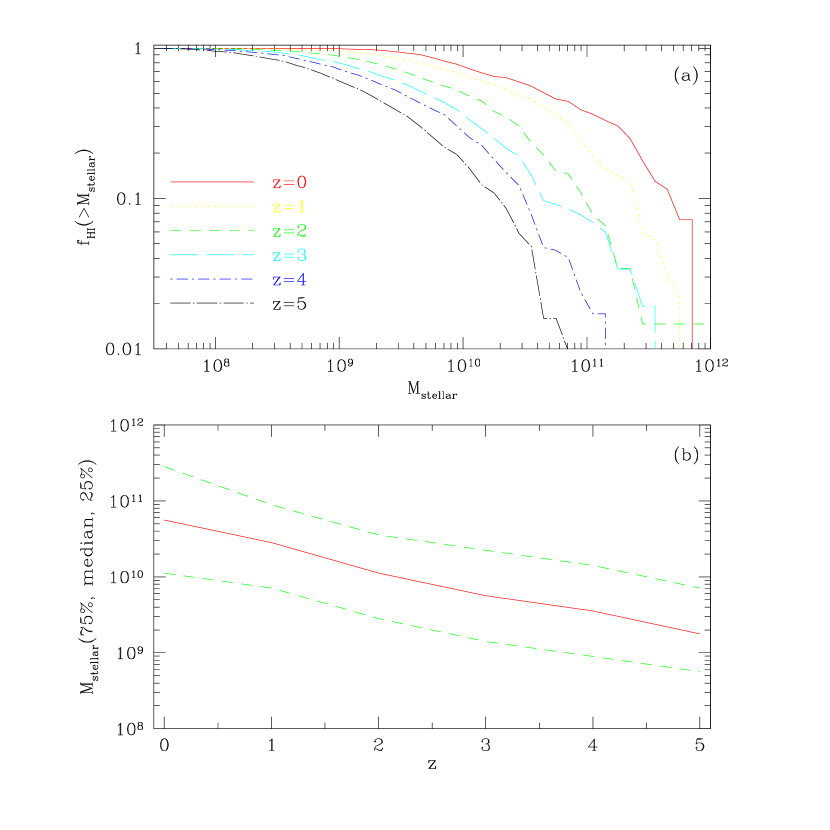
Figure 10 shows the cumulative number density of DLAs as a function of velocity width at (curves). The velocity width is defined as , where as is the rotation velocity of the DLA galaxy at radius kpc. The agreement between the simulation and observations is reasonably good at the high width end but the disagreement at the low width end is quite severe, where a factor of overabundance in the simulation is seen. This discrepancy was seen earlier in the column density distribution in Figure 5, which, as we suggested, may indicate excessive small-scale power in the adopted model. Put aside the difference for a moment, it is clear that DLAs are composed of galaxies with a broad range of velocity structures. Our simulation says that most of DLAs are due to small, relatively isolated galaxies. In the redshift range where comparisons can be made the results found here are in good agreement with extant observations (Steidel et al. 1995; Lanzetta et al. 1997; Le Brun et al. 1997; Miller, Knezek, & Bregman 1999; Bunker et al. 1999; Cohen 2000; Kulkarni et al. 2000). However, this finding is not at odds with local 21cm observations, which find most of the neutral hydrogen gas in the most massive galaxies. To clarify, panel (a) of Figure 11 shows the cumulative fraction of neutral hydrogen mass as a function of galactic stellar mass. Panel (b) of Figure 11 shows in a slightly different way the same information: the solid curve indicates the median galaxy stellar mass and the two dashed curves indicate the quartile points of galaxy stellar masses with regard to the fraction of total neutral hydrogen mass. Indeed, we find that most of the neutral hydrogen gas mass at is in large (spiral) galaxies; of neutral hydrogen gas mass at is in or larger galaxies, consistent with observations (Zwaan et al. 2001).
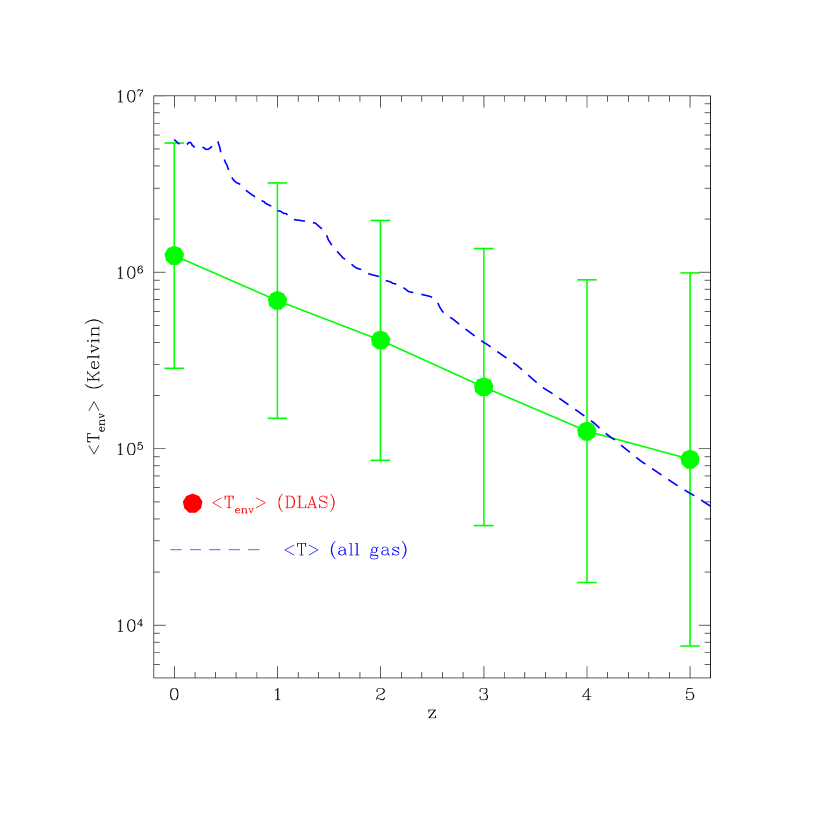
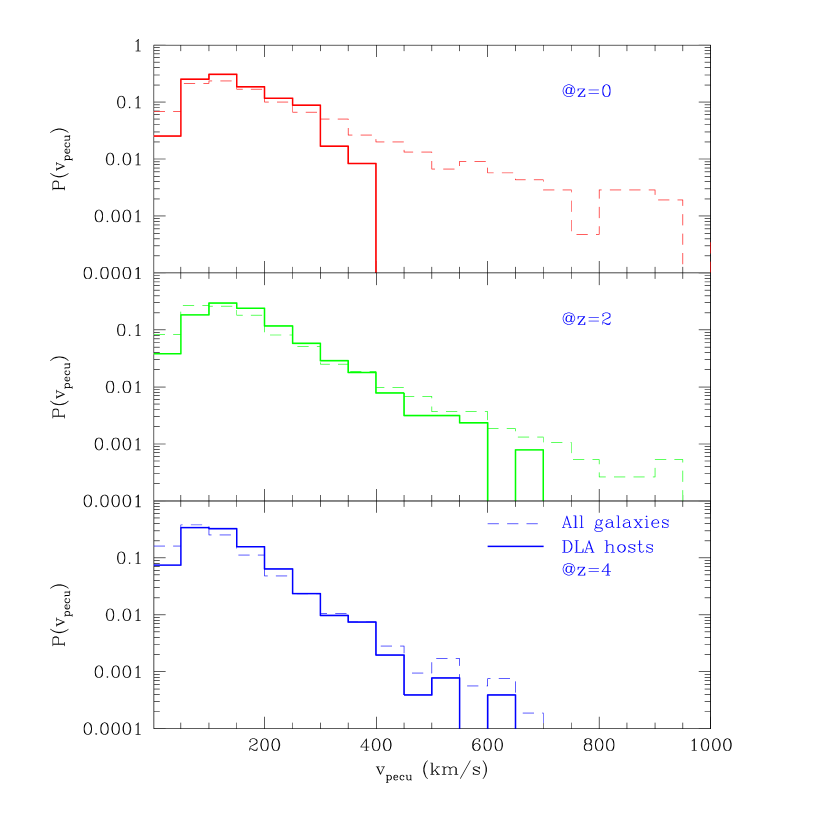
What are the environments surrounding DLAs? Figure 12 shows the average “environmental temperature” in the vicinity of DLAs, defined as the average temperature over 124 cells surrounding the central cell of a DLA, as a function of redshift. Note that the actual (internal) temperature of the DLA gas is low (at K). We see that DLAs tend to reside in a higher temperature environment at lower redshift, close to galaxies at but are in low density regions and filaments at high redshift. Clearly, it is unlikely that DLAs should be found in environments like groups or clusters of galaxies at any redshift, as indicated visually earlier in Figure 2 for . We show in Figure 13 the probability distribution of the local mass overdensity (with a Gaussian smoothing window of radius Mpc) of all galaxies and DLA galaxies at three redshifts. Consistent with Figures (2,12), DLAs at avoid the highest density regions of clusters of galaxies (top panel of Figure 11) as well as very low density regions, while all galaxies extend to both high density regions of clusters of galaxies and very low density regions. At high redshift, DLAs still avoid very low density regions but not the high density regions, because the highest density regions do not correspond to rich clusters of galaxies. Figure 14 shows the proper peculiar velocity distribution of all galaxies and DLA galaxies at . In full agreement with Figure 13, DLA galaxies tend to be found in relatively cold (low velocity) regions of filaments.

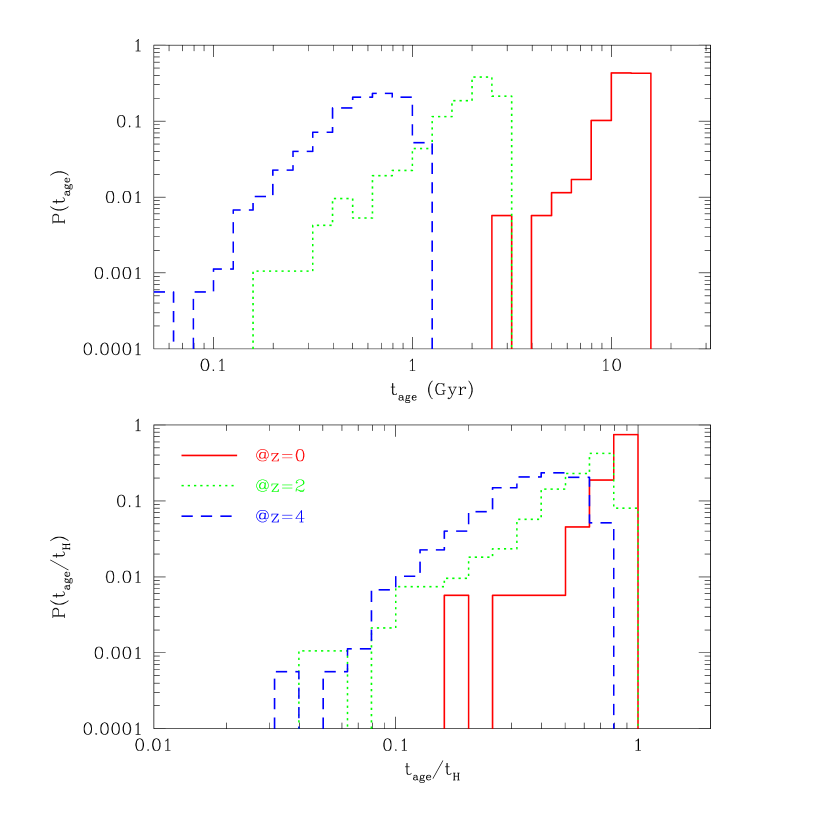
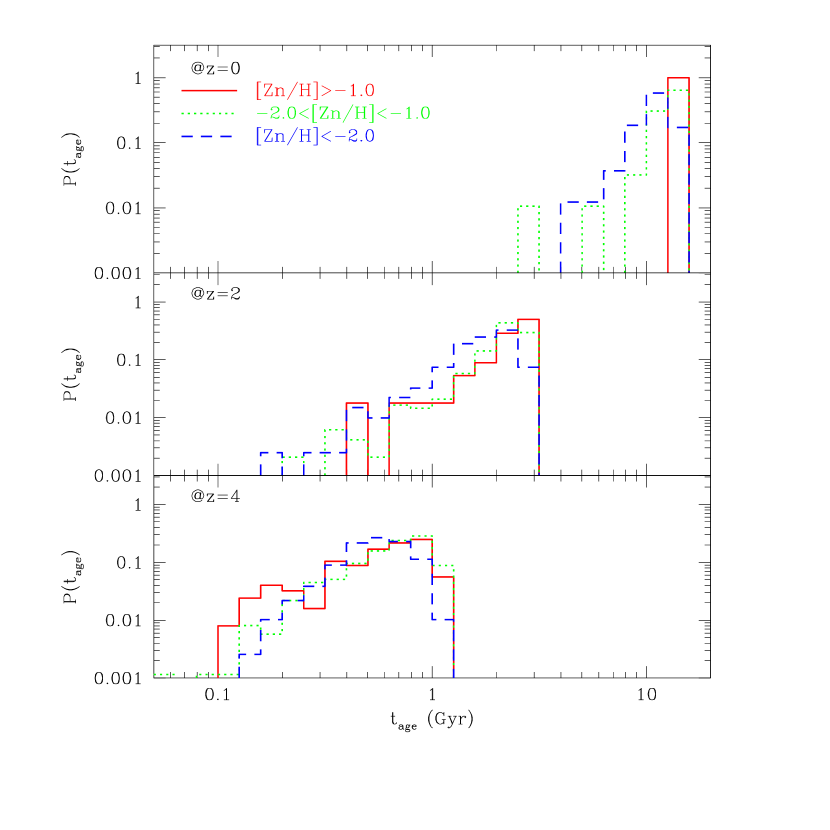
How old are DLA host galaxies? Figure 15 shows the absolute ages of DLAs (top panel) and the relative age (to the age of the Universe) (bottom panel) at three redshifts (z=0,2,4). We see that DLAs at are old with their ages close to the age of the universe and no DLAs are expected to be younger than Gyr. Going to high redshifts DLAs become relatively younger and at the median age of DLAs is about half the age of the universe at that redshift. In addition, the spread in age distribution becomes larger at high redshifts with the full width spanning about one decade at . We then subdivide the DLAs according to their metallicity and compute separately the age distributions of the subsets. Figure 16 shows the age distributions for three subsets at three different redshifts. We see that at a trend is clearly visible: high metallicity DLAs are older than their low high metallicity counterparts and no DLAs with are expected to be younger than Gyr at . However, at high redshift () there does not appear to exist any significant age segregation with respect to DLA metallicity.
The fact that a typical DLA galaxy, nearly independent of its metallicity, would be Gyr old at is interesting in light of recent observations. Pettini et al. (2002) find that, based on a high resolution, high S/N sample of 15 DLAs, the nitrogen abundance in DLAs with to has not saturated by . The indicated age of DLAs at the relevant redshift in our model, if taken to interpret the observational data, would imply a requirement that the release of nitrogen from intermediate mass stars be delayed by Gyr, the typical age of DLAs derived here. If the delay is much shorter than the typical age of DLAs, then the nitrogen abundance in DLAs would have already saturated.
The ages of DLA galaxies appear to be comparable to those of LBGs (see Figure 10a of Shapley et al. 2001). It may suggest that LBGs have higher star formation rate than DLA galaxies, which, of course, is entirely consistent with the lower metallicity of DLAs.
Finally, Figure (17) shows the fractions of metal mass in gaseous phase as a function of redshift, divided into three components: DLAs (with temperature K; solid curve), intracluster gas (K; dashed curve), and the remaining IGM gas (K; dotted curve). We see that at roughly one half of the metals in the gas phase is in DLAs and the other half in the general intergalactic medium, while the fraction of the metals in very hot, rich clusters is small. But by only about 25% of metals are in DLAs, while the fraction in clusters has increased dramatically, reaching , consistent with the fact that most clusters form at in this model. The decline of metal mass fraction in DLAs at low redshift is partly due to metal-enriched gas being collected in the intra-cluster gas and partly due to star formation out of metal rich gas at low redshift (as indicated by the long-dashed curve). Our calculations indicate that roughly of all metals are initially ejected into the IGM through supernovae and then re-formed into and locked up in stars by ; this fraction is lower at at .

We note that most of the metals in DLAs are in the dust “obscured” high metallicity, high column density DLAs, according to our model (see Figures 5,6 and related discussion). Nevertheless, the fraction of total metals in the “unobscured” DLAs (thin solid curve in Figure 13) ranging from at to at , in good agreement with observational estimates (Pettini 1999; Pagel 2001). If we identify the dust “obscured” DLA population with SCUBA galaxies at high redshift, the implication is that SCUBA galaxies may contain of metals residing in galaxies or of all metals at high redshift, which appears to be in agreement with recent observations (Dunne et al. 2002). In addition, since both the computed metallicity () and abundance of X-ray clusters at low redshift are found to be in agreement with observations, the computed fraction of metals in the intracluster gas should be approximately correct.
Before concluding the paper, one word on numerical resolution is appropriate. Since the real DLAs have sizes comparable to our numerical resolution at (30kpc comoving; note that our numerical resolution is better at high redshift scaling as 30kpc/(1+z) kpc proper), it seems inevitable that our limited numerical resolution must have affected the results. In particular, the actual density and hence the column density of the computed DLAs may have been underestimated. The countervailing effect is that lower resolution may artificially enlarge the central dense regions thus produce more DLAs (if the central density is sufficiently high). Therefore, the net effect is not immediately obvious. In any case, to test the resolution effect we artificially lower the column density threshold that we use to identify DLAs from cm-2 to cm-2. We find that this change does not change the results presented in all the figures noticeably, except that in Figure 5 the unweighted metallicity (thin solid curve) of all DLAs is slightly lower by dex at and dex at .
We should still stress that we do have enough resolution to resolve the internal structures of galaxies. All that we are trying to present in the paper are global properties averaged over all galaxies and intergalactic medium on scales comparable to or larger than our resolution, that do not sensitively depend on details on the sub-grid scales. To support our view that our treatment of star formation and metal production rates are reasonable and empirically in agreement with observations over a wide range of observables, we will refer to published papers based on the same simulation (Cen & Ostriker 1999; Nagamine et al. 2000; Nagamine et al. 2001a,b). To summarize, there are at least three lines of evidence that would indicate that the simulation is adequate for tracking global star formation, galaxy formation and metal production. First, we have computed the global star formation rate as a function of redshift (Nagamine etal 2000, 2001a;), i.e., the “Madau plot”, and found reasonable agreement with observations over the redshift range that can be compared, given the uncertainties concerning both observations and simulations. This indicates that the observed star formation history is reasonably well produced by the simulation of this currently best cosmological model. This would remove most of the uncertainties in the simulation concerning the amount of stars formed. Second, the computed luminosity function of galaxies are found to be in reasonable agreement with observations with a flat faint end slope of down to a galaxy mass of ; Nagamine etal 2001b). Once again, this indicates that our simulation has sufficient resolution as to identify galaxies and compute the mass and luminosity of galaxies (but not to resolve internal structures of galaxies). Third, the resulting metallicity of the computed intra-cluster gas ( solar value) is in excellent with observations, implying that our adopted metal yield value (, based on stellar interior theory, see Arnett 2000) agrees with empirically determined observational value. Since the star formation history and galaxy luminosity function are independent of metal yield and most of the metals ending up in the intracluster medium are due to galaxies close to those hosting DLAs, the yield is essentially fixed, on which metallicity of DLAs mainly depend. In addition, our previous, lower resolution simulations (Cen & Ostriker 1999) have yielded results over a wide range of environments (from Lyman alpha forest to clusters of galaxies) that are in reasonable agreement with observations, further supporting the conclusion that our overall metal production rates as well as those regions previously resolved has been correctly computed.
4 Conclusions
We use a latest high mass resolution hydrodynamic simulation of a CDM model to compute the metallicity evolution of damped Lyman alpha systems. Contrary to a naive expectation, but consistent with observations, the computed true mean metallicity of all DLAs shows a very slow evolution with time. Observations appear to pick out damped Lyman alpha systems to be at an intermediate stage in galactic evolution. They tend to live in the filaments, where metal enriched gas from previous generations of small star forming subgalactic units has collected via the hierarchical merger process. As star formation and merging proceeds, they tend to turn into normal massive galaxies ultimately often residing in high density high temperature regions where the gas component is stripped off.
It is important to note that DLAs are not a simple population of galaxies but due to sightlines through a variety of different systems. The mixture of galaxy hosts of DLAs changes with redshift. The median luminosity of a DLA, , in units of typical galaxy luminosity at that redshift, , that is, decreases from to as redshift declines from to , but the absolute luminosity of the median DLA system increases in the same interval by a factor of from to . We predict that DLAs should not be found in hot environments such as groups and clusters of galaxies, but tend to live in regions moderate overdensity with relatively cold flows.
The age of the DLA host galaxies approaches the age of the universe at , while it is approximately half the age of the universe at . At high redshift () there appears to exist no significant age segregation with respect to DLA metallicity.
We find that about 50% all metals in gaseous phase is in DLAs from to , then decreasing rapidly to by , as these metals are swept into hotter X-ray emitting cluster gas and recycled into newly formed stars. It is noted that about 50% of total metals are locked up in stars by ; this number is 20% at .
Observational selection effects (such as dust obscuration) may have significantly masked the true average metallicity of DLAs. Using only those DLAs that are located in the unobscured region of DLAs in the metallicity-column density plane (using a very simple dust obscuration model), we find that, while the trend of metallicity evolution remains little unchanged, the mean (column density-weighted) metallicity is reduced by 0.3 to 0.5 dex from to , bringing the simulation results into good agreement with observations. The “unobscured” DLAs in the simulation also provide good matches to both the observed column density distribution, redshift evolution of the neutral gas content in DLAs and metal content in DLAs. Therefore, in order for the model to agree with observations for a range of variables either the assumed dust obscuration effect occurs in the real universe or the model has to be modified as to remove the high column density, high metallicity DLAs. The possibilities for the latter will be explored in the future. It should be emphasized, however, that current observations do not seem to require significant amount of dust in DLAs (Ellison et al. 2001; Prochaska & Wolfe 2002). We point out, however, that only DLAs are expected to be dust obscured (in optical) in the CORALS radio survey of Ellison et al. (2001) of total DLAs. Clearly, a sample several times larger is required to greatly firm up the statistical significance of their important findings and determines the importance of dust obscuration unambiguously. While our simulations strongly suggest the significance of dust obscuration with regard to DLA evolution, we will be forced to make a substantial revision of the computed model, if significant dust obscuration is firmly excluded observationally in the future. We stress, however, that some of the major conclusions of the present paper, including the mild metallicity evolution of DLAs, the large disparity of DLA host galaxies and the monotonic evolution of the increasing mass of DLA systems with time, are much less prone to these uncertainties and not expected to alter significantly.
Finally, we pointed out that that the adopted model predicts (approximately a factor of ) too many damped Lyman alpha systems, indicating either imperfections of the simulation, or the possibility that this CDM model has too much small scale power.
References
- Arnaud et al. (1994) Arnaud, K.A., Mushotzky, R.F., Ezawa, H., Fukazawa, Y., Ohashi, T.,Bautz, M.W., Crewe, G.B., Gendreau, K.C., Yamashita, K., Kamata, Y., & Akimoto, F. 1994, ApJ, 436, L67 (A94)
- Arnett (1996) Arnett, D. 1996, “Supernovae and Nucleosynthesis”
- Balbi et al. (2000) Balbi, A., et al. 2000, ApJ, 545, L1
- Bahcall & Peebles (1969) Bahcall, J.N., & Peebles, P.J.E. 1969, ApJ, 156, L7
- Barlow & Tytler (1998) Barlow, T.A., & Tytler, D. 1998, AJ, 115, 1725 (BT98)
- Bertschinger (2001) Bertschinger, E. 2001, astro-ph/0103301
- Blanton et al. (1999) Blanton, M., Cen, R., Ostriker, J.P., & Strauss, M.A. 1999, ApJ, 522, 590
- Boissé et al. (1998) Boissé, P., Le Brun, V., Bergeron, J., & Deharveng, J. 1998, A&, 333, 841
- Bruzual (2000) Bruzual, A. G. 2000, astro-ph/0011094
- Bunker et al. (1999) Bunker, A.J., Warren, S.J., Clements, D.L., Williger, G.M., & Hewitt, P.C. 1999, MNRAS, 309, 875
- Bunn & White (1997) Bunn, E.F., & White, M. 1997, ApJ, 480, 6
- Burles & Tytler (1998) Burles, S., & Tytler, D. 1998, ApJ, 499, 699
- Cen (1998) Cen, R. 1998, ApJ, 509, 16
- Abell (1958) Cen, R., Kang, H., Ostriker, J.P., & Ryu, D. 1995, ApJ, 451, 436
- Cen & Ostriker (1992) Cen, R., & Ostriker, J.P. 1992, ApJ, 399, L113
- Cen & Ostriker (1993) Cen, R., & Ostriker, J.P. 1993, ApJ, 417, 415
- (17) Cen, R., & Ostriker, J.P. 1999, ApJ, 514, 1
- (18) Cen, R., & Ostriker, J.P. 1999, ApJ, 519, L109
- Cohen (2000) Cohen, J.G. 2000, preprint, astro-ph/0012109
- Colbert & Malkan (2001) Colbert, J.W., & Malkan, M.A. 2001, astro-ph/0112416
- Davé et al. (1998) Davé, R., Hellsten, U., Hernquist, L., Weinberg, D.H., & Katz, N. 1998, ApJ, 487, 482
- de Bernardis et al. (2000) de Bernardis, P. et al. 2000, Nature, 404, 955
- Eggen, Lynden-Bell & Sandage (1962) Eggen, O.J., Lynden-Bell, D., & Sandage, A.R. 1962, ApJ, 136, 748
- Edelson & Malkan (1986) Edelson, R.A., & Malkan, M.A. 1986, ApJ, 308, 59
- Edmunds & Phillips (1997) Edmunds, M.G. & Phillips, S. 1997, MNRAS, 292, 733
- Ellison et al. (2002) Ellison, S.L., Yan, L., Hook, I.M., Pettini, M., Wall, J.V., & Shaver, P. 2001, A&A, 379, 393
- Fall & Pei (1993) Fall, S.M., & Pei, Y.C. 1993, ApJ, 402, 479
- Gnedin & Ostriker (1997) Gnedin, N.Y., & Ostriker, J.P. 1997, 486, 581
- Hamann (1997) Hamann, F. 1997, ApJS, 109, 279
- Haynes et al. (1990) Haynes, M.P., Herter, T., Barton, A.S., & Benensohn, J.S. 1990, AJ, 99, 1740
- Haynes & Giovanelli (1991) Haynes, M.P., & Giovanelli, R. 1991, ApJS, 77, 331
- Katz, Hernquist, & Weinberg (1992) Katz, N., Hernquist, L., & Weinberg, D.H 1992, ApJ, 399, L109
- Katz, Hernquist, & Weinberg (1996) Katz, N., Hernquist, L., & Weinberg, D.H 1996, ApJS, 105, 19
- (34) Kulkarni, V.P., et al. 2000, ApJ, 536, 36
- Kulkarni & Fall (2002) Kulkarni, V.P. & Fall, M. 2002, ApJ, submitted
- Lahav et al. (2001) Lahav, O., et al. 2001, astro-ph/0112162
- Lanzetta et al. (1997) Lanzetta, K.M., et al. 1997, AJ, 114, 1337
- Le Brun et al. (1997) Le Brun, V., Bergeron, J., Boissé, P., & Christian, C. 1993, A&, 279, 33
- Malaney & Chaboyer (1996) Malaney, R.A. & Chaboyer, B. 1996, ApJ, 462, 57
- Mathlin et al. (2001) Mathlin, G.P., Baker, A.C., Churches, D.K., & Edmunds, M.G. 2001, MNRAS, 321, 743
- Miller, Knezek, & Bregman (1999) Miller, E.D., Knezek, P.M., & Bregman, J.N. 1999, ApJ, 510, L95
- Mushotzky et al. (1996) Mushotzky, R.F., Lowenstein, M., Arnaud, A.K., Tamura, T., Fukazawa, Y., Matsushita, K., Kikuchi, K., & Hatsukade, I. 1996, ApJ, 466, 686 (M96)
- Mushotzky & Lowenstein (1997) Mushotzky, R.F., & Lowenstein, M. 1997, ApJ, 481, L63 (ML97)
- Nagamine, Cen, & Ostriker (1999) Nagamine, K., Cen, R., & Ostriker, J.P. 2000, ApJ, 541, 25
- Nagamine et al. (2000) Nagamine, K., Cen, R., & Ostriker, J.P. 2000, ApJ, 541, 25
- Nagamine et al. (2001) Nagamine, K., Fukugita, M., Cen, R., & Ostriker, J.P. 2001a, ApJ, 558, 497
- Nagamine et al. (2001) Nagamine, K., Fukugita, M., Cen, R., & Ostriker, J.P. 2001b, MNRAS, 324, L10
- Ostriker & Heisler (1984) Ostriker, J.P., & Heisler, J. 1984, ApJ, 278, 1
- Ostriker & Steinhardt (1995) Ostriker, J.P., & Steinhardt, P. 1995, Nature, 377, 600
- Ostriker & Thuan (1975) Ostriker, J.P., & Thuan, T.X. 1975, ApJ, 202, 353
- Pagel (2001) Pagel, B.E.J. 2001, astro-ph/0107215
- Pei & Fall (1995) Pei, Y.C. & Fall, S.M. 1995, ApJ, 454, 69
- Pei et al. (1999) Pei, Y.C., Fall, S.M., & Hauser, M.G. 1999, ApJ, 522, 604
- Peroux et al. (2002) Peroux, C., Irwin, M.J., McMahon, R., Storrie-Lombardi, L. 2002, MNRAS, in press
- Pettini et al. (1994) Pettini, M., Smith, L. J., Hunstead, R. W., and King, D. L. 1994, ApJ, 426, 79
- Pettini (1999) Pettini, M. 1999, in Lecture Notes in Physics, Proceedings of ESO Workshop, ed. J. Walsh and M. Rosa (Berling: Springer), in press, astro-ph/9902173
- Pettini et al. (2000) Pettini, M., Ellison, S.L., Steidel, C.C., Shapely, A.L., & Bowden, D.V. 2000, ApJ, 532, 65
- Pettini et al. (1997) Pettini, M., Smith, L.J., King, D.L., Hunstead, R.W. 1997, ApJ, 486, 665
- Pettini et al. (1999) Pettini, M., Ellison, S.L., Steidel, C.C., & Bowen, D.V. 1999, ApJ, 510, 576
- Pettini et al. (1999) Pettini, M., Ellison, S.L., Bergeron, J., & Petitjean, P. 2002, A& A, 391, 21
- Peroux et al. (2001) Peroux, C., McMahon, R.G., Storrie-Lombardi, & Irwin, M.J. 2001, astro-ph/0107045
- Prantzos & Boissier (2000) Prantzos, N., & Boissier, S. 2000, MNRAS, 315, 82
- (63) Prochaska, J.X., & Wolfe, A.M. 2000, ApJ, 533, L5
- Prochaska, Gawiser, & Wolfe (2001) Prochaska, J.X., Gawiser, E., & Wolfe, A.M. 2001, ApJ, 552, 99
- Prochaska et al. (2001) Prochaska, J.X., Wolfe, A.M., Tytler, D., Burles, S.M., Cooke, J., Gawiser, E., Kirkman, D., O’Meara, J.M., & Storrie-Lombardi, L. 2001, ApJS, 137, 21
- Prochaska & Wolfe (2000) Prochaska, J.X. & Wolfe, A.M., 2000, ApJ, 533, L5
- Prochaska & Wolfe (2001) Prochaska, J.X. & Wolfe, A.M., 2001, ApJ, 560, L33
- Prochaska & Wolfe (2002) Prochaska, J.X. & Wolfe, A.M., 2002, ApJ, 566, 68
- Rao & Briggs (1993) Rao, S.M., & Briggs, F. 1993, ApJ, 419, 515
- Rao & Turnshek (2000) Rao, S.M., & Turnshek, D.A. 2000, ApJS, 130, 1
- Rauch, Haehnelt, & Steinmetz (1997) Rauch, M., Haehnelt, M.G., & Steinmetz, M. 1997,ApJ, 481, 601 (R97)
- Reiss et al. (1998) Reiss, A.G., et al. 1998, AJ, 116, 1009
- Ryu et al. (1993) Ryu, D., Ostriker, J.P., Kang, H., &, Cen, R. 1993, ApJ, 414, 1
- Savage, Tripp, & Lu (1998) Savage, B.D., Tripp, T.M., & Lu, L. 1998, AJ, 115, 436
- Scalo (1986) Scalo, J.M. 1986, Fund. Comis Phys., 11, 1
- Shapley et al. (2001) Shapley, A.E., Steidel, C.C., Adelberger, K.L., Dickinson, M., Giavalisco, M., & Pettini, M. 2001, ApJ, 562, 95
- Shull et al. (1998) Shull, J.M., et al. 1998, preprint, astro-ph/9807246 (S98)
- Somerville, Primack, & Faber (2001) Somerville, R. S., Primack, J. R., & Faber, S.M. 2001, MNRAS, 320, 504
- Songaila & Cowie (1996) Songaila, A., & Cowie, L.L. 1996, AJ, 112, 335 (SC96)
- Steidel (1993) Steidel, C.C. 1993, in “The Environment and Evolution of Galaxies”, ed. J.M. Shull and H.A. Thronson, Jr., p263
- Steidel et al. (1997) Steidel, C.C., Bowen, D.V., & Blades, J.C., & Dickinson, M. 1995, ApJ, 440, L45
- Steidel, Dickinson, & Persson (1994) Steidel, C.C., Dickinson, M., & Persson, S.E. 1994, ApJ, 437, L75
- Steinmetz (1996) Steinmetz, M. 1996, MNRAS, 278, 1005
- Storrie-Lombardi and Wolfe (2000) Storrie-Lombardi, L.J. & Wolfe, A.M. 2000, ApJ, 543, 552
- Tamura et al. (1996) Tamura, T., Day, C.S., Fukazawa, Y., Hatsukade, I., Ikebe, Y., Makishima, K., Mushotzky, R.F., Ohashi, T., Takenaka, K., & Yamashita, K. 1996, PASP, 48, 671 (T96)
- Tissera et al. (2001) Tissera, P.B., Lambas, D.G., Mosconi, M.B., & Cora, S. 2001, ApJ, 557, 527
- Tripp et al. (1997) Tripp, T. M., Lu, L., & Savage, B. D. 1997, AJ, 112, 1
- Tytler et al. (1995) Tytler, D., Fan, X.-M., Burles, S., Cottrell, L., Davis, C., Kirkman, D., & Zuo, L. 1995, in QSO Absorption Lines, ed. G. Meylan (Berlin: Springer), 289
- Tytler & Fan (1994) Tytler, D., & Fan, X.-M. 1994, ApJ, 424, L87 (TF94)
- Zwaan, Briggs, & Sprayberry (2001) Zwaan, M.A., Briggs, F.H., & Sprayberry, D. 2001, MNRAS, 327, 1249