PG1115+166 – a long period DA+DB binary.
Abstract
We present spectra of the DAB white dwarf PG 1115+166. Radial velocity measurements of the Balmer lines and the HeI 6678Å line show that this is a binary white dwarf with a period of 30.09d in which the Balmer lines move in anti-phase to the HeI line, i.e., PG 1115+166 is a DA+DB binary. The minimum masses of the stars are and . The separation of the stars is about 45, which is much smaller than a typical AGB progenitor of a white dwarf, implying that there has been at least one common envelope phase in this binary. Indeed, it is possible that this binary may have suffered up to three mass transfer episodes – two associated with the red giant phase prior to the formation of each white dwarf and a third associated with the “born-again” red giant phase of the DB white dwarf. PG 1115+166 has the longest orbital period of any post common envelope white dwarf – white dwarf binary found to date. Published models for the formation of white dwarf – white dwarf binaries do not predict any white dwarfs with the combination of long orbital period and high mass found in PG 1115+166. We conclude that PG 1115+166 is a key object for testing models of binary star evolution and it may also be a key object for our understanding of the formation of DB white dwarfs. We outline the observational tests which can be applied to scenarios for the formation of PG 1115+166 and apply them to the simplest case of a single common envelope phase. This suggests that some part of the internal energy stored in the envelope of the AGB star, e.g., as ionized hydrogen, may have contributed to the ejection of the common envelope, but there are several unanswered questions concerning this simple scenario.
keywords:
white dwarfs – binaries: close – stars: individual: PG 1115+166 – binaries: spectroscopic1 Introduction
The chemical composition of the atmosphere of a white dwarf star reflects a balance between gravitational settling, which tends to produce a pure hydrogen atmosphere, and processes which “pollute” the atmosphere such as radiative levitation, convection and accretion (Fontaine & Wesemael 1987). This balance will change during the lifetime of a white dwarf as it cools and this is seen as a change in the relative numbers of hydrogen-rich (DA) and helium rich (non-DA) white dwarfs as a function of effective temperature. In white dwarfs with effective temperatures 12 – 60 000K, gravitational settling dominates so about 80 percent of these white dwarfs have pure or nearly-pure hydrogen atmospheres. White dwarf stars with helium-rich atmospheres may appear as DO stars with He II lines (45 000K) or DB stars with He I lines (30 000K 12 000K). The absence of non-DA white dwarfs with effective temperatures between 30 000K and 45 000K is known as the DB gap. The favoured explanation for the DB gap is that as the DO white dwarf cools to 45 000K, small amounts of hydrogen hidden in the atmosphere rise to the surface, eventually masking the underlying helium. A hydrogen layer mass of just is enough to make the white dwarf look like a DA. Later, at K, the convection zone in the underlying helium layer reaches the photosphere, mixing the hydrogen and helium so the white dwarf re-appears as a helium-rich, DB white dwarf. Those white dwarfs with thicker hydrogen layers remain as DA stars in this temperature range. In this scenario, percent of DA white dwarfs within the DB gap have thin hydrogen layers which are sufficient to mask the underlying helium.
The reason why percent of white dwarfs are born with very thin hydrogen envelopes is thought to be related to the born-again red giant phenomenon in which some stars form hot white dwarfs with thick hydrogen envelopes which undergo a late thermal pulse. This is caused by re-ignition of the helium shell which results in the stars rapidly expanding to red giant dimensions, e.g., Sakurai’s Object (Duerbeck 2000). The remaining hydrogen is quickly mixed into the helium layers and is burnt (Iben et al. 1983).
Those few white dwarfs which show a mixture of hydrogen and helium in their atmosphere are particularly interesting in the light of this debate. About 20 percent of DB stars show traces of hydrogen in their atmospheres and are classified as DBA (Shipman, Liebert & Green 1987). Much rarer are stars which show both strong hydrogen lines and strong helium lines. These are classified as DAB stars and only six of them have been identified. The prototype, GD 323, appears at the cool edge of the DB gap (= 28 750K) and appears to have a very thin hydrogen layer (10-17) although no model can yet explain all the features of this peculiar object satisfactorily (Koester, Liebert & Saffer 1994). MCT 01283846 and MCT 04532933 appear to be binaries with a DA and a DB or DBA component (Wesemael et al., 1994). Holberg, Kidder & Wesemael (1990) detected a weak HeI 4471Å feature in G10427 (WD 0612+177) but this was not confirmed by subsequent observations (Kidder et al. 1992). HS 0209+0832 is a DAB star in the middle of the DB gap which shows strong HeI lines whose strength varies from year-to-year (Heber et al. 1997) which may be explained by accretion onto the white dwarf from an inhomogeneous interstellar cloud (Wolff et al. 2000). Finally, PG 1115+166 was first reported as a DAB star by Burleigh et al. (2001). They note that the H line shows a variable radial velocity but were unable to determine the orbital period. Bergeron & Liebert (2002) have analysed the optical spectrum of PG 1115+166 and found an excellent fit to the spectrum by assuming it is an unresolved DA+DB double degenerate binary. Their fit to the observed spectrum used a DA star with TK, combined with a helium-line DB star with TK, . They estimate that both stars have masses of about 0.7.
Those DAB stars which are binaries may be particularly interesting as they may be examples of stars which have undergone two mass transfer episodes, e.g., a common envelope phase (Iben & Livio 1993). The number of such close white dwarf pairs has increased rapidly in recent years. The majority of these binaries were identified as low mass white dwarfs () from analysis of their Balmer lines. White dwarfs of such low mass are not formed in the standard picture of single star evolution within the lifetime of our Galaxy. It now appears that the majority of these binaries are the result of a common envelope phase in a star on the first giant branch (Marsh, Dhillon & Duck 1995). The properties of the binaries identified to-date, e.g., their orbital periods, masses and mass ratios, are strong tests of models for the formation of close binary white dwarfs and models for interacting binary stars in general (Nelemans et al. 2000, Nelemans et al. 2001). Identifying DAB stars may be a promising way to find more massive close binary white dwarf stars and so extend the range of masses over which observations can be used to test models of interacting binary stars.
In this paper we report radial velocity measurements of the Balmer lines and HeI lines of PG 1115+166. The Balmer lines show that this star is a binary with a period of 30.09d and the helium lines move in anti-phase to the hydrogen lines, so this is star is a DA+DB binary white dwarf. We also consider the formation of PG 1115+166.
| No.of | Sampling | Resolution | Spectral lines | |||
|---|---|---|---|---|---|---|
| Telescope | Date | Spectrograph | spectra | (Å) | (Å) | observed |
| INT | 1996 Feb | IDS 235mm | 2 | 1.59 | 3.2 | H – H9 |
| WHT | 1997 Nov | ISIS Blue | 2 | 0.22 | 0.7 | H, H |
| WHT | 1997 Nov | ISIS Red | 2 | 0.40 | 0.8 | H, He I6678 |
| INT | 1999 Feb | IDS 500mm | 3 | 0.39 | 0.9 | H, HeI6678 |
| WHT | 1999 Apr | ISIS Blue | 1 | 0.22 | 0.9 | H – H |
| WHT | 1999 Apr | ISIS Red | 2 | 0.79 | 1.6 | HeI 6678, HeI 7065 |
| WHT | 1999 Dec | ISIS Blue | 1 | 0.44 | 1.0 | H – H9 |
| INT | 2000 Apr | IDS 500mm | 6 | 0.39 | 0.9 | H, HeI 6678 |
| WHT | 2001 Jan | ISIS Blue | 6 | 0.21 | 0.4 | H |
| WHT | 2001 Jan | ISIS Red | 6 | 0.40 | 0.8 | H, HeI 6678 |
| INT | 2001 Feb | IDS 500mm | 1 | 0.39 | 0.9 | H, HeI 6678 |
| WHT | 2001 Mar | ISIS Blue | 3 | 0.45 | 1.2 | H – H |
| WHT | 2001 Mar | ISIS Red | 3 | 0.40 | 0.8 | H, HeI 6678 |
| WHT | 2001 Apr | ISIS Red | 1 | 0.40 | 0.8 | H, HeI 6678 |
| WHT | 2002 Jan | ISIS Blue | 4 | 0.22 | 0.7 | H, H |
| WHT | 2002 Jan | ISIS Red | 4 | 0.40 | 0.8 | H, HeI 6678 |
| HJD | Radial Velocity | Line | Radial Velocity | |
|---|---|---|---|---|
| -2450000 | (km s-1) | (km s-1) | Line | |
| 114.6490 | 118107 | H | 52 69 | 4026 |
| 114.6490 | 90 38 | H | 40 72 | 4471 |
| 114.6490 | 86 50 | H | ||
| 114.6621 | 79 46 | H | 71 61 | 4026 |
| 114.6621 | 44 96 | H | 65 | 4471 |
| 114.6621 | 33 32 | H | ||
| 778.7425 | 48 7 | H | 62 22 | 6678 |
| 778.7425 | ||||
| 778.7474 | 44 10 | H | 18 30 | 4471 |
| 778.7474 | 52 18 | H | ||
| 778.7521 | 57 7 | H | 6 21 | 6678 |
| 778.7521 | ||||
| 778.7570 | 59 10 | H | 6 28 | 4471 |
| 778.7570 | 73 16 | H | ||
| 1242.4790 | 1 8 | H | ||
| 1242.4790 | 33 26 | 6678 | ||
| 1242.6647 | 16 10 | H | ||
| 1242.6647 | 61 31 | 6678 | ||
| 1243.5684 | 81 30 | 6678 | ||
| 1243.5684 | 12 10 | H | ||
| 1264.4391 | 45 11 | 7065 | ||
| 1264.4391 | 80 16 | 6678 | ||
| 1265.4375 | 19 12 | H | 37 20 | 4471 |
| 1265.4375 | 29 7 | H | 59 9 | 7065 |
| 1265.4375 | 61 13 | 6678 | ||
| 1534.7763 | 42 13 | H | 20 12 | 4026 |
| 1534.7763 | 25 6 | H | 42 18 | 4471 |
| 1534.7763 | 24 11 | H | ||
| 1646.5221 | 94 7 | H | 3 23 | 6678 |
| 1647.3903 | 23 43 | 6678 | ||
| 1647.5046 | 52 14 | H | 5 44 | 6678 |
| 1654.5432 | 50 8 | H | 66 23 | 6678 |
| 1656.4903 | 23 8 | H | 99 24 | 6678 |
| 1657.5243 | 15 8 | H | 16 25 | 6678 |
| 1924.7813 | 34 6 | H | 48 20 | 6678 |
| 1924.7814 | 15 12 | H | ||
| 1924.7884 | 34 6 | H | 36 20 | 6678 |
| 1924.7885 | 39 12 | H | ||
| 1924.7954 | 23 7 | H | 27 22 | 6678 |
| 1924.7956 | 42 13 | H | ||
| 1924.8024 | 30 7 | H | 22 25 | 6678 |
| 1924.8027 | 29 13 | H | ||
| 1925.7458 | 29 4 | H | 43 14 | 6678 |
| 1925.7459 | 40 8 | H | ||
| 1925.7598 | 33 5 | H | 29 15 | 6678 |
| 1925.7599 | 8 9 | H | ||
| 1946.6078 | 61 17 | H | ||
| 1976.6739 | 71 14 | H | ||
| 1976.6740 | 32 47 | 4471 | ||
| 1976.6740 | 38 | H | ||
| 1976.6740 | 3 35 | 4026 | ||
| 1976.6740 | 56 28 | H | ||
| 1976.6879 | 74 10 | H | ||
| 1976.6880 | 18 27 | 4026 | ||
| 1976.6880 | 32 38 | 4471 | ||
| Continued … | ||||
| HJD | Radial velocity | Line | Radial Velocity | |
|---|---|---|---|---|
| -2450000 | (km s-1) | (km s-1) | Line | |
| 1976.6880 | 81 31 | H | ||
| 1976.6880 | 76 21 | H | ||
| 1976.7090 | 25 20 | H | 36 | 4471 |
| 1976.7090 | 113 35 | H | 5 26 | 4026 |
| 1976.7090 | 71 8 | H | ||
| 2278.7485 | 77 6 | H | 11 19 | 6678 |
| 2278.7627 | 76 6 | H | 22 | 6678 |
| 2278.7797 | 73 6 | H | 22 | 6678 |
| 2278.7938 | 71 6 | H | 22 | 6678 |
| 2278.7485 | 61 11 | H | 19 | 4471 |
| 2278.7627 | 51 17 | H | 28 | 4471 |
| 2278.7797 | 72 18 | H | 31 | 4471 |
| 2278.7939 | 67 19 | H | ||
| 2278.7627 | 57 32 | H | ||
| 2278.7939 | 36 37 | H |
2 Observations and Reductions
PG 1115+166 was first identified as a DAB star in February 1996 as part of a survey to find low mass white dwarfs (Moran 1999). It was re-observed several times thereafter as part of the programme at Southampton to find and characterize close binary white dwarfs. The Leicester group observed PG 1115+166 independently in April 1999 as a part of a programme to find white dwarfs with helium-rich atmospheres in the DB gap by observing hot white dwarfs undetected by EUV surveys and also identified it as a DAB star (Burleigh et al. 2001)
Observations of PG 1115+166 have been obtained with the intermediate dispersion spectrograph (IDS) on the 2.5m Isaac Newton Telescope (INT) and the dual-beam ISIS spectrograph on the 4.2m William Herschel Telescope (WHT) both on the Island of La Palma. A variety of gratings have been used to cover a variety of wavelengths at different times, as detailed in Table 1. The exposure times used were typically 10–30 minutes. Spectra of an arc lamp are taken before and after each target spectrum with the telescope tracking the star. None of the CCDs used showed any structure in unexposed images, so a constant bias level determined from a clipped-mean value in the over-scan region was subtracted from all the images. Sensitivity variations were removed using observations of a tungsten calibration lamp.
Extraction of the spectra from the images was performed automatically using optimal extraction to maximize the signal-to-noise of the resulting spectra (Marsh 1989). The arcs associated with each stellar spectrum were extracted using the profile determined for the stellar image to avoid possible systematic errors due to tilted arc lines. The wavelength scale was determined from a polynomial fit to measured arc line positions and the wavelength of the target spectra interpolated from the calibration established from the bracketing arc spectra. Uncertainties on every data point calculated from photon statistics are rigorously propagated through every stage of the data reduction. The normalized spectrum of PG 1115+166 is shown in Fig. 1 in two sections. The spectra used to produce this figure were the 1999 Dec WHT spectrum, the 1999 Apr WHT spectrum and the sum of the three WHT spectra from 2002 Jan. No attempt has been made to remove the telluric features near 6900Å and 7300Å.

3 Analysis
3.1 Radial velocities.
To measure the radial velocities we used least-squares fitting of a model line profile. This model line profile is the summation of one or more Gaussian profiles with different widths and depths but with a common central position which varies between spectra and is convolved with a Gaussian profile of an appropriate width to model the resolution of each spectrum.
One must be careful to allow for the asymmetry of the line due to pressure shifts, particularly when dealing with the wings of the higher order Balmer lines (Grabowski, Halenka & Madej 1987) or the HeI lines (Beauchamp, Wesemael & Bergeron 1997). To account for these asymmetries in the Balmer lines, we add a 3rd or 4th order polynomial in the model line profile. We also exclude data from the fitting process which is more than 1000 km s-1 from the rest wavelength of the lines measured. This reduces both the effect of the pressure shift and the possibility of blending with other lines. The radial velocity measurement is determined primarily by the centre of the line and the fitting process is identical for all lines, so any remaining pressure shifts would only be seen as an offset of a few km s-1 between the radial velocities measured for different Balmer lines. This is small compared to the typical uncertainties in the measured radial velocities.
The pressure shifts in the much weaker HeI lines are harder to deal with, so we simply report the radial velocities measured using a single Gaussian profile and a low-order polynomial for these lines and include a warning here that there are systematic shifts between the velocities measured for different HeI lines.
We first normalize the spectra using a polynomial fit to the continuum either side of the line of interest. We use a least-squares fit to one of the spectra to determine the model line profile. A least squares fit of this profile to each spectrum in which the position of the line and the polynomial coefficients are the only free parameters gives the measured radial velocities in Table 2. We tried three different initial values for the radial velocity in the least-squares minimization to ensure we found the optimum value of the radial velocity and excluded the results for any spectra where the optimum value could not be clearly identified.
The uncertainties on each radial velocity measurement are calculated by propagating the uncertainties on every data point in the spectra right through the data reduction and analysis. There are inevitably systematic errors in our radial velocity measurements, particularly since we are using spectra obtained with a variety of instruments. Maxted et al. (2000) found that these systematic differences are no more than km s-1 for the majority of the spectrographs used in this study. To allow for this, we include an additional uncertainty per radial velocity measurement equivalent to 1/40 of the resolution, typically about 1km s-1. This has been added in quadrature to the uncertainties given in Table 2. The radial velocity measurements of the Balmer lines are clearly variable. Of the HeI line measurements, only the measurements of the HeI 6678 lines are sufficiently numerous and accurate to show any sign of variability. There are too few accurate radial velocity measurements of the other HeI lines for this variability to be apparent. To quantify this we calculated their weighted mean radial velocity, which is the best estimate of the radial velocity assuming this quantity is constant. We then calculated the statistic for this “model”, i.e., the goodness-of-fit of a constant to the observed radial velocities. We can then compare the observed value of with the distribution of for the appropriate number of degrees of freedom and find the probability of obtaining the observed value of or higher from random fluctuations of constant value, . This suggests that the HeI 6678 lines are likely to be variable, but the evidence from this test is not conclusive.
3.2 The orbital period
We used the 57 radial velocities measured from the Balmer lines to establish the orbital period. We used least-squares to fit sine waves at 500 000 trial frequencies uniformly distributed over the range 0 to 10 cycles per day and recorded the value of chi-squared for each trial frequency. Low values of chi-squared occur for orbital periods d with the lowest value of chi-squared being 68.3 for d. The next most likely orbital period is near the one cycle-per-day alias of this period, d, which has a chi-squared value of 87.3.
In order to test the robustness of our period determination, we randomly selected 50 of the radial velocity measurements and fitted sine waves at 100 000 trial frequencies uniformly distributed over the range 0 to 1.2 cycles per day and recorded the value of the period at which the minimum value of chi-squared occurs. We repeated this process 1000 times and found that in 973 trials this reduced dataset produced a minimum value of chi-squared at an orbital period near 30.09d. Most of the other trials favoured orbital periods near 1 day which, as we have seen, gives a poor fit to the complete data set.
As an alternative test, we used a Monte Carlo simulation to estimate how often a binary with an orbital period of 1.0316d will appear to have an orbital period near 30.09d given radial velocity meausurements with the same temporal sampling and accuracy as those presented here. We used a least-sqaures fit to our data to find the optimum period near 1.0316d and the corresponding semi-amplitude of a sine wave fit by least squares. We generated 1000 synthetic data sets with the same period and semi-amplitude as this fit and with the same temporal sampling as our data. We added noise to the synthetic data using a psuedo-random normal deviates multiplied by the uncertainties associated with each datum. For each of these synthetic data sets we fitted sine waves at 100 000 trial frequencies uniformly distributed over the range 0.01 to 1.2 cycles per day and recorded the value of the period at which the minimum value of chi-squared occurs. We also recorded the best values of chi-squared which occur within 10 percent of d and d. Of the 1000 trials, 983 trials resulted in a minimum value of chi-squared near 1.0316d and only 17 gave a minimum value of chi-squared at a period near 30.09d. Furthermore, in all the trials for which d gave a lower value of chi-squared, the difference in the minimum chi-squared value for d and d was usually only 1–3 and was always less than 8. In summary, this test suggests that there is a less than 1/1000 chance of a binary with d being incorrectly identified as a binary with d from our data provided the least-squares fits of sine waves at the two periods result in a difference in chi-squared of 8 or more. The difference in chi-squared for our actual data is 19, so this condition is easily satisfied in this case.
These simple test both suggests that period determination is robust and that we can be confident that the orbital period is d.
3.3 Spectroscopic orbit
If PG 1115+166 is genuinely a binary DA+DB white dwarf we expect that the HeI lines should move in anti-phase to the Balmer lines. We investigated this scenario using a least-squares fit of a sine wave of the form to the measured radial velocities, , for all the Balmer lines and a sine wave of the form to the 23 measured radial velocities for the HeI 6678 line. We used both data sets in a simultaneous fit to all these data, an approach which has the merit of using all the available data to determine the parameters and . The results are given in Table 4 and are shown in Fig. 2. We have excluded data for the Balmer lines with uncertainties larger than 20 km/s and data for the HeI 6678 line with uncertainties larger than 40 km/s from Fig. 2 for clarity. The value of derived is about 4 times greater than its uncertainty, so we can be fairly sure that the HeI 6678 line moves in anti-phase to the Balmer lines as expected for a DA+DB binary. We can certainly rule out the possibility that PG 1115+166 is a single DAB star since that would require the HeI lines and the Balmer lines to move in phase, which is clearly not the case. Also given in Table 4 are the results of a similar least-squares fit including the data for all the HeI lines. This reduces the uncertainty in the value of , but we prefer the results of fitting only the HeI 6678 line until the systematic errors introduced by pressure shifts in HeI lines is better understood. In any case, the results of the two least-squares fits are nearly identical.
| HeI 6678 only | All HeI lines | |
| () | 35.8 2.3 | 35.7 2.3 |
|---|---|---|
| KH () | 36.6 2.4 | 36.6 2.4 |
| () | 40.6 4.7 | 37.2 3.6 |
| KHeI () | 7.4 | 30.7 5.4 |
| T0(HJD) | 2451909.77 0.41 | 2451909.76 0.40 |
| P (days) | 30.089 0.016 | 30.088 0.016 |
| N | 80 | 100 |
| 88.14 | 100.53 |

The mass ratio implied by the parameters in Table 4 is . This is consistent with the conclusion of Bergeron & Liebert (2002) that the masses of the two stars are similar. We also find , and , where is inclination of the binary and is the separation of the stars. The masses measured by Bergeron & Liebert suggest that the inclination of the binary is approximately 60∘ and that the stars are separated by about 45.
4 The formation of PG 1115+166
The basic mechanism for the formation of most white dwarfs is fairly well understood. They are, in general, remnants of intermediate mass stars (1–8) which have evolved through the asymptotic giant branch (AGB) phase. Extreme mass loss towards the end of this phase exposes the core of the AGB star, which cools to form a white dwarf. Stars with larger initial masses are expected to form more massive white dwarfs and there is some observational evidence for this initial-final mass relation (IFMR; Weidemann 2000). White dwarfs with masses of 0.7 are expected to form from stars with initial masses of about 3.
Models of stars on the AGB are uncertain, but the radius of a star towards the end of this phase is several hundred solar radii (Girardi et al. 2000). This is much larger than the current separation of the stars so it appears that the orbit of PG 1115+166 is now substantially smaller than it was prior to the formation of the white dwarfs. Orbital shrinkage in long period binaries is explained by the “common envelope” scenario. In this scenario, the expanding red giant star comes into contact with its Roche lobe and begins to transfer mass to its companion star. This mass transfer is highly unstable, so a common envelope forms around the companion and the core of the red giant. The drag on the companion orbiting inside the common envelope leads to extensive mass loss and dramatic shrinkage of the orbit (Iben & Livio 1993). We expect the orbit of a post-CE binary to be circular, and have assumed this to be so in the case of PG 1115+166 throughout this paper. Much higher quality data than that presented here would be required to verify this assumption.
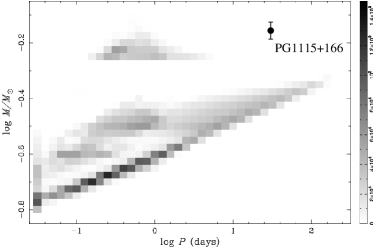
Common envelope evolution is poorly understood so it is useful to consider the limits imposed on the common envelope (CE) phase by the observed properties of PG 1115+166. Firstly, we note that published models for the population of white dwarf binaries do not predict any systems with the combination of high mass and long period seen in PG 1115+166. This is shown in Fig. 3 for the models of Iben, Tutukov and Yungelson (1997), but the same applies to the models of Nelemans (2001) and Han (1998). It is primarily the combination of high mass and long orbital period which is not explained by these models. A full exploration of all the possible formation scenarios for PG 1115+166 is beyond the scope of this paper, not least because there may have been up to three mass transfer episodes – two associated with the red giant phase prior to the formation of each white dwarf and a third associated with the born-again red giant phase of the DB white dwarf. These mass transfer episodes may not have been CE phases but may instead have involved stable mass transfer, i.e., an Algol-like phase. In this section we simply outline the observational constraints which can be applied to these scenarios and apply these constraints to the simplest case of a single CE phase.
Apart from the present day masses of the white dwarfs () and their current separation (), we also know the cooling ages of the stars are y for the DA white dwarf and y for the DB white dwarf (Bergeron & Liebert 2002). The cooling ages are the time elapsed since the AGB phase. If the progenitors of the white dwarfs were formed at the same time, this imposes a limit on the initial masses of the progenitor stars as follows. If we assume an initial mass for the progenitor of the DB star, , we can use an appropriate stellar model to find the lifetime of this star, , i.e., the time taken since it formed for the star to reach the end of AGB phase. We then know that the progenitor of the DA star will take a further y to reach the AGB phase. We can then use grid of stellar models to find the initial mass, , of a star whose lifetime is y, i.e, the mass of the progenitor of the DA star. The relationship between these initial masses is shown in Fig. 4 based on the models of Girardi et al. (2000) for Z=0.019 (solid lines) and Z=0.004 (dashed lines). Although the stars have not evolved as single stars, this argument regarding the cooling age difference between the stars remains valid because the AGB phase is much shorter than the lifetime of the star which precedes it, i.e., the stars spend most of their lives evolving as single stars. However, we should be aware that the IFMR may not apply to the white dwarfs in PG 1115+166 in the sense that a star may produce a white dwarf which is less massive than expected if it is involved in a CE phase which interrupts the growth of the future white dwarf forming in its core. Also, this constraint may not be valid if there has been significant accretion onto one of the stars. Similarly, if the born-again red giant phase of the DB star was short, the DB white dwarf may not have been re-heated to the temperatures expected for a white dwarf emerging from its first AGB phase. In this case the cooling age does not measure either the time since the AGB phase, nor the time since the born-again read giant phase, but is somewhere between these two timescales.
The observation that one of the stars is a DB white dwarf is also a constraint on possible formation scenarios for PG 1115+166. Any feasible scenario must allow for the DB white dwarf to undergo a born-again red giant phase or include an alternative explanation for how this star came to be hydrogen deficient. A stronger constraint, perhaps, is how this star avoids accreting hydrogen onto it surface despite appearing to be older than its companion which has, presumably, lost large quantities of hydrogen rich material.

With this information we consider the simplest case of a single CE phase in which the AGB star progenitor of the DA star with mass and radius interacts with the DB star when it is close to or exceeds its Roche lobe. Note that will be less than if any mass loss occurs prior to the interaction. However, this mass loss cannot have been very extensive in this scenario because the DB white dwarf cannot have gained more than so we assume . If the initial semi-major axis of the stars’ orbit is and the current separation is , the change in the orbital binding energy is
Some fraction of this energy is used to expel the envelope of the AGB star whose binding energy is given by
So from the definition of we have
If the orbit prior to the interaction has an eccentricity , then the at the time of interaction, where is the radius of the Roche lobe relative to the separation of the stars. This assumes that the interaction occurs at periastron, which is reasonable given that the orbital period (y) is much shorter than the evolutionary timescale of an AGB star.
In Fig. 5 we show lines of constant as a function of and for and . The maximum radius of an AGB star with an initial mass of is a few hundred solar radii (Bloecker 1995), so unless the eccentricity of the orbit prior to the CE phase was quite extreme () and/or the initial mass of the AGB star was lower than suggested by the IFMR (), we see that . This requires a large value of because in the absence of other sources of energy to eject the envelope. This strong limit on is a consequence of the combination of long orbital period and high mass in PG 1115+166. Large values of for AGB stars are predicted by Dewi & Tauris (2000) provided the calculation of the binding energy of the envelope includes the internal energy stored in the envelope, e.g., as ionized hydrogen. This implicitly assumes that this potential energy is efficiently converted into the kinetic energy of the envelope during the common envelope phase. Several issues arising from this scenario remain to be explored, e.g., how does the DB star avoid gaining more than of hydrogen during the CE phase, why was there no CE phase when the progenitor of the DB star went through its AGB phase and where does the born-again red giant phase fit into this scenario? It is beyond the scope of this paper to tackle these questions, but they do demonstrate that our observations of PG 1115+166 provide a challenging test of models for binary star evolution and the formation of DB white dwarfs.

5 Conclusion
We have used radial velocity measurements of the Balmer lines and HeI lines of PG 1115+166 to show that this star is a DA+DB binary white dwarf with an orbital period of 30.09d. Published models for the formation of white dwarf – white dwarf binaries do not predict any white dwarfs with the characteristics of PG 1115+166. We consider the observational constraints on scenarios for the formation of PG 1115+166. We apply these to the simplest case of a single common-envelope phase. We find that this requires that some part of the internal energy in the envelope of the AGB star contributes to the ejection of the common envelope, but several questions regarding this scenario remain to be answered. We conclude that PG 1115+166 is a key object for testing models of binary star evolution. It may also be a key object for our understanding of the formation of DB white dwarfs.
Acknowledgments
PFLM would like to thank Jacco van Loon for his helpful discussions regarding AGB stars and Phillip Podsiadlowski for sharing his thoughts on the formation of PG 1115+166. The Isaac Newton Telescope is operated on the island of La Palma by the Isaac Newton Group in the Spanish Observatorio del Roque de los Muchachos of the Instituto de Astrofisica de Canarias.
References
- [1] Beauchamp A., Wesemael F., Bergeron P., 1997, ApJS, 108, 559.
- [2] Bergeron, P., Ruiz, M.T., Leggett, S.K., 1997, ApJS, 108, 339.
- [3] Bergeron, P., Liebert J., 2002, ApJ, in press.
- [4] Bloecker, T., 1995, A&A, 297, 727.
- [5] Burleigh M.R., Bannister N.P., Barstow M.A., Maxted P., 2001, in J.L. Provencal, H.L. Shipman, J., eds., ASP Conf. Ser. 226, 12th European Workshop on White Dwarfs, p. 135.
- [6] Dewi J.D.M., Tauris T.M., 2000, A&A, 360, 1043.
- [7] Duerbeck H.W., Liller W., Sterken C., Benetti S., van Genderen A.M., Arts J., et al., 2000, AJ, 119, 2360.
- [8] Fontaine, G., Wesemael, F., 1987, In Proceedings of the 2nd Conference on Faint Blue Stars, Tucson, AZ, 1987, Davis Press, Inc. Schenectady, NY, p. 319.
- [9] Girardi L., Bressan A., Bertelli G., Chiosi C., 2000, A&AS, 141, 371.
- [10] Grabowski B., Halenka J., Madej J., 1987, ApJ, 313, 750.
- [11] Han Z., 1998, MNRAS, 296, 1019.
- [12] Heber U., Napiwotzki R., Lemke M., Edelmann H., 1997, A&A, 324, L53.
- [13] Holberg, J.B., Kidder K.M., Wesemael F.,1990, ApJ, 365, L77.
- [14] Iben I. Jr., Kaler J.B., Truran J.W., Renzini A., 1983, ApJ, 264, 605.
- [15] Iben I., Tutukov A.V., Yungelson L. R., 1997, ApJ 475, 291.
- [16] Iben I., Livio M., 1993, PASP, 105, 1373.
- [17] Kidder K.M., Holberg J.B., Barstow M.A., Tweedy R.W., Wesemael F., 1992, ApJ, 394, 288.
- [18] Koester D., Liebert J., Saffer R.A., 1994, ApJ, 422, 783.
- [19] Marsh, T.R., 1989, PASP 101, 1032.
- [20] Marsh, T.R., Dhillon, V.S., Duck, S.R., 1995, MNRAS 275, 828.
- [21] Maxted P.F.L., Marsh T.R., Moran C.K.J., 2000, MNRAS, 319, 305.
- [22] Moran, C.K.J., 1999, PhD thesis, University of Southampton.
- [23] Nelemans G., Verbunt F., Yungelson L.R., Portegies Zwart S.F., 2000, A&A, 360, 1011.
- [24] Nelemans G., Yungelson L.R., Portegies Zwart S.F., Verbunt F., 2001, A&A, 365, 491.
- [25] Provencal J.L., Shipman H.L., Thejll P., Vennes S., 2000, ApJ, 542, 1041.
- [26] Saffer R.A. Livio M., Yungelson L.R., 1998, ApJ, 502, 394.
- [27] Shipman, H.L., Liebert, J., Green, R.F., 1987, ApJ, 315, 239
- [28] Tout C.A., Eggleton P., MNRAS, 231, 823.
- [29] Weidemann V., 2000, A&A, 363, 647.
- [30] Wesemael F., Bergeron P., Lamontagne R.L., Fontaine G., Beauchamp A., Demers S., Irwin M.J., Holberg J.B., Kepler S.O., Vennes S., 1994, ApJ, 429, 369.
- [31] Wolff B., Jordan S., Koester D., Reimers D., 2000, A&A, 361, 629.