Massive star formation in Luminous Infrared Galaxies: Giant H ii regions and their relation to super star clusters111Based on observations with the NASA/ESA Hubble Space Telescope, obtained from the data Archive at the Space Telescope Science Institute, which is operated by the Association of Universities for Research in Astronomy, Inc., under NASA contract NAS 5-26555.
Abstract
We have used HST/NICMOS broad-band (at m) and narrow-band Pa (m) images to identify star clusters and H ii regions respectively in a sample of 8 luminous infrared galaxies (LIRGs). These observations have revealed the presence of a large population of super star clusters and bright H ii regions. A significant fraction of the H ii regions shows H luminosities above that of 30 Doradus, the prototypical giant H ii region. The excess of extremely luminous H ii regions in LIRGs has been confirmed by comparison with normal galaxies observed at similar spatial resolutions. Despite the large numbers of identified star clusters and H ii regions in LIRGs, we only find a small fraction of coincidences, between 4% and 30% of the total number of detected sources. Using evolutionary synthesis models we have reproduced the relative fractions of young H ii regions, intermediate and old star clusters observed in Arp 299 and the central region NGC 3256 using a Salpeter IMF and instantaneous star formation. H ii regions with no detected near-infrared cluster counterpart (% of the detected sources) represent the youngest sites of star formation, with ages of up to approximately 5 Myr and mostly intermediate mass () ionizing clusters. For these two galaxies, and within the present detection threshold we can only detect coincidences (% of the detected sources) between an H ii region and a near-infrared star cluster for the most massive star clusters () during the first 7 Myr of their evolution. If there is significant extinction during the first million years, we may not detect the youngest star forming regions, and hence the observed fractions of H ii regions and coincidences will be lower limits. The identified near-infrared SSCs with no detectable Pa emission represent the “old” population (% of the detected sources), with ages of between 7 and Myr. Older clusters possibly created in this or previous episodes of star formation are likely to exist in these systems but cannot be identified with the present detection threshold. Our study demonstrates that Pa narrow-band imaging of LIRGs and interacting galaxies identifies the youngest sites of star formation that could be otherwise missed by near-infrared broad-band continuum surveys.
Subject headings:
galaxies: ISM — ISM: HII regions — galaxies: spiral — infrared radiation — infrared: galaxies — galaxies: interactions — galaxies: star clusters1. Introduction
Infrared galaxies (Rieke & Low 1972), and in particular nearby luminous and ultraluminous infrared galaxies (LIRGs and ULIRGs, with L⊙ and L respectively) have long been recognized as one of the best laboratories to study the process of violent star formation in the Local Universe. The dust-rich environments of LIRGs and ULIRGs are thought to be similar to the conditions in which star formation occurred at high redshift (Ivison et al. 2000 and references therein).
It is clear now from both the theoretical and the observational viewpoints that interactions play a major role in enhancing star formation throughout galaxies. In fact, the fraction of interactions/mergers increases from for L⊙ up to for L⊙. The process of merging with accompanying super-starbursts appears to be an important stage in galactic evolution, possibly even converting spiral galaxies into ellipticals (see Sanders & Mirabel 1996 for a review). Moreover, it has been recently suggested that most interacting/merging systems have gone or will go through an ultraluminous phase, depending on how efficiently molecular gas can be funneled into the nuclear regions. This may imply that most of ULIRG class systems may spend a large portion of their lifetime in the less powerful class of LIRGs (Murphy et al. 2001).
| Galaxy | Dist | Morphology | Filters | Linear | Program | |
|---|---|---|---|---|---|---|
| (L⊙) | (Mpc) | Scale | ||||
| NGC 6808 | 10.94 | 46 | Isolated | NIC3 F160W, F190N | 45 pc pixel-1 | 7919 |
| NGC 5653 | 11.01 | 47 | Isolated | NIC3 F160W, F190N | 45 pc pixel-1 | 7919 |
| Zw 049.057 | 11.22 | 52 | Isolated, edge-on | NIC2 F160W, F187N, F190N | 19 pc pixel-1 | 7219 |
| NGC 3256 | 11.48 | 37 | Advanced merger | NIC2 F160W, F187N, F190N | 14 pc pixel-1 | 7251 |
| NGC 1614 | 11.62 | 64 | Advanced merger | NIC2 F160W, F187N, F190N | 24 pc pixel-1 | 7218 |
| VV 114 | 11.62 | 80 | Interacting pair | NIC2 F160W, NIC3 F187N, F190N | 29, 78 pc pixel-1 | 7219 |
| NGC 6240 | 11.82 | 97 | Advanced merger | NIC2 F160W, F187N, F190N | 36 pc pixel-1 | 7219 |
| Arp 299∗ | 11.91 | 42 | Interacting pair | NIC2 F160W, F187N, F190N | 15 pc pixel-1 | 7218 |
Note. — The infrared luminosity corresponds to the spectral range between 8 and m.
∗The two components of Arp 299 are usually referred to as IC 694 (the Eastern component) and NGC 3690 (the Western component).
In last decade or so, mainly with HST observations, we have started to get the first glimpses into the detailed nature (that is, on scales of a few tens of parsecs) of the extreme star formation processes in LIRGs and interacting galaxies. The discovery, both in the optical and the near-infrared, of a large population of massive (young) star clusters, the so-called super star clusters (SSCs), has shown that a significant fraction of the massive star formation is occurring there (see among others, Whitmore et al. 1993; Schweizer et al. 1996; Zepf et al. 1999; Alonso-Herrero et al. 2000, and 2001a – AAH00, AAH01; Scoville et al. 2000 and references therein). This population of SSCs is not only inherent to LIRGs and ULIRGs, but it has also been identified in groups of galaxies (e.g., Gallagher et al. 2001) or even isolated barred or ringed galaxies (e.g., Alonso-Herrero, Ryder, & Knapen 2001b; Maoz et al. 2001 and references therein). For a recent review on the subject of SSCs in external galaxies, we refer the reader to Whitmore (2000).
While a lot of effort is being devoted to understanding the properties of SSCs, HST/NICMOS imaging has only recently revealed a population of bright H ii regions in two LIRGs, Arp 299 and NGC 1614 (AAH00; AAH01). A large fraction of these H ii regions show luminosities in excess of that of 30 Doradus, the prototypical giant H ii region. One of the main difficulties in quantifying the age of the stellar populations in LIRGs and interacting galaxies is breaking the age-extinction degeneracy. This usually translates into only rough age estimates for SSCs (from photometric data) ranging between 5 and 900 Myr (see the recent review by Whitmore 2000). H ii regions, on the other hand, will highlight the youngest regions of star formation, with ages of Myr, as these are the lifetimes of the O and B stars required to ionize the gas. Clearly, understanding the properties of H ii regions and SSCs, and their relation at high spatial resolution will provide further insight into the nature of the star formation processes in LIRGs.
In this paper we present a study of the detailed (tens to a few hundred parsecs) properties of the star forming regions (H ii regions and star clusters) of a sample of 8 LIRGs. This paper is organized as follows. Section (2) describes the observations, data reduction and the production of the H ii region and star cluster catalogs. In Section (3) we establish the overall morphology of star forming regions in LIRGs and its relation with the dynamical stage of the galaxy. In Section (4) the statistical properties of H ii regions in LIRGs are analyzed and compared with those of normal galaxies observed at comparable spatial resolutions. The spatial distribution of H ii regions and star clusters, their relative numbers and the age sequence are analyzed in Section (5). Our conclusions are presented in Section (6).
2. Observations
The large amount of extinction routinely present in LIRGs, and in particular, the fact that active star forming regions are expected to contain non-negligible amounts of dust, prompted us to search the HST archive for infrared observations. The obvious choice was narrow-band Pa and broad-band continuum imaging to identify H ii regions and star clusters respectively. This resulted in a sample of eight LIRGs. The sample covers a range of infrared luminosities – between and – as well as a variety of dynamical stages: isolated galaxies, close pairs of interacting galaxies and advanced mergers. The sample is presented in Table 1222Note that although NGC 6808 is not technically a LIRG, its infrared luminosity () is close enough to the limit that it is included in our sample in increasing order of infrared luminosity.
2.1. Data reduction
The observations of the LIRGS analyzed in this paper were obtained as part of a variety of HST/NICMOS GTO and GO programs, listed in Table 1. The Pa+continuum images were taken with the NIC2 and NIC3 cameras (pixel size 0.076″pixel-1 and 0.2″ pixel-1, respectively) using the narrow-band filter F190N filter. At the distances of the LIRG sample, this filter () contains the Pa emission line and the adjacent continuum at m. For the continuum subtraction, images through the F187N filter were used, except for NGC 5653 and NGC 6808 (from Böker et al. 1999 survey) for which broad-band F160W filter observations were employed instead. The field of view of the images is and for the NIC2 and NIC3 observations, respectively. All the continuum images used to identify the star clusters were observed through the F160W filter which represents a good compromise between the better spatial resolution at shorter wavelengths and lower extinction at longer wavelengths.
In Table 1 for each galaxy we list the infrared luminosity, distance (assuming ), large scale morphology, cameras and filters used, the corresponding linear scale in parsec per pixel and the HST program number of the observations.
The images were reduced using nicred (McLeod et al. 1997) routines, which involve subtraction of the first readout, dark current subtraction on a readout-by-readout basis, correction for linearity and cosmic ray rejection (using FULLFIT), and flat fielding. For the data reduced we used on-orbit dark and flatfield images. The angular resolution (FWHM) of the NIC2 and NIC3 images is approximately 0.14″and 0.30″, respectively, as measured from the point spread function (PSF) of stars in the images.
2.2. Flux calibration and correction for off-center emission lines
The flux calibration of the F160W, F187N and F190N images was performed using conversion factors based upon measurements of the standard star P330-E, taken during the Servicing Mission Observatory Verification (SMOV) program (M. J. Rieke, private communication 1999).
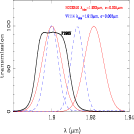
The observed wavelength of Pa for the two most distant galaxies in our sample, VV 114 and NGC 6240, is m and m respectively. Figure 1 shows the observed Pa emission lines as Gaussian functions with line widths of m for NGC 6240 (Goldader et al. 1997) and m for VV 114 (assuming that the line is unresolved and a 10% error, Doyon et al. 1995, and Goldader et al. 1997). For comparison we also display the same emission lines as if they had been observed at the center of the F190N filter. As can be seen from this figure for both galaxies, the observed Pa emission lines are significantly displaced from the center of the narrow-band F190N filter. Assuming Gaussian line profiles, we estimate that the NICMOS filter may intercept only and of the full Pa line flux for these galaxies, respectively. Given the large and uncertain correction implied to the true line flux, our results for these two galaxies are only qualitative.
Throughout the paper we have converted the Pa luminosity into the more commonly used H luminosity, assuming case B recombination ().
2.3. Production of the H ii region and star cluster catalogs
The H ii region catalogs were produced using the software region, kindly provided by Dr. C. H. Heller (see Pleuss, Heller, & Fricke 2000, and references therein for a detailed description). region is a semi-automated method to locate and compute statistics of H ii regions in an image, based on contouring, taking into account the local background. The lower limit for the size of an H ii region is set to 9 contiguous pixels, which for the distances of the galaxies in our sample corresponds to minimum linear sizes (diameters) of between 42 and 234 pc. Each pixel must have an intensity above the local background of at least three times the rms noise of that local background (see Rand 1992 for more details on the criteria employed). After identifying the H ii regions, the program measures their position, size (area) and luminosity by subtracting the closest local background from the observed flux. For more details on the method and a discussion on the spatial resolution effects see Pleuss et al. (2000), and Alonso-Herrero & Knapen (2001).
In Section 5 we will compare the number of detected H ii regions with the number of star clusters. To this end we need to determine the magnitude to which the -band luminosity distributions of the star clusters are complete. The positions of the star clusters were identified from the m continuum images using the DAOFIND task in iraf. As discussed in AAH00 for Arp 299, we find that the star clusters in most of the systems studied here are located on a local background with a substantial gradient, and a large degree of crowding. Thus an automated method to perform photometry as that provided by DAOFIND may yield to systematic errors, especially for the faintest star clusters. For this reason we have performed aperture photometry on the clusters of the three galaxies with the best spatial resolution (NGC 3256 and the two components of Arp 299) for which the results will be discussed in Section 5.
The photometry was obtained through a relatively small aperture (), so an aperture correction was applied to account for the total flux. The absolute -band magnitudes of the star clusters in these two systems range up to mag. The detection lower limit depends on the underlying galaxy background and the degree of crowding. We find that the luminosity distribution of the star clusters is complete down to mag and mag for NGC 3256 and Arp 299, respectively. This includes approximately of the detected clusters in both galaxies. The error accounts for uncertainties in the local background subtraction. For the luminosities and properties of the brightest star clusters in NGC 1614 we refer the reader to AAH01. Scoville et al. (2000) presented photometry for the brightest near-infrared star clusters in Zw049.057, NGC 6240 and VV 114. As is the case for NGC 3256 and Arp 299, the cluster -band magnitudes are found to range up to mag.
| Galaxy | FOV of Pa | |||
|---|---|---|---|---|
| (erg s-1) | ||||
| NGC 6808 | 41.38 | 3.1 | ||
| NGC 5653 | 41.72 | 2.9 | ||
| Zw 049.057 | 41.21 | – | 3.6 | |
| NGC 3256 | 42.11 | 0.41 | 3.0 | |
| NGC 1614 | 42.60 | 0.65 | 2.5 | |
| VV 114 | 42.55∗ | 0.37 | 2.7∗ | |
| IC 694 | 41.95 | 0.58 | 2.6 | |
| NGC 3690 | 42.16 | 0.18 | 3.1 | |
| NGC 6240 | 43.19∗ | 2.2∗ |
Note. — “FOV of Pa” is the area imaged through this emission line.
∗Because of the large correction needed to account for the Pa emission line flux missing in the F190N filter (Section 2.2), these values are uncertain.
3. Morphology of the Pa line emission in LIRGs
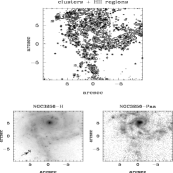
The top panels of Figure 2 are the contours of the continuum-subtracted Pa line emission for the galaxies in our sample. We show the locations of the near-infrared star clusters and the emission peaks of the H ii regions as stars and open circles respectively (see Section 5). The bottom left panels of Figure 2 are the continuum emission images at m, whereas the bottom right panels are the continuum subtracted Pa images for the same fields of view. The images are displayed with the original HST orientation. These figures illustrate the variety of Pa line emission morphologies found in LIRGs.
The isolated galaxies in our sample (NGC 6808, NGC 5653 and Zw 049.056) exhibit H ii regions along the spiral arms. NGC 6808, the LIRG in our sample with the lowest infrared luminosity shows the typical H ii region distribution of a spiral galaxy. Zw 049.056 appears as a highly inclined galaxy, and only shows faint Pa emission along the disk of the galaxy, perhaps as a result of the high extinction there (Scoville et al. 2000). NGC 5653 shows asymmetric Pa emission, with most and the brightest H ii regions located in one of the spiral arms. This galaxy has been classified as a lopsided galaxy (Rudnick, Rix, & Kennicutt 2000). Lopsidedness is usually assumed to be a dynamical indicator of a weak tidal interaction, that is, when the interaction does not destroy the disk of the galaxy. No bright nuclear emission is detected in NGC 5653 and NGC 6808.
The Pa line emission of interacting/merging systems shows a more complex morphology, differing significantly from the stellar light distribution (continuum images). A common denominator for all these systems is the bright emission from the nuclei of the galaxies. The Pa nuclear emission is usually compact, extending over scales of pc, except in NGC 1614 where the Pa emission in the form of a ring of giant H ii regions with an approximate diameter of 600 pc (see AAH01 for more details).
In the interacting/merging systems, besides the bright nuclear Pa emission, the recent star formation is also widely spread throughout the galaxies. In NGC 3256 and NGC 1614 the Pa emission extends along the spiral arms over at least 4 kpc and 6 kpc (that is, the field of view of the HST/NICMOS images for these galaxies). In the interacting systems Arp 299 and VV 114, H ii regions are detected throughout the galaxies, and at the interface region. This is in good agreement with findings for ULIRGs in Murphy et al. (2001). The Pa morphology in the merging/interacting systems clearly shows that the effects of extreme star formation can propagate throughout the galaxies and not only in the nuclei. Recently Bekki & Couch (2001) have run stellar and gas numerical simulations of galaxy mergers to find the most promising sites for formation of SSCs. They conclude that these SSCs are not only formed in the central regions, but also between the two interacting galaxies.
NGC 6240 only shows Pa emission originating in both nuclei (separated by only 0.8 kpc). This is consistent with recent HST/WFPC2 H imaging (Gerssen et al. 2001). The larger scale filamentary diffuse morphology in NGC 6240 has not been detected by the NICMOS observations, probably as a result of the Pa line falling at the edge of the narrow-band filter (see Section 2.2).

As most of the infrared luminosity in LIRGs is believed to be due to dust heated in regions of strong star formation, the mid-infrared emission in LIRGs would be expected to trace the Pa emission. Recently Soifer et al. (2001) have obtained high resolution mid-infrared observations of LIRGs and reported that a substantial fraction () of the infrared luminosity is generated in regions of sizes ranging from 100 pc to a 1 kpc, with the nuclear starbursts often dominating the mid-infrared luminosity. They also concluded that the m emission traces the current sites of dusty luminous star formation. This can be confirmed by the good correspondence between the mid-infrared and the Pa emission morphologies of the galaxies in common with our study: Arp 299, VV 114 and NGC 1614.
| Galaxy | ||||||
|---|---|---|---|---|---|---|
| (erg s-1) | (erg s-1) | (erg s-1) | (pc) | (pc) | (pc) | |
| LIRGs | ||||||
| NGC 3256 | 41.53 | 41.24 | 39.51 | 308 | 253 | 80 |
| IC 694 | 41.71 | 41.29 | 39.56 | 448 | 298 | 82 |
| NGC 3690 | 41.43 | 41.33 | 39.72 | 346 | 320 | 94 |
| NGC 1614 | 41.01 | 41.00 | 39.89a | 210a | 205a | 148a |
| NGC 6808 | 40.18 | 40.11 | 39.22 | 461 | 423 | 201 |
| NGC 5653 | 41.02 | 40.74 | 39.49 | 551 | 468 | 199 |
| VV 114 | 41.94b | 41.79b | 40.52b | 920 | 842 | 382 |
| Comparison Normal Galaxies | ||||||
| NGC 4192 | 39.52 | 39.39 | 38.52 | 158 | 147 | 76 |
| NGC 4389 | 39.44 | 39.36 | 38.70 | 151 | 134 | 74 |
| IC 750 | 39.89 | 39.73 | 38.62 | 191 | 184 | 72 |
| NGC 4102 | 40.48 | 40.32 | 38.32 | 263 | 223 | 80 |
Note. — a Statistics excluded the bright H ii regions in the ring of star formation, as blending effects are present.
b Uncertain because of the large correction needed to account for the Pa emission line flux missing in the F190N filter (Section 2.2).
In Table 2 we list the total H luminosity from the detected H ii regions, along with the percentage of the Pa emission originating in the nuclei of galaxies. These fractions should be considered only as lower limits as the compact nuclear regions are usually more reddened than the regions where the more diffuse H ii regions are located (see e.g., AAH00; Lípari et al. 2000; Scoville et al. 2000; see also Murphy et al. 2001 for ULIRGs). Nevertheless it is apparent that the nuclear to total emission ratios vary significantly from system to system, and show similarities with the same ratios computed for the infrared luminosities (Soifer et al. 2001). In the isolated systems most of the star formation is occurring in the disks of the galaxies, whereas in the interacting/merging systems the location of the star forming regions depends on factors such as the age of the interaction process and the physical properties of the interacting galaxies (among others, the initial gas content and mass ratios of the interacting galaxies, see e.g., Bekki & Couch 2001). Table 2 also gives the ratios between the infrared luminosity and the total H luminosity for the LIRGs in our sample. These ratios are found to be similar for all the galaxies except for Zw 049.057 where the Pa emission is probably affected by high extinction, and NGC 6240 for which the Pa luminosities are uncertain as discussed in Section 2.2.
4. Statistical properties of giant H ii regions in LIRGs
4.1. Luminosities, Sizes and Luminosity Functions
We have measured the luminosity and diameter of the identified H ii regions in our sample of LIRGs. For each galaxy we determined the H luminosity for the brightest H ii region, for the three brightest H ii regions (first-ranked H ii regions) and the median H ii region, as well as the diameter for the largest H ii region (which is not necessarily the brightest H ii region), for the first-ranked H ii regions and the median H ii regions. The results are summarized in the first part of Table 3, where galaxies are sorted in order of decreasing spatial resolution. As discussed in Alonso-Herrero & Knapen (2001) and others, even at HST spatial resolutions the problem of defining an H ii region remains. For instance, at increasing higher spatial resolutions different emission peaks within an H ii region may be identified as individual H ii regions thus cataloging them as smaller and less luminous H ii regions. Conversely, as the spatial resolution becomes poorer, blending effects will become more frequent. This effect is clearly seen in the increasing median sizes of H ii regions in the LIRG sample for decreasing spatial resolutions (Table 3).
All the LIRGs in our sample contain a significant number of exceptionally bright H ii regions (i.e., the median values of the H ii region luminosity distribution) with H luminosities comparable to that of the giant H ii region 30 Doradus (). The first-ranked H ii regions in the interacting/merging galaxies – usually coincident with the nuclei of the galaxies – are between one and two orders of magnitude brighter than the median H ii regions. As can be seen from Table 3 the luminosities of the brightest and first-ranked H ii of the two isolated galaxies, even at poorer spatial resolutions, are markedly less luminous than their counterparts in interacting/merging systems. Unfortunately the small number of LIRGs in our sample does not allow us to establish whether isolated LIRGs tend to have fainter H ii regions than interacting LIRGs.
The statistical properties of H ii regions are represented with LFs, usually fitted by a power law:
| (1) |
where is the index of the power law with values of for extragalactic H ii regions (Kennicutt, Edgar, & Hodge 1989). We have constructed H ii region LFs for the two LIRGs in our sample with a sufficiently high number of detected H ii regions: Arp 299 and NGC 3256 (shown in Figure 3). We have fitted the slopes of the LFs excluding the nuclei and the regions of strong star formation activity in Arp 299 (as they may be blends of a few regions) and found values of and for NGC 3256 and Arp 299, respectively. If we include all H ii regions in the fit, the values of the slopes are and respectively. These slopes are within the values fitted for H ii regions in the disks and circumnuclear regions of normal galaxies (e.g., Kennicutt et al. 1989), and those found from fitting the luminosity functions of star clusters (e.g., Zepf et al. 1999; Whitmore 2000).

4.2. Comparison with normal galaxies
A number of studies have analyzed the statistical properties of H ii regions (luminosities, sizes, density numbers) in the disks of normal spiral galaxies in terms of the morphological type of the galaxy and the arm-interarm regions (see for instance the classical study of Kennicutt et al. 1989). Because of the effect of the spatial resolution on the properties of H ii regions, we chose to compare the statistical properties of the H ii regions in LIRGs with those of the circumnuclear H ii regions of normal galaxies (as derived from HST/NICMOS Pa observations) studied by Alonso-Herrero & Knapen (2001). From this work, we have selected galaxies at the distance of the Virgo Cluster (Mpc), for which the NIC3 observations provide a resolution of 16 pc pixel-1, similar to that of NGC 3256, NGC 3690 and IC 694.
In the second part of Table 3 we summarize the statistical properties of H ii regions of the normal galaxies with the highest degree of central star forming activity (as measured from the central kpc H luminosity): NGC 4192, NGC 4389, IC 750, and NGC 4102.
Figure 4 shows histograms comparing the H luminosities of H ii regions in LIRGs and normal galaxies. We have divided the normal galaxies into two groups, isolated galaxies (NGC 4192, NGC 4389 and NGC 4102) and the interacting galaxy IC 750. In this figure we also indicate the H luminosity of 30 Doradus, the prototypical giant H ii region. These histograms not only show that giant H ii regions are more common in LIRGs than in normal galaxies – even when comparing with the interacting system IC 750 – but also that the median H ii regions in LIRGs are at least an order of magnitude brighter than in normal galaxies.
The large population of giant H ii regions in LIRGs – with a significant fraction being more luminous than 30 Doradus – is unprecedented in normal galaxies. There are a number of possible explanations. We may just be seeing the extended tail of the H ii region LF which translates into a larger number of the more massive ionizing star clusters, a extremely young population of star forming regions in LIRGs, or perhaps the bright H ii regions in LIRGs may represent aggregations of normal H ii regions. The typical (median) diameters for H ii regions in normal galaxies and LIRGs observed at the same spatial resolution are comparable (see Table 3). This seems to argue against the last possibility. Even though the first ranked H ii regions in LIRGs are typically a factor of two larger than in normal galaxies, the luminosities of the first-ranked (as well as median) H ii regions in LIRGs would require aggregations of ten “normal” H ii regions. Other possibilities are then evolutionary effects and the upper limit to the mass of the ionizing clusters.
As can be seen from the simulations of H ii region LFs by Oey & Clark (1998) the age of the stellar population is one of the factors determining the high luminosity end of the H ii region LF. For a population of H ii regions formed in a single burst, the high luminosity end of the LF as well as the slope vary as the population ages. In the case of continuous creation of H ii regions the high luminosity end of the LF remains approximately constant. The youth of a population of coeval H ii regions could be a possibility to explain the excess of bright H ii regions in LIRGs. As we shall see in the next section however, the H ii regions in LIRGs show a range of ages, which means that the extreme luminosities of the H ii regions in LIRGs are not due to the fact that they are all very young.
Since the fitted slopes of the H ii region LFs of two LIRGs are consistent with the values found in normal galaxies, the extraordinary luminosities of H ii regions in LIRGs are simply reflecting a larger number of massive star clusters in LIRGs, rather than an anomalous stellar mass distribution. As discussed in Bekki & Couch (2001), the physical conditions (high gas pressure and density of the interstellar medium) necessary for the formation of super star clusters can only be achieved in systems undergoing a rapid transfer of gas to the central regions, that is, interacting galaxies. It is unlikely that these conditions are met in isolated disk galaxies.
5. Giant H ii regions and their relation to SSCs
5.1. Spatial distribution of the H ii regions and near-infrared star clusters
Figure 2 shows that the emission peaks of the H ii regions are generally not spatially coincident with the location of the near-infrared star clusters. To quantify this, we have cross-correlated the positions of the H ii regions and the near-infrared clusters. We counted a coincidence when the spatial separation between an H ii region and a cluster was equal or less than 0.15″–0.11 ″ (for the NIC2 images) and 0.40″–0.30 ″(for the NIC3 images), that is, a separation of 2 and 1.5 pixels respectively.
The results from the cross-correlation are presented in the first part of Table 4 where we list the number of detected H ii regions, and star clusters, together with the number of coincidences. As was clear from Figure 2, the number of coincidences is relatively small. The increasing number of coincidences (intermediate age H ii regions/clusters) for NGC 5653, NGC 6808 and VV 114 may be the result of the poorer spatial resolutions of the NIC3 images, which implies that a coincidence is counted when the spatial separations are pc (pc for the 2 pixel separation). For comparison, the spatial separations for the galaxies observed with the NIC2 camera are pc (or pc if we use the 2 pixel separation). This lack of spatial coincidence between H ii regions and clusters has also been found in barred and ringed galaxies with strong star formation activity (Alonso-Herrero et al. 2001b; Maoz et al. 2001).
Theoretical arguments may offer an explanation for the apparent offsets between the location of the SSCs and the H ii regions in LIRGs. For instance, Tan & McKee (2000) have proposed a model in which young clusters within clouds with masses can survive for up to 3 Myr and allow for the formation of gravitationally bound clusters (which in turn may evolve into globular clusters) in the presence of vigorous feedback (Wolf Rayet winds and supernovae). According to their model, after approximately 3 Myr, the gas will be disrupted and the star cluster will emerge from its cocoon, and will be visible. The youngest SSCs are still embedded in the (probably dusty) H ii regions, and demonstrates that giant H ii regions offer us an unprecedented view to the truly youngest (high-mass) star formation activity. The SSCs on the other hand show a broader range of ages as we shall show in the next section.
There are also Galactic examples of this situation in obscured giant H ii regions, where a variety of complex morphologies including nebular emission, regions of high and variable extinction and centrally concentrated star clusters are seen (see Blum et al. 2001 for a census, and references therein). In particular these authors have established an evolutionary sequence for their sample of giant H ii regions (see their figure 1), based on the morphology and spectroscopic ages of the stars. In the youngest H ii regions the cluster stars are still veiled by the hot dust from their birth cocoons; as the H ii region ages, the clusters become more revealed as the gas will be dispersed by energetic winds and radiation pressure from the hot stars, until finally most of the gas will have dispersed.
The lack of spatial correspondence between the near-infrared SSCs and the bright H ii regions in LIRGs is suggestive of a similar evolutionary sequence as that seen in obscured Galactic giant H ii regions. To first order, ignoring possible effects of extinction and the observational detection limits, those H ii regions with no near-infrared cluster counterpart will tend to be the youngest examples of star forming regions in which the gas is being ionized by the most massive stars, while the star clusters will still be embedded; we denote them as “young H ii regions/clusters”. They account for between 20% and 40% of all the detected sources (star clusters and H ii regions) in LIRGs (see Table 4). The coincidences correspond to the case of an evolved H ii region in which the near-infrared cluster is becoming “visible”, that is, the time period in which the cluster has begun to emerge from the natal dust. At the same time the first red supergiants will start appearing so the cluster will become bright in the near-infrared. The “intermediate H ii regions/clusters” account for up to of the cluster + H ii region population in LIRGs. We also find that the number of coincidences tends to increase for the more luminous H ii regions. For instance, in NGC 3256 we find that of the high luminosity H ii regions have a new-infrared cluster counterpart (see next section). And finally, the near-infrared star clusters with no H ii region counterpart represent the case where the most massive (ionizing) stars have disappeared so there will be no detectable gas emission; these will be referred to as “old clusters”. We estimate that they contribute between 56% and 72% of the detected cluster population of LIRGs.
5.2. Modelling of the H ii region to near-infrared star cluster age sequence
The age/coincidence argument can be developed further by using outputs of evolutionary synthesis models and the relative numbers of H ii regions, coincidences and near-infrared star clusters. Obviously for a given galaxy, the number of identified sources depends on the detection threshold of the current observations. It will be easier to present this argument using the three galaxies with the best spatial resolutions: NGC 3256, IC 694 and NGC 3690. The argument however will be valid for any galaxy by changing the detection limits.
In Section 2.3 we established that the -band luminosity functions of the star clusters in NGC 3256 and Arp 299 are complete down to absolute magnitudes of mag and mag, respectively. The H ii region luminosity functions are approximately complete down to (previous section), which is equivalent to a number of ionizing photons of . We can use these detection limits to compute the fractions of young, intermediate and old populations for the complete distributions of NGC 3256, IC 694 and NGC 3690 (second part of Table 4). Using the complete distributions increases the H ii region fraction by , whereas the old cluster fraction drops by , and the coincidence fraction remains approximately constant. We will make use of evolutionary synthesis models to establish an age sequence, as well as to reproduce the fractions of young, intermediate and old clusters in these systems. Our choice for the evolutionary synthesis models will be Starburst99 (Leitherer et al. 1999) and those of Rieke et al. (1993).
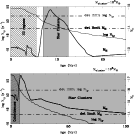
In Figure 5 we show outputs of Starburst99 for two different cluster masses: and , a Salpeter IMF (with lower and upper mass cutoffs of and respectively), instantaneous star formation and solar metallicity. The solid lines represent the time evolution of the number of ionizing photons (thin solid line) and the -band absolute magnitude (thick solid line). For simplicity we only show the detection thresholds for NGC 3256 as dashed-dotted lines at mag (scale on the right hand side of the diagram) and (scale on the left hand side of the diagram). For a cluster (lower panel of Figure 5), and for ages up to Myr we will observe a coincidence between an H ii region and a near-infrared star cluster (i.e., when both and are above their respectively detection thresholds, shown as the closely hatched area), assuming no extinction (see Section 5.4.1). After 7 Myr and for at least 100 Myr, we will be able to detect star clusters (grey area), but no coincidences, since has fallen below its threshold.
The case of a Starburst99 cluster is displayed in the upper panel of Figure 5. The detection limits in NGC 3256 will allow us to identify H ii regions for up to 5 Myr (shown as a lightly hatched area) and near-infrared star clusters for ages Myr (shown as the grey color area). After approximately Myr, the star clusters will be too faint to be detected with the current detection threshold. Note that for clusters of mass there will be no age for which we could detect both an H ii region and a near-infrared star cluster (that is, there will be no coincidences). Within the present detection limits, for NGC 3256 and Arp 299 star clusters with masses of less than will not be detected as either star clusters or H ii regions, as at no time during their evolution will they be brighter than mag or , respectively.
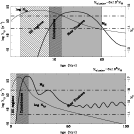
For a more extended period of star formation we have used outputs of Rieke et al. (1993) models with a Gaussian star formation rate of 5 Myr FWHM. The results are presented in Figure 6 for two clusters with masses and for a truncated Salpeter IMF333 between 1 and , and between 0.1 and .. Figure 6 is coded in the same way as Figure 5. It is clear that the different star formation rates will produce different fractions of H ii regions, coincidences and star cluster detections. For instance, in the case of a cluster formed in a Gaussian burst, we will detect H ii regions alone between 3 and 9 Myr, before the -band luminosity of the cluster becomes detectable. In the case of the cluster, because the star formation period is more extended than in the instantaneous burst, it is still possible to have coincidences for a short period of time, between 9 and 12 Myr.
We now need to assume a mass distribution for the star clusters. Elmegreen & Efremov (1997) proposed that all types of clusters (young star clusters, globular clusters, open clusters and associations) form with nearly constant efficiency in gas clouds. This universal mechanism applies then to all regions regardless of epoch or geometry. Thus the mass distribution of the star clusters in NGC 3256 and Arp 299 can be represented as a power law:
| (2) |
where is the slope of the distribution. From star cluster and H ii region LFs, it is found that the slope has values of (see Elmegreen & Efremov 1997 and references therein). In particular, Zepf et al. (1999) have found a slope of for the optical LF of the young star clusters in NGC 3256.
The next step is to assume an age distribution for the star clusters. From optical spectroscopy of the H ii regions of Arp 299, we measured a range of equivalent widths of H (a similar situation is found in NGC 3256, see Lípari et al. 2000) which implies that the star clusters/H ii regions are not coeval. We will assume that clusters are formed at a constant rate, so there is a range of ages. Using Equation (2) for the mass distribution of the star clusters, and the evolutionary synthesis models presented above, we can obtain an estimate the fractions of young, intermediate and old clusters. For the two galaxies in consideration we will only need to take into account star clusters with masses between and . Less massive clusters will not be observed with the present detection threshold, whereas the upper limit of the -band luminosity distribution (mag) indicates that there are no star clusters more massive than . The latter seems to be true for all the interacting/merging LIRGs in our sample.
| Galaxy | No. H ii | No. | No. star | Young H ii | Intermediate | Old |
|---|---|---|---|---|---|---|
| regions | Coincidences | clusters | regions | clusters/H ii regions | clusters | |
| (1) | (2) | (3) | (4) | (5) | (6) | (7) |
| NGC 3256 | 129 | 221 | % | % | % | |
| IC 694 | 58 | 131 | % | % | % | |
| NGC 3690 | 75 | 210 | % | % | % | |
| NGC 1614 | ring(20) + 30 | 99 | % | % | % | |
| NGC 6808 | 81 | 122 | % | % | % | |
| NGC 5653 | 71 | 144 | % | % | % | |
| VV 114 | 35 | 52 | % | % | % | |
| Complete distributions | ||||||
| NGC 3256 | 128 | 170 | % | % | % | |
| IC 694 | 57 | 99 | % | % | % | |
| NGC 3690 | 73 | 158 | % | % | % | |
Note. — The range in numbers in columns (3), (5), (6) and (7) correspond to the criteria used for counting a coincidence between an H ii region and a cluster: a separation of pixels
| Galaxy | Age | Young H ii | Intermediate | Old |
|---|---|---|---|---|
| Distribution | regions/clusters | clusters/H ii regions | clusters | |
| Instantaneous burst | ||||
| NGC 3256 | Myr | 50% | 14% | 36% |
| Myr | 36% | 10% | 54% | |
| Myr | 28% | 8% | 64% | |
| Myr | 17% | 5% | 78% | |
| Arp 299 | Myr | 50% | 14% | 36% |
| Myr | 31% | 9% | 60% | |
| Myr | 25% | 7% | 68% | |
| Myr | 16% | 4% | 79% | |
| Myr Gaussian burst | ||||
| NGC 3256 | Myr | 80% | 20% | 0% |
| and Arp 299 | Myr | 34% | 23% | 43% |
| Myr | % | % | % | |
| Myr | % | % | % | |
5.3. Comparison with observations
The first result is that the relative numbers of young H ii regions/clusters, intermediate and old clusters depend only slightly on the slope of the mass distribution (for the range ). The main factors determining these fractions are the age distribution of the star clusters (that is the age of the oldest clusters), and the adopted form for the IMF and star formation rate. See Sections 5.4 and 5.5 for a discussion on the effects of extinction and cluster destruction.
In Table 5 we summarize the results for a cluster mass distribution with a slope of . The first part of the table are the results for an instantaneous burst, whereas the second part are those for a more extended period of star formation. The model predictions can be compared with the fractions for the complete distributions of NGC 3256 and Arp 299 given in the second part of Table 4.
Inspection of Figures 5 and 6, and taking into account that less massive clusters are more numerous than more massive clusters, shows that the more extended star formation activity of Rieke et al. (1993) models will always produce more coincidences than observed, regardless of the maximum age of the star clusters. This probably indicates that the instantaneous star formation is a better choice to account for the observed properties of star clusters. This seems to be the case for local star clusters where the age spread is at most just a few million years (e.g., Luhman et al. 1998; Palla & Stahler 2000). This is not true in general for the nuclei of interacting galaxies, and regions of high star formation activity (see AAH00 and AAH01) where we have found that more extended periods of star formation are required to explain the observed properties.
Figures 5 and 6 also illustrate the dependence of the cluster luminosity with the model assumptions, which in turn translates into different mass estimates from the observed absolute -band magnitudes. Using the instantaneous star formation and a Salpeter IMF between 1 and we can constrain the masses of the identified star clusters in NGC 3256 and Arp 299 between and . The high end of our photometric masses is in good agreement with the dynamical masses measured by Mengel et al. (2002) for compact young star clusters in the Antennae system.
Another interesting result from our simulations is that the observed relative fractions of young (H ii regions) and old (near-infrared star clusters) populations provide some information on the age spread of the last epoch of star formation. From the statistical point of view our simulations show that most of the detected stellar population in Arp 299 and NGC 3256 shows an age spread of between 20 Myr and 40 Myr, as otherwise we should have measured a higher fraction of old clusters (e.g., for an age distribution of up to 100 Myr this faction is %). Zepf et al. (1999) also deduced young ages for the NGC 3256 star clusters detected in the optical based on the lack of a strong color-luminosity relation. The youth of the detected clusters does not exclude the presence of older clusters possibly created in this or previous episodes of star formation. These clusters however cannot be identified with the present detection threshold.
5.4. Limitations
In this section we discuss some limitations of the comparison between the observed fractions of H ii regions, old clusters and the model predictions.
5.4.1 The effects of extinction
So far we have ignored the effects of extinction in our comparison of observations and models. From detailed studies of obscured Galactic giant H ii regions there is evidence that the extinction to the stars is highly variable with values between and mag (Blum, Damineli, & Conti 1999; Blum, Conti, & Damineli 2000) for the very young H ii regions. If high extinction is present in the H ii regions of LIRGs, then the predicted fractions of H ii regions, coincidences and older star clusters will be affected. Although we have no way derive the extinctions from the current Pa observations, we can obtain some estimates from optical spectroscopy. AAH00 and Lípari et al. (2000) have measured extinctions of up to mag using the Balmer decrement for a few H ii regions in Arp 299 and NGC 3256 respectively. This is equivalent to extinctions at the observed wavelength of Pa of up to mag. The ages of these H ii regions from the observed equivalent widths of H are of between 3 and 6 Myr using Leitherer et al. (1999) models.
Although the measured extinctions are not high enough to compromise the detection of H ii regions at near-infrared wavelengths, we cannot rule out the possibility that very young H ii regions (Myr) suffer from elevated extinctions, even at near-infrared wavelengths. If this were the case, we would be missing the youngest H ii regions, and hence the observed fraction of H ii regions and coincidences will be lower limits. This would in turn translate in even younger age distribution of the detected population of star clusters.
5.4.2 The effects of destruction of clusters
The observed luminosity and mass functions of old globular clusters around galaxies and young star clusters observed in interacting galaxies appear to be distinctively different, with the former having a log-normal shape, and the latter a power law form with no evidence for a turnover (see for instance Elmegreen & Efremov 1997; Whitmore et al. 1999; Zepf et al. 1999). This poses an interesting problem if the clusters observed in galaxies are younger versions of today’s globular clusters. One of the proposed solutions is that the mass distribution of old globular clusters was initially a power law that was later modified by selective destruction of low mass star clusters to become a log-normal like mass function (see Fall & Zhang 2001 for a detailed discussion, and also Whitmore 2000).
Although including a detailed treatment of the problem of cluster destruction is beyond the scope of this paper, we can attempt to see its effects on our calculations. If clusters in Arp 299 and NGC 3256 have been forming at a constant rate for approximately Myr, then of all clusters with masses above should be destroyed during that period to account for the observed fraction of star clusters. Note that Zepf et al. (1999) proposed selective destruction of low mass clusters as one possibility to account for the observed optical colors and luminosities of clusters in NGC 3256 (the other possibility was a very young age for the clusters).
5.4.3 Pa shells
Finally we consider the effects of the formation of Pa shells on the measured number of coincidences. In the Antennae galaxy there is evidence that many of the slightly older, more massive clusters (i.e., 5-10 Myr) have blown large H shells around themselves, hence there is no longer a good correspondence between the distribution of H and the -band center of the cluster (Whitmore et al. 1999). Such Pa shells are diffuse and will not be identified as H ii regions, causing the number of coincidences to be underestimated in the Myr age range. For ages Myr the H ii region emission will not be detected as its luminosity will be below our detection threshold (Section 5.2). The result of missing some coincidences because of the presence of Pa shells would be an age distribution of the clusters slightly younger than inferred in Section 5.3. Note that this effect is only relevant to the most massive clusters in Arp 299 and NGC 3256 where we expect to see coincidences with the present detection threshold.
6. Discussion and Conclusions
In this paper we have presented HST/NICMOS broad-band and narrow-band Pa imaging of a sample of 8 LIRGs. The sample galaxies exhibit a range of infrared luminosities (), as well as a variety of dynamical stages: isolated galaxies interacting galaxies and mergers. The Pa images have allowed us to identify the location of H ii regions, whereas the -band continuum images have revealed the star clusters. In all galaxies in our sample except NGC 6240 and Zw 049.057 we have detected a large number of star clusters and H ii regions. The absolute -band magnitudes of the identified SSCs range up to mag. A large fraction of the H ii region population (excluding the nuclear emission) shows luminosities in excess of that of 30 Doradus, the prototypical giant H ii region.
The main characteristic of the Pa emission in the isolated LIRGs in our sample is the lack of strong nuclear emission. Most of the H ii regions are distributed along the spiral arms of the galaxies. The interacting/merging LIRGs on the other hand, show bright nuclear Pa emission together with widely spread star formation along the the spiral arms and at the interface of interacting galaxies. The fraction of nuclear Pa emission to the total emission varies from system to system, as it depends on factors such as the age of the interaction process, the initial gas content of the galaxies and the relative masses of the galaxies.
We have analyzed the properties – luminosities, sizes and luminosity functions – of H ii regions in LIRGs at an unprecedented spatial resolution (between 15 and 78 pc). Giant H ii regions are ubiquitous in LIRGs and are located not only near the nuclei of interacting galaxies, but also at the interface of interacting galaxies and along the spiral arms. This population of highly luminous H ii regions is not observed in normal galaxies. We have fitted power laws to the H ii region LFs of Arp 299 and NGC 3256 and found that the indices are within the values previously measured in the disks of normal galaxies.
We have compared the properties of the H ii regions in LIRGs with a small sample of normal galaxies observed with the same spatial resolution and found that giant H ii regions are more common in LIRGs than in normal galaxies. The measured sizes of giant H ii regions in LIRGs compared to those in normal galaxies rule out the possibility that the giant H ii regions are just aggregations of “normal” H ii regions. Another possibility would be that all H ii regions in LIRGs were extremely young. However, previously published spectroscopy of a few giant H ii regions in Arp 299 and NGC 3256 has shown a range of equivalent widths of H, in other words, a range of ages. A more plausible explanation for the presence of extremely luminous H ii regions in LIRGs is that the regions of high gas pressure and density present in LIRGs, ULIRGs and interacting galaxies provide the necessary conditions for the formation of a large number of massive star (ionizing) clusters. Such extreme conditions are not likely to occur in normal isolated galaxies.
Despite the large numbers of near-infrared SSCs and H ii regions identified in LIRGs, there is only a small fraction of coincidences – between 4% and 30% of the total number of detected H ii regions and star clusters. This is suggestive of an evolutionary sequence similar to that seen in obscured Galactic giant H ii regions. For the first few million years of the cluster evolution, there will be significant amounts of dust which may preclude the detection of the ionizing cluster. As the cluster ages, stellar winds and supernovae will dissipate part of the gas and dust, and the star cluster will become visible, whereas at the same time the H ii region emission will be less luminous.
We have used evolutionary synthesis models to reproduce the observed relative fractions of young and intermediate H ii regions/clusters and old clusters in Arp 299 and NGC 3256. Based on the observed fractions we have concluded that most likely the star formation occurs in instantaneous bursts rather than more extended periods of star formation. Using instantaneous star formation and a Salpeter IMF we have derived photometric masses of the detected star clusters of between and .
The fact that the peak of the -band luminosity occurs after approximately 9 Myr whereas at the same time the number of ionizing photons has dropped by about two orders of magnitudes from the maximum explains the limited number of coincidences. Within the present detection limits in Arp 299 and NGC 3256, we can only detect both H ii region emission and a star cluster for the most massive clusters () during the first 7 Myr. The near-infrared clusters with no detected H ii region emission will be older than approximately 7 Myr. The H ii regions with no detected cluster counterpart are most likely younger than 5 Myr, and have intermediate mass () ionizing clusters. If, as observed in obscured Galactic H ii regions, there are significant amounts of extinction during the first million years of the evolution of clusters and H ii regions, then we may be missing the youngest star forming regions, and hence the observed fractions of H ii regions and coincidences will be lower limits.
An estimate of the age distribution of the observed clusters can be inferred from the relative numbers of H ii regions, and near-infrared star clusters: the higher the fraction of near-infrared clusters, the older the ages of the detected star clusters will be. We find that the ages of the detected star clusters in Arp 299 and NGC 3256 range up to Myr. Older clusters possibly created in this or previous episodes of star formation are likely to exist in these systems but cannot be identified with the present detection threshold. Another possibility to explain the apparent youth of the clusters in Arp 299 and NGC 3256 would be destruction of clusters. In that case, if the clusters have been created at a constant rate for the last Myr, then roughly 50% of the clusters are destroyed during that time to account for the observed fraction of clusters in these two systems. The data presented in this paper does not allow us to distinguish between these two possibilities.
From the present observations and modelling it is clear that a large population of the youngest clusters (that is the ionizing clusters of the H ii regions with ages of Myr) will not be detected from near-infrared continuum imaging alone, as only some of these H ii regions in our sample of LIRGs (both isolated and interacting/merging systems) appear to have near-infrared cluster counterparts. This suggests that studies of the young star clusters in galaxies performed using only near-infrared continuum imaging may be biased against the youngest star forming regions, which may account for up to of the detected population of star clusters and H ii regions in LIRGs.
Acknowledgments
It is a pleasure to thank Valentin Ivanov and John Black for enlightening discussions on the paper. We are also grateful to an anonymous referee for helpful comments, which resulted in an improved paper.
This work has been partially supported by the National Aeronautics and Space Administration grant NAG 5-3042 through the University of Arizona and Contract 960785 through the Jet Propulsion Laboratory.
This research has made use of the NASA/IPAC Extragalactic Database (NED) which is operated by the Jet Propulsion Laboratory, California Institute of Technology, under contract with the National Aeronautics and Space Administration.
References
- (1) Alonso-Herrero, A., Rieke, G. H., Rieke, M. J., & Scoville N. Z. 2000, ApJ, 532, 845 (AAH00)
- (2) Alonso-Herrero, A., Engelbracht, C. W., Rieke, M. J., Rieke, G. H., & Quillen, A. C. 2001a, ApJ, 546, 952 (AAH01)
- (3) Alonso-Herrero, A., Ryder, S. D., & Knapen, J. H., 2001b, MNRAS, 322, 757
- (4) Alonso-Herrero, A., & Knapen, J. H. 2001, AJ, 122, 1350
- (5) Bekki, K., & Couch, W. J. 2001, ApJ, 557, L19
- (6) Blum, R. D., Damineli, A., & Conti, P. S. 1999, AJ, 117, 1392
- (7) Blum, R. D., Conti, P. S., & Damineli, A. 2000, AJ, 119, 1860
- (8) Blum, R. D., Conti, P. S., Damineli, A., & Figuerêdo, E. 2001, in Hot Star Workshop III: The Earliest Phases of Massive Star Birth, ASP Conference Series, ed. P. A. Crowther, in press (astro-ph/0110405)
- (9) Böker, T. et al., 1999, ApJS, 124, 95
- (10) Doyon, R., Nadeau, D., Joseph, R. D., Goldader, J. D., Sanders, D. B., & Rowlands, N. 1995, ApJ, 450, 111
- (11) Elmegreen, B. G., & Efremov, Y. N. 1997, ApJ, 480, 235
- (12) Fall, S. M., & Zhang, Q. 2001, ApJ, 561, 751
- (13) Gallagher, S. C., Charlton, J. C., Hunsberger, S. D., Zaritsky, D., & Whitmore, B. C. 2001, AJ, 122, 163
- (14) Gerssen, J., van der Marel, R. P., Axon, D., Mihos, C., Hernquist, L., & Barnes, J. E. 2001, in The Central kpc of Starbursts and AGN, ASP Conference Series, eds. J. H. Knapen et al., Vol. 249, p. 665
- (15) Goldader, J. D., Joseph, R. D., Doyon, R., & Sanders, D. B. 1997, ApJS, 108, 449
- (16) Ivison, R. J., Smail, I., Barger, A. J., Kneib, J.-P., Blain, A. W., Owen, F. N., Kerr, T. H., & Cowie, L. L. 2000, MNRAS, 315, 209
- (17) Kennicutt, R. C. Jr., Edgar, B. K., & Hodge, P. W. 1989, ApJ, 337, 761
- (18) Leitherer, C., Schaerer, D., Goldader, J. D., González-Delgado, M. R., Robert, C., Kune, D. F., de Mello, D. F., Devost, D., & Heckman, T. M. 1999, ApJS, 123, 3
- (19) Lípari, S., Díaz, R., Taniguchi, Y., Terlevich, R., Dottori, H., & Carranza, G. 2000, AJ, 120, 645
- (20) Luhman, K. L., Rieke, G. H., Lada, C. J., & Lada, E. A. 1998, ApJ, 508, 347
- (21) Maoz, D., Barth, A. J., Ho, L. C., Sternberg, A., & Filippenko, A. V. 2001, AJ, 121, 3048
- (22) McLeod, B. 1997, in Proc. STScI Symp., The HST Calibration Workshop, ed. S. Casertano, R. Jederzejewski, C. D. Keyes, & M. Stevens (Baltimore: STSciI), 281
- (23) Mengel, S., Lehnert, M. D., Thatte, N., Tacconi-Garman, L. W., & Genzel, R. 2001, ApJ, 550, 280
- (24) Mengel, S., Lehnert, M. D., Thatte, N., & Genzel, R. 2002, A&A, 383, 137
- (25) Murphy, T. W., Soifer, B. T., Matthews, K., & Armus, L. 2001, ApJ, 559, 201
- (26) Oey, M. S., & Clarke, C. J. 1998, AJ, 115, 1543
- (27) Palla, F., & Stahler, S. W. 2000, ApJ, 540, 255
- (28) Pleuss, P. O., Heller, C. H., & Fricke, K. J. 2000, A&A, 361, 913
- (29) Rand R. J. 1992, AJ, 103, 815
- (30) Rieke, G. H. & Low, F. 1972, ApJ, 176, L95
- (31) Rieke, G. H., Loken, K., Rieke, M. J., & Tamblyn, P. 1993, ApJ, 412, 99
- (32) Rudnick, G., Rix, H.-W., & Kennicutt, R. C. Jr. 2000, ApJ, 536, 569
- (33) Sanders, D. B., & Mirabel, I. F. 1996, ARA&A, 34, 749
- (34) Schweizer, F., Miller, B. W., Whitmore, B. C., & Fall, S. M. 1996, AJ, 112, 1839
- (35) Scoville, N. Z. et al. 2000, AJ, 119, 991
- (36) Soifer, B. T., Neugebauer, G. Matthews, K., Egami, E., Weinberger, A. J., Ressler, M., Scoville, N. Z., Stolovy, S. R., Condon, J. J., & Becklin, E. E. 2001, AJ, 122, 1213
- (37) Tan, J. C., & McKee, C. F. 2000, in Starbursts: Near and Far, ASP Conf Series, in press (astro-ph/0012005)
- (38) Whitmore, B. C., Schweizer, F., Leitherer, C., Borne, K., & Robert, C. 1993, AJ, 106, 1354
- (39) Whitmore, B., & Schweizer, F. 1995, AJ, 109, 960
- (40) Whitmore, B. C., Zhang, Q., Leitherer, C., Fall, S. M., Schweizer, F., & Miller, B. W. 1999, AJ, 118, 1551
- (41) Whitmore, B. 2000, in STScI Symposium Series 14 (ed. M. Livio) (astro-ph/0012546)
- (42) Zepf, S. E., Ashman, K. M., English, J., Freeman, K. C., & Sharples, R. M. 1999, AJ, 118, 752
- (43) Zhang, Q., & Fall, S. M. 1999, ApJ, 527, L81