GRB 011121: A Massive Star Progenitor
Abstract
Of the cosmological gamma-ray bursts, GRB 011121 has the lowest redshift, . More importantly, the multi-color excess in the afterglow detected in the Hubble Space Telescope (HST) light curves is compelling observational evidence for an underlying supernova. Here we present near-infrared and radio observations of the afterglow. We undertake a comprehensive modeling of these observations and those reported in the literature and find good evidence favoring a wind-fed circumburst medium. In detail, we infer the progenitor had a mass loss rate of where is the speed of the wind from the progenitor in units of km s-1. This mass loss rate is similar to that inferred for the progenitor of SN 1998bw which has been associated with GRB 980425. Our data, taken in conjunction with the HST results of Bloom et al. (2002), provide a consistent picture: the long duration GRB 011121 had a massive star progenitor which exploded as a supernova at about the same time as the GRB event.
1 Introduction
On 2001 November 21 at 18:47:21 UT, GRB 011121 was detected and localized by the Italian-Dutch satellite BeppoSAX (Piro, 2001). The localization was further improved by the InterPlanetary Network (Hurley et al., 2001) and an optical transient was identified by the OGLE group (Wyrzykowski, Stanek & Garnavich, 2001). Spectroscopy of the transient revealed emission lines interpreted as arising from the host galaxy at a redshift of (Infante et al., 2001).
Low redshift GRBs are particularly valuable in uncovering the origin of GRBs. If GRBs result from the death of massive stars then it is reasonable to expect an underlying supernova (SN). Bloom et al. (1999) attributed a late-time red excess seen in the afterglow emission of GRB 980326 to an underlying SN. This result triggered searches for similar excesses with no clear success save GRB 970228 (Reichart, 1999; Galama et al., 2000). The low redshift is critical to such searches since the SN contribution is expected to exhibit strong absorption below 4000 Å (see Bloom et al. 1999).
Given this motivation, we triggered a sequence of multi-color and multi-epoch Wide Field and Planetary Camera 2 (WFPC-2) observations with the Hubble Space Telescope (HST). Garnavich et al. (2002) noted that the -band flux of the first epoch of the HST observations was significantly in excess of the extrapolation of the power law decay of the early ground-based optical afterglow and attributed this to an underlying SN component. In Paper I (Bloom et al. 2002) we presented four-epoch multi-color HST light curves and show the data are explained by an underlying SN similar to SN 1998bw (Galama et al., 1998) except fainter by about 2/3 magnitude. At this point, there appears to be compelling evidence for GRB 011121 to be associated with a SN which exploded at about the same time as the gamma-ray event (Bloom et al., 2002).
This GRB-SN link is an essential expectation in the collapsar model (Woosley, 1993) in which GRBs result from the death of certain massive stars. Another essential consequence of any massive star origin for GRBs, as noted by Chevalier & Li (1999), is a circumburst medium fed by the inevitable and copious mass loss suffered by massive stars throughout their lives. Afterglow observations are excellently suited to determining not only the geometry of the explosion but also the distribution of circumburst matter. Unfortunately, until now there has been no clear evidence for a wind-fed circumburst medium (density, with ; here is the distance from the explosion site) in the afterglow of any cosmologically located GRB.
Here we report near-infrared (NIR) and radio observations of the afterglow of GRB 011121. We undertake afterglow modeling of this important event and to our delight have found a good case for a wind-fed circumburst medium. Thus, the totality of the data — the HST optical lightcurves and multi-wavelength (radio, NIR, and optical) data — now support a massive star origin for this GRB.
2 Observations
Gamma-Rays: GRB 011121 was observed by numerous spacecraft in the InterPlanetary Network: Ulysses, BeppoSAX (GRBM), HETE-2 (FREGATE), Mars Odyssey (HEND) and Konus-Wind. The duration, as determined from the Ulysses data, was 28 s, placing this event in the class of ”long bursts” (Figure 1). The peak flux in the 25–100 keV range, over 0.25 s, was erg cm-2 s-1, and the fluence was erg cm2.
Near-Infrared: We observed the afterglow in the near-infrared with the newly-commissioned IRIS2 on the Anglo-Australian Telescope (AAT), WFIRC on the du Pont 2.5-m telescope and the IRCam on the Walter Baade 6.5-m telescope in and filters. The images were dark-subtracted, flat-fielded, sky-subtracted and combined using DIMSUM (Eisenhardt et al., 1999) in IRAF. PSF-fitting photometry of the afterglow using DAOPHOT (Stetson, 1987) was performed relative to point sources in the field. Our multiple calibrations are consistent with each other and we estimate the systematic error to be less than 0.05 mag (see Table. 1).
Radio: We initiated observations of GRB 011121 with the Australia Telescope Compact Array (ATCA) starting on 2001 November 22.58 UT (see Table 2). The data were reduced and imaged using the Multichannel Image Reconstruction, Image Analysis and Display (MIRIAD) software package.
3 Modeling the Afterglow
3.1 Dust Extinction
In Figure 2 we display the optical/NIR spectrum of GRB 011121. The apparent curvature in the spectrum indicates a large magnitude of dust extinction. In view of this, estimating the dust extinction accurately is critical not only for the afterglow modeling but also as an important input parameter for the supernova modeling of the HST lightcurves (Bloom et al., 2002).
From the IR dust maps (Schlegel, Finkbeiner & Davis, 1998) we estimate mag. However, the IR maps have low angular resolution. Indeed, it appears that the line-of-sight to the afterglow passes through the edge of a dust cloud arcmin in extent. Fortunately, the availability of both the optical and NIR afterglow data allow us to directly estimate the extinction along this line of sight directly.
We make the reasonable assumption that the optical/NIR afterglow follows the standard power-law model, , and we apply the parametric extinction curves of Cardelli, Clayton & Mathis (1989) and Fitzpatrick & Massa (1988) along with the interpolation suggested by Reichart (2001). Thanks to the abundance of our NIR data, which suffers little extinction, we can break the degeneracy between and the magnitude of the extinction, .
In addition to our own measurements we have included those reported in the literature (and noted in Figure 2). Since late-time measurements are increasingly dominated by an uncertain mix of the afterglow, the host galaxy and the nearby star B (Bloom et al., 2002) we restrict the analysis to data obtained over the first two days.
Our best fit has an unacceptable = 66 for 48 degrees of freedom, but this is mainly dominated by outliers, particularly in the data from the AAT where the seeing blended star B with the afterglow in some observations. Inserting an additional 3% error decreases the to match the number of degrees of freedom. The additional error term, while ad hoc, is reasonable given the variety of telescopes and reduction techniques in our data set.
Our measured extinction is mag, distinctly lower than that deduced from the dust maps. The type of extinction curve (e.g., Milky Way, LMC, SMC etc.) is unconstrained by these observations. We have not solved for extinction within the host galaxy, but the off-center location of the GRB (Bloom et al., 2002) makes it likely that the contribution from extinction within the host galaxy is small. Finally, we measure and , without assuming any specific afterglow model.
3.2 Afterlow Models
Armed with and we now consider three afterglow models: (i) isotropic expansion into a homogeneous medium (Sari, Piran & Narayan, 1998), (ii) isotropic expansion into a wind-stratified medium (Chevalier & Li, 1999), and (iii) collimated expansion into a homogeneous or wind-stratified medium (Sari, Piran & Halpern, 1999). The models can be distinguished by a closure relation, . These closure relations are due to the dependence of both and on the electron energy distribution index, , and the values of and depend on the location of the cooling frequency, , relative to the optical/NIR frequency, , at the epoch of the observations.
As can be seen from Table 3, models with isotropic expansion into an homogeneous medium (or, equivalently, a jet which becomes apparent on a timescale longer than the epochs of the optical/NIR data used here, d) are ruled out by the closure relations at more than significance. Two models produce closure consistent with zero: (A) A wind model with (effective epoch day 1), and ; and (B) A fully developed jet at the time of the first optical observation, d, with and .
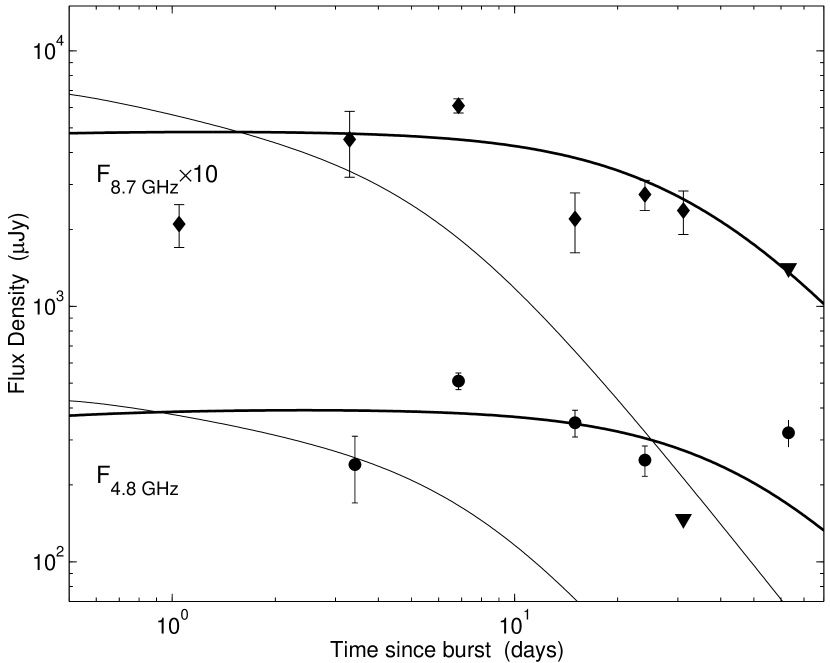
The radio measurements, however, do not show any sign of a decay until at least days after the burst (Figure 3). The rising centimeter-band flux prior to this time indicates that the jet break is not at early times, and hence model B, the jet model, is ruled out. This then leaves us with model A, the wind model.
3.3 A Wind Model
The multi-wavelength data, radio through optical, can only be analyzed by considering the evolution of the broad-band synchrotron spectrum. In addition to , and we need to consider the self-absorption frequency, , and the peak frequency, , as well as the peak flux, . These parameters are estimated from the data and can be inverted to yield physical quantities, i.e. the energy of the fireball, the density of the ambient medium, and the fractions of energy in the electrons, , and magnetic field, . An example of this approach can be found in Berger et al. (2001). The density in the wind model is parameterized by , which is defined through g/cm (see Chevalier & Li 1999) where is the wind speed and is the mass loss rate. The normalization of applies for a typical Wolf-Rayet wind speed of km/sec and M⊙/yr.
Given the sparse data we prefer to undertake the model fitting in an evolutionary approach rather than performing a blind minimization search. For example, we fix the value of and to that determined earlier since the radio data has little bearing on these parameters. Next, we know that , but there are no data in the X-ray band to actually constrain the value of . We therefore use Hz since this is effectively the lowest value the cooling frequency can have in this model. We will, at a later point, revisit this issue and examine the consequences of increasing .
The remaining free parameters111Unless otherwise stated, all time-dependent parameters are evaluated at epoch 1 day e.g. ., , , and are relatively easy to constrain for the following reasons. The value of determines the overall scaling in both the optical/NIR and radio bands, and is therefore constrained by two sets of data. The value of is constrained by the turnover in the radio lightcurves (at days; see Figure 3), as well as the flux density of the optical/NIR lightcurves, since for a given value of , the flux density in the optical/NIR band is determined by .
Finally, is constrained by the spectral slope between the two centimeter bands. The comparable flux between 4.8 and 8.7 GHz suggests that . An independent constraint on is also provided by the equation due to Sari & Esin (2001):
| (1) |
where is the fraction of the electron energy radiated away.
We find mJy, Hz, Hz, GHz and provide an adequate description of the afterglow data. From these parameters we obtain and that inverse Compton cooling is marginally important. Higher values of are possible in the inverse Compton-dominated regime and if , implying that is well below the centimeter bands. With these observations, we are unable to constrain such a model.
4 Discussion & Conclusions
GRB 011121, a relatively nearby burst (), has shot to fame given what appears to be firm identification of an underlying supernova component (Bloom et al., 2002). Here we presented early time NIR and comprehensive dual-frequency cm-wave observations of the afterglow. Thanks to the NIR data, we have been able to accurately measure the considerable Galactic extinction towards the burst, mag, significantly smaller than that derived from extrapolations of the IR maps (Schlegel, Finkbeiner & Davis, 1998). Our value of is an important physical parameter in the modeling of the underlying SN component (Bloom et al., 2002).
If indeed long duration gamma-ray events such as GRB 011121 are linked to SNe then the progenitors of GRBs are massive stars. Such stars possess strong winds and one expects to see a signature of the wind-fed circumburst medium (Chevalier & Li, 1999). The optical/NIR data alone rule out an isotropic explosion in a constant circumburst medium model. The radio data firmly rule out a model in which a jet is fully-developed at d, but allow for a wind-fed circumburst medium. We estimate the mass loss rate, where is the wind speed in units of km s-1. In the collapsar model (MacFadyen, Woosley & Heger, 2001), one expects the progenitors of GRBs to be massive stars which have lost their hydrogen envelopes, i.e. Wolf-Rayet stars. For such stars, km s-1.
Interestingly enough, this mass loss rate is similar to that inferred for the progenitor of the Type Ic SN 1998bw, M⊙ yr-1 (Li & Chevalier, 1999), based on the analysis of the radio light curves (Kulkarni et al., 1998). This unusual SN is thought to be associated with GRB 980425 based on spatial and temporal coincidence (Galama et al., 1998), as well as its relativistic outflows (Kulkarni et al., 1998). However, this GRB, if associated with SN 1998bw (as we believe), releases at least three orders of magnitude less energy in gamma-rays compared to cosmological bursts (Galama et al., 1998) such as GRB 011121. So the relation of GRB 980425 to cosmologically located GRBs is unclear. Nonetheless, we make the following curious observation: the -ray profile (Figure 1) is of similar duration and smoothness (with a few spikes superposed) as that of GRB 980425.
The current data clearly rule out a jet break on the timescale of the optical data, d, and the radio data require d. In the formulation of Frail et al. (2001) the opening angle of the jet must be wider than degrees and hence the true energy release is larger than erg. This lower limit is consistent with the the clustering of energies around erg found by Frail et al. (2001).
Further improvements to the modeling is possible by including the BeppoSAX measurement of the X-ray afterglow (Piro et al., 2001); the X-ray flux will pin down quite well. We also note that the radio fluxes given in Table 2 suffer from strong variability (due to interstellar scintillation). Here we have used the mean fluxes, and in a later paper we intend to report detailed analysis of the scintillation and include the variability as a part of our afterglow modeling, in particular as a way to constrain the size of the afterglow region (c.f. Frail et al. 1997).
Thus, at least for one long duration burst the SN-GRB connection and a massive progenitor origin appears to to have been established. However, the true story may be more complex. The absence of SN components in other GRBs can be explained by appealing to the well known wide diversity in luminosity of Type Ib/c SNe. However, some of the intensively observed afterglows are best modeled by expansion into a homogeneous medium. There could well be two different classes of progenitors within the class of long-duration GRBs (Chevalier & Li, 2000).
References
- Berger et al. (2001) Berger, E. et al. 2001, ApJ, 556, 556.
- Bloom et al. (1999) Bloom, J. S. et al. 1999, Nature, 401, 453.
- Bloom et al. (2002) Bloom, J. S., Kulkarni, S. R., Price, P. A., Reichart, D. E., et al. 2002, ApJ (submitted), astro-ph/0203391.
- Cardelli, Clayton & Mathis (1989) Cardelli, J. A., Clayton, G. C., and Mathis, J. S. 1989, ApJ, 345, 245.
- Chevalier & Li (2000) Chevalier, R. A. and Li, Z. 2000, ApJ, 536, 195.
- Chevalier & Li (1999) Chevalier, R. A. and Li, Z.-Y. 1999, ApJ, 520, L29.
- Eisenhardt et al. (1999) Eisenhardt, P., Dickinson, M., Standford, S., Ward, J., and Valdes, F. 1999, http://iraf.noao.edu/iraf/ftp/contrib/dimsumV2/dimsum.readme.
- Fitzpatrick & Massa (1988) Fitzpatrick, E. L. and Massa, D. 1988, ApJ, 328, 734.
- Frail et al. (1997) Frail, D. A., Kulkarni, S. R., Nicastro, S. R., Feroci, M., and Taylor, G. B. 1997, Nature, 389, 261.
- Frail et al. (2001) Frail, D. A. et al. 2001, ApJ, 562, L55.
- Galama et al. (2000) Galama, T. J. et al. 2000, ApJ, 536, 185.
- Galama et al. (1998) Galama, T. J. et al. 1998, Nature, 395, 670.
- Garnavich et al. (2002) Garnavich, P. M., Holland, S. T., Jha, S., Kirshner, R. P., Bersier, D., and Z., S. K. 2002, GCN Circular 1273.
- Hawarden et al. (2001) Hawarden, T. G., Leggett, S. K., Letawsky, M. B., Ballantyne, D. R., and Casali, M. M. 2001, MNRAS, 325, 563.
- Hurley et al. (2001) Hurley, K., Cline, T., Guidorzi, C., Montanari, E., Frontera, F., and Feroci, M. 2001, GCN Circular 1148.
- Infante et al. (2001) Infante, L., Garnavich, P. M., Stanek, K. Z., and Wyrzykowski, L. 2001, GCN notice 1152.
- Kulkarni et al. (1998) Kulkarni, S. R. et al. 1998, Nature, 395, 663.
- Li & Chevalier (1999) Li, Z. and Chevalier, R. A. 1999, ApJ, 526, 716.
- MacFadyen, Woosley & Heger (2001) MacFadyen, A. I., Woosley, S. E., and Heger, A. 2001, apj, 550, 410.
- Olsen et al. (2001) Olsen, K., Brown, M., Schommer, R., and Stubbs, C. 2001, GCN Circular 1157.
- Persson, S. E. and Murphy, D. C. and Krzeminski, W. and Roth, M. and Rieke, M. J. (1998) Persson, S. E. and Murphy, D. C. and Krzeminski, W. and Roth, M. and Rieke, M. J. 1998, AJ, 116, 2475.
- Phillips et al. (2001) Phillips, M., Krisciunas, K., Garnavich, P., Holland, S., Jha, S., Stanek, K. Z., and McCarthy, P. 2001, GCN Circular 1164.
- Piro (2001) Piro, L. 2001, GCN Circular 1147.
- Piro et al. (2001) Piro, L. et al. 2001, GCN 1172.
- Reichart (1999) Reichart, D. E. 1999, ApJ, 521, L111.
- Reichart (2001) Reichart, D. E. 2001, ApJ, 553, 235.
- Sari & Esin (2001) Sari, R. and Esin, A. A. 2001, apj, 548, 787.
- Sari, Piran & Halpern (1999) Sari, R., Piran, T., and Halpern, J. P. 1999, ApJ, 519, L17.
- Sari, Piran & Narayan (1998) Sari, R., Piran, T., and Narayan, R. 1998, ApJ, 497, L17.
- Schlegel, Finkbeiner & Davis (1998) Schlegel, D. J., Finkbeiner, D. P., and Davis, M. 1998, ApJ, 500, 525.
- Stanek & Wyrzykowski (2001) Stanek, K. Z. and Wyrzykowski, L. 2001, GCN Circular 1160.
- Stetson (1987) Stetson, P. B. 1987, PASP, 99, 191.
- Woosley (1993) Woosley, S. E. 1993, ApJ, 405, 273.
- Wyrzykowski, Stanek & Garnavich (2001) Wyrzykowski, L., Stanek, K. Z., and Garnavich, P. M. 2001, GCN notice 1150.
| Date (2001 UT) | Filter | Magnitude | Telescope |
|---|---|---|---|
| Nov 22.3560 | 17.852 0.045 | dP | |
| Nov 22.3573 | 17.730 0.037 | dP | |
| Nov 22.3587 | 17.763 0.044 | dP | |
| Nov 22.3600 | 17.801 0.040 | dP | |
| Nov 22.3614 | 17.821 0.037 | dP | |
| Nov 22.3627 | 17.799 0.039 | dP | |
| Nov 22.3641 | 17.785 0.035 | dP | |
| Nov 22.3654 | 17.770 0.036 | dP | |
| Nov 22.3667 | 17.795 0.041 | dP | |
| Nov 22.3681 | 17.739 0.038 | dP | |
| Nov 22.7177 | 18.352 0.100 | AAT | |
| Nov 23.3193 | 19.463 0.068 | dP | |
| Nov 28.5 | 21.291 0.282 | Baade | |
| Nov 22.3178 | 15.959 0.045 | dP | |
| Nov 22.3194 | 15.987 0.040 | dP | |
| Nov 22.3211 | 15.908 0.037 | dP | |
| Nov 22.3227 | 15.994 0.040 | dP | |
| Nov 22.3244 | 15.958 0.040 | dP | |
| Nov 22.3263 | 16.002 0.041 | dP | |
| Nov 22.3279 | 16.006 0.041 | dP | |
| Nov 22.3296 | 16.003 0.039 | dP | |
| Nov 22.3296 | 16.003 0.039 | dP | |
| Nov 22.3313 | 15.981 0.037 | dP | |
| Nov 22.3329 | 16.053 0.039 | dP | |
| Nov 22.3349 | 16.039 0.040 | dP | |
| Nov 22.3365 | 15.997 0.039 | dP | |
| Nov 22.3382 | 16.120 0.041 | dP | |
| Nov 22.3398 | 15.996 0.063 | dP | |
| Nov 22.3454 | 16.027 0.038 | dP | |
| Nov 22.3470 | 16.069 0.036 | dP | |
| Nov 22.3487 | 16.100 0.042 | dP | |
| Nov 22.3503 | 16.015 0.043 | dP | |
| Nov 22.3520 | 16.098 0.043 | dP | |
| Nov 22.4771 | 16.421 0.041 | AAT | |
| Nov 22.4954 | 16.537 0.041 | AAT | |
| Nov 22.5126 | 16.495 0.035 | AAT | |
| Nov 22.6066 | 16.605 0.058 | AAT | |
| Nov 22.6169 | 16.788 0.042 | AAT | |
| Nov 22.6397 | 16.782 0.038 | AAT | |
| Nov 22.6506 | 16.862 0.036 | AAT | |
| Nov 22.6612 | 17.019 0.052 | AAT | |
| Nov 22.6716 | 16.852 0.039 | AAT | |
| Nov 22.6822 | 17.035 0.083 | AAT | |
| Nov 22.7272 | 17.005 0.051 | AAT | |
| Nov 22.7384 | 17.087 0.079 | AAT | |
| Nov 23.3336 | 17.924 0.051 | dP | |
| Nov 28.7092 | 19.346 0.234 | AAT |
Note. — (a) Observations at the du Pont (dP) 2.5-m were made by K. Koviak; observations at the AAT were made by S.D. Ryder (Nov 22) and K. Gunn (Nov 28); observations at the Baade telescope were made by M. Phillips. (b) The following reference stars were used. For observations on the AAT we observed UKIRT Faint Standards FS 7, 11 and 13 (Hawarden et al., 2001) on 2001 Nov. 28. SJ9113 (Persson, S. E. and Murphy, D. C. and Krzeminski, W. and Roth, M. and Rieke, M. J., 1998) was observed at the du Pont telescope on 2001 Nov. 23. We assumed an atmospheric extinction coefficient of 0.09 mag/airmass in for the du Pont observations, and that the colour terms were negligible. We used the reference stars calibrated by Phillips et al. (2001) to calibrate our -band observations. (c) The AAT measurement of Nov. 28th is contaminated both by the host and the nearby star.
| Epoch | S | |
|---|---|---|
| (UT) | (GHz) | (Jy) |
| 2001 Nov 25.20 | 4.80 | 240 70 |
| 2001 Nov 28.64 | 4.80 | 510 38 |
| 2001 Dec 6.80 | 4.80 | 350 42 |
| 2001 Dec 15.80 | 4.80 | 250 34 |
| 2001 Dec 22.90 | 4.80 | -99 49 |
| 2002 Jan 23.85 | 4.80 | 320 38 |
| 2001 Nov 22.83 | 8.70 | 210 40 |
| 2001 Nov 25.08 | 8.70 | 450 130 |
| 2001 Nov 28.64 | 8.70 | 610 39 |
| 2001 Dec 6.80 | 8.70 | 220 58 |
| 2001 Dec 15.80 | 8.70 | 274 37 |
| 2001 Dec 22.90 | 8.70 | 237 46 |
| 2002 Jan 23.85 | 8.70 | -99 47 |
Note. — The columns are (left to right), UT date of the start of each observation, center frequency, and peak flux density at the best fit position of the radio transient, with the error given as the root mean square noise on the image. All observations were obtained using the continuum mode and a 128 MHz bandwidth. Flux calibration was performed using PKS B1934638, while the phase was monitored using PKS B1057797.
| Model | Closure | |||
|---|---|---|---|---|
| ISM | B | |||
| ISM | R | |||
| Wind | B | |||
| Wind | R | |||
| Jet | B | |||
| Jet | R |
Note. — Calculation of the closure relations for a variety of afterglow models. A successful model will have a value of zero for the closure relation. The ISM and Wind models are for isotropic expansion in an homogeneous and wind-stratified medium respectively. The Jet model is for collimated expansion, with the jet break time before the first observations were made. The relations are dependent on the assumed location of the cooling frequency, relative to the optical and NIR bands, : the case is denoted by “B”(for blueward) and by “R” (for redward). is the electron energy power law index.