Radiation Driven Implosion of Molecular Cloud Cores
Abstract
We present the first three-dimensional calculations of Radiation Driven Implosion of Molecular Clouds including self-gravity and ionization. We discuss the effects of initial density perturbations on the dynamics of ionizing globules and show that the onset of gravitational collapse can be significantly delayed for a multiple of the implosion timescale. We demonstrate that Radiation Driven Implosion could be an efficient process for injecting disordered kinetic energy into molecular clouds in the vicinity of massive stars.
keywords:
Stars: massive – Hii regions1 Introduction
Massive stars have a strong impact on the evolution of their parental molecular clouds (MCs). Their fast winds and their ionizing radiation cause an important feedback of energy and momentum into the circumstellar environment.
One of the most interesting effects massive stars could have on MCs is “sequential star formation” [Elmegreen & Lada 1977]. When massive stars heat their environment to equilibrium temperatures 10 000 K via their ionizing UV radiation, the ionized region is divided from the surrounding molecular gas by a very thin transition layer called ’ionization front’. Due to the high pressure in the hot, ionized gas, a shock front is driven into the cooler molecular gas which sweeps up a thin, dense layer of shocked material between it and the ionization front. This layer is likely to be gravitationally unstable and thus may form a new generation of stars on timescales of several million years.
Molecular clouds are highly irregular, with observed structures from large scales down to even the smallest observable scales. There is ongoing debate whether the morphology of molecular clouds can be described by a fractal. Broad linewidths in molecular clouds also suggest irregular supersonic motion, which indicates the presence of turbulence. In the presence of ionizing radiation, theoretical models predict that density enhancements will likely be excavated by the ionization front [Elmegreen, Kimura & Tosa 1995]. They will subsequently protrude into the ionized gas, and are directly exposed to the ionizing radiation.
The dynamical behaviour (Radiation Driven Implosion, RDI) in such exposed globules was studied numerically by Sandford, Whitaker & Klein [Sandford, Whitaker & Klein 1982, Sandford, Whitaker & Klein 1984], who pointed out that the mass distribution of stars formed in a perturbed molecular cloud affected by RDI may sensitively depend on the spatial scales of the perturbations. A similar approach was followed by Lefloch & Lazareff [Lefloch & Lazareff 1994]. In their models, the time evolution can be subdivided into two stages: the implosion phase, lasting for about 100 kyrs, and, if gravitationally stable, a subsequent quiet, quasi-static cometary phase, in which the globule is slowly eroded by ionization on timescales of several Myrs. Through semi-analytical models, Bertoldi [Bertoldi 1989] and Bertoldi & McKee [Bertoldi & McKee 1990] constrained the ranges for mass and ionizing flux in which gravitational instability in the compressed globules should be expected. More recently, Hollenbach & Bally (1998) and López-Martin et al. (2001) investigated the photoevaporation of dense clumps of gas by an external source. The hydrodynamics of photoionized columns in the Eagle Nebula has been modeled by Williams et al. (2001).
Sugitani, Tamura & Ogura [Sugitani et al. 1999, Sugitani et al. 2000] observed a sample of 89 bright-rimmed clouds (BRCs), apparently objects with properties as mentioned above, and found an excess in the luminosities and luminosity-to-cloud ratios of embedded IRAS sources when compared to sources in isolated globules, which is an indication for enhanced star formation in their BRCs. Near-IR imaging of 44 BRCs revealed that young stellar objects seem to be aligned along the axis towards the ionizing cluster. There is even evidence for an age gradient with older stellar objects closer to the OB cluster and the youngest objects well inside the globules, aligned with the IRAS sources. This result is consistent with sequential star formation while the shock front advances further and further into the molecular cloud.
The interplay between dynamics and self-gravity in exposed globules has not yet been treated in detail. Using the new, fast SPHI method described in Kessel & Burkert [Kessel-Deynet & Burkert 2000], we present 3D calculations of imploding clumps including self-gravity. We find evidence that initial small-scale density perturbations can lead to a substantial stabilization against gravitational collapse during the implosion phase and the subsequent cometary phase, even if the parameters of the globules suggest them to be highly unstable according to the analytical estimations of Bertoldi & McKee [Bertoldi & McKee 1990].
2 Initial conditions
2.1 Density distribution
The initial conditions are static solutions to the equation of Emden [Emden 1907], called “Bonnor-Ebert spheres” [Bonnor 1956]. In these spheres, which are supported by an external pressure at the truncation radius , the gravitational force is everywhere balanced by the pressure gradient, which is vanishing at the center. The scale-free form of the differential equation describing this situation is
| (1) |
The relation between the parameters and on the one hand and physical quantities density and radius on the other hand is given by
where is the maximum density for and
is the temperature of the isothermal gas. Here, is Boltzmann’s Constant, the Gravitational Constant and the mean molecular weight.
Stability analysis shows that there is a critical value for the truncation radius of the sphere. Below , the sphere is stable against radial density perturbations. Above, it commences gravitational collapse on a few gravitational timescales if perturbed. At , the sphere contains about one Jeans mass of matter, and the density contrast from the center to the pressure boundary is . Since we don’t expect such supercritical cores to survive long enough in molecular clouds to be influenced by ionizing radiation in relevant number, we instead restrict ourselves to the critical case with the truncation radius . This enables us to study whether compression by ionizing radiation can force one initial Jeans mass into gravitational collapse. If not, we can conclude that induced collapse for cases with masses less than a Jeans mass should also be highly improbable. Additional simulations of initially Jeans-stable clumps with will be studied in a subsequent paper.
The maximum particle density of H atoms in the cores is assumed to be and the equilibrium temperature in the neutral cloud material to mimic the typical conditions observed in molecular clouds.
The integration volume has the shape of a cube, which contains the Bonnor-Ebert sphere, embedded in a surrounding gas of constant density . This gas provides the boundary pressure for the sphere. The diameter of the sphere is times the size of the box. Note that this configuration alone would be unstable against gravitational collapse due to the additional mass of the surrounding gas, in which pressure gradient and gravitational force are not in balance. However, the timescale of this collapse is much longer than the dynamical timescale which is imposed on the system by the large sound velocity of about km s-1 in the hot, ionized medium. The setup chosen is not thought to provide a stable starting configuration. Our intention is rather to start with a reasonable density distribution, in which the initial core contains about one Jeans mass.
We allow material to stream freely away from the initial integration volume, i.e. no boundary conditions are imposed.
2.2 Initial density perturbations
To investigate the effects of density irregularities, we impose in some calculations Gaussian random perturbations on the initial density distribution as described by Klessen & Burkert [Klessen & Burkert 2000]. The density distribution is determined by the power spectrum . This is achieved by applying the Zel’Dovich [Zel’Dovich 1970] approximation. Besides the unperturbed case without and with self-gravity (in the following cases A and B), we ran perturbed cases with (more power on large scales, case C) and (more power on small scales, case D). The amplitude of the perturbations was chosen to be highly non-linear, with a mean relative variance of .
2.3 Parameters of the radiation field
The ionizing flux falls perpendicular onto one of the cube surfaces with a rate of photons per time and area, . We specify the ”strength” of the radiation field as the ratio between the cube size and the path length which the radiation can penetrate into the surrounding gas via an r-type ionization front. This length is given by the balance between and the recombinations along :
| (2) |
where denotes the recombination coefficient adopting the ”on the spot” approximation [Baker & Menzel 1962]. In other words, the parameter determines how much of the density enhancement is excavated by the ionization front before it turns from weak r-type into weak d-type. From that moment on the medium dynamically reacts to the pressure difference across the ionization front. For the calculations in this paper, we chose .
3 Results
3.1 Time evolution without self-gravity: case A
The time evolution in case A (Figs. 1,2) is analogous to the models of Lefloch & Lazareff [Lefloch & Lazareff 1994]. One can distinguish between four different phases:
-
1.
Immediately after the ionizing flux is switched on, a weak R-type ionization front is driven supersonically into the medium. After kyrs, the denser part of the cloud is excavated and surrounded by a region of ionized gas. The ionization front stalls and becomes nearly sonic. It converts into a weak D-type front. The gas can now react dynamically to the pressure imbalance between ionized and unionized gas (Fig. 1, first panels).
-
2.
In the second phase, this imbalance drives a shock front into the cloud with velocities . The shock accumulates a thin layer of dense shocked material (Fig. 1, second panels). It thereby converges towards the axis of the finger-like structure (“globule”) due to the curvature of the ionization front.
-
3.
After 130 Myrs, the globule reaches a stage of maximum compression (Fig. 1, third panels). Caused by the overshoot in pressure, the cloud starts reexpanding and
-
4.
enters a fourth phase, in which gas is being ionized continuously away from the surface facing the ionizing source (Fig. 2). This leads to a mass loss of . Gas is leaving the ionization front with velocities of , causing a rocket effect which accelerates the gas in the tip into the direction of photon flow. During this acceleration, gas is collected inside the globule in a lid-shaped feature facing the ionizing source. It is subject to dynamical instabilities which lead to the disintegration of the cloud after kyrs. The remaining fragments are then ionized completely after a few 10 kyrs.
3.2 Time evolution with self-gravity, no initial density perturbations: case B
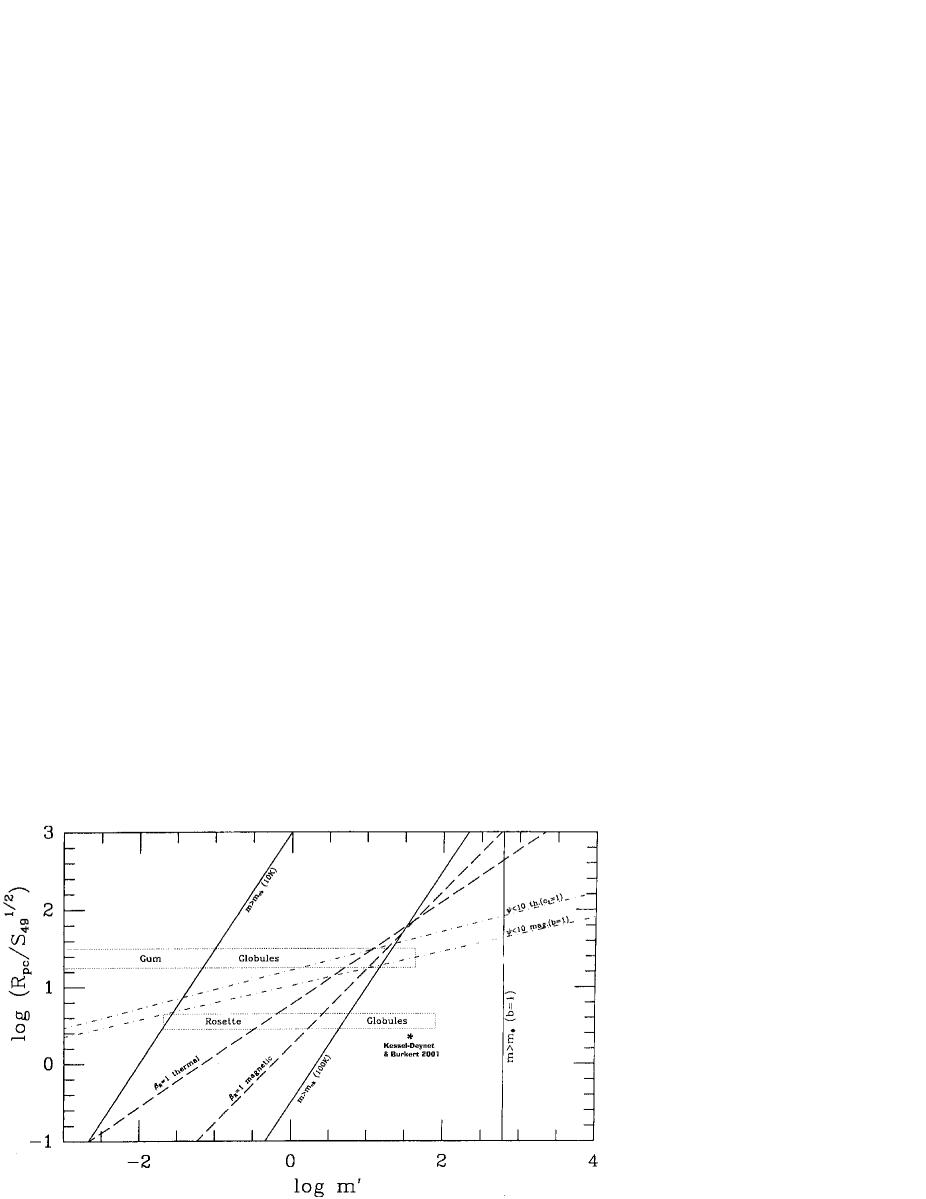
Placing our models with and into the Figure 14 in Bertoldi & McKee [Bertoldi & McKee 1990] (reprinted here as Fig. 5), they lie far in the regime where gravitational instability is expected. Simulations with smooth initial conditions including self-gravity verify this conclusion. The overall evolution is indistinguishable to the one in case A, until the point of maximum compression is reached. At that moment gravitational collapse sets in, which can be seen in the sudden rise in the maximum density of the system (see Fig. 6).


3.3 Time evolution with self-gravity, large-scale and small-scale initial density perturbations: cases C and D
In these models, the evolution fundamentally differs from the one in model B. During the compression phase, density enhancements are amplified in the shocked layer, similar to what is observed in the simulations by Elmegreen et al. [Elmegreen, Kimura & Tosa 1995] (Figs. 3, 4) and those of Williams et al. (2001) (Fig. 6f). They are reminiscent of the observed small-scale structures seen in M16 (Hester et al. 1996; White et al. 1999). Contrary to case B, no collapse occurs at the moment of maximum compression. We rather observe an evolution analogous to the phases 3 and 4 of case A. After a delay of 300 kyrs, the layer starts fragmenting by gravitational instability.
4 Discussion
4.1 Jeans Criterion
As already pointed out in Chapter 2.1, the initial conditions were chosen such that the integration volume contains Jeans mass. Looking at the Jeans mass and Jeans length ,
| (3) |
and the freefall timescale,
| (4) |
it follows that as well as drop with increasing density. At the moment of highest compression in model A, regions with densities higher than a threshold density contain . For this , one finds , and . Compared to these values, the compressed region in the tip of the cloud contains 2 Jeans masses and is large enough, and is small compared to other timescales in the system. One can thus expect that the globule is unstable to gravitational collapse at this moment. This explains why we observe collapse when including gravity in model B.
One should however use the Jeans masses criterion with care, as the cases C and D illustrate. It only considers the balance between internal energy and gravity and is thus a static approach, neglecting the effects of internal motion. It is as such only applicable in very few cases.
4.2 Reason for different behaviour of case B with respective to cases C and D
Since the initial conditions are chosen such that they contain Jeans mass for all cases, the stabilization of cases C and D cannot be caused by gas pressure alone. The only mechanism which differs in the simulations and which can be responsible is undirected gas motion, i.e. disordered kinetic energy.

Fig. 7 shows the total amount of kinetic energy relative to the center of mass compared to the gravitational energy in the system for case C. During the compression phase, more and more material is collected by the post-shock layer and accelerated to velocities km/s. As a consequence, grows steadily until the shock converges along the axis of the configuration. Then follows a short phase of strong dissipation caused by the colliding shocks. During reexpansion and acceleration of the globule, there is still a residual amount of left in the globule.
The difference between cases C and D with respect to model B is that in the latter case the gas flow is strongly converging in the tip of the globule, whereas in the former the shock front is refracted by the density fluctuations and thus a substantial amount of is transformed into undirected motion on scales small enough to support the globule. Additionally, the knots formed in the compression layer are relatively stable entities, which behave like a swarm of bullets. They tend to pass by each other without merging. Both effects inhibit gravitational collapse during maximum compression for cases C and D. In 2D calculations using cylindrical symmetry, these bullets would be represented by concentric rings and their cross section for collision would be artificially enhanced. It is thus doubtful whether the delay could be observed at all in 2D calculations.
In the late phases in models C and D, all models show gravitational instability in the dense layer which was built up in the tip of the cloud facing the source, which leads to fragmentation and disruption of the cloud (Fig. 4, lowest panel). This happens at different evolutionary times for several models we calculated, varying between 420 kyrs and 600 kyrs. We don’t show these late stages in Fig. 6, since then over 90 per cent of the gas is already ionized. This means that numerical resolution is poor due to low particle numbers in the neutral gas. A second reason why we doubt the reliability of the time when instability occurs is that it will strongly depend on the dissipation rate of the undirected kinetic energy. Since our numerical scheme uses artificial viscosity, we expect numerical dissipation which cannot represent the real value. However, the important result we trust in is the delay in gravitational collapse after maximum compression which we observe in all models with perturbed initial conditions.
The delay in the collapse for models C and D was neither observed nor anticipated in earlier work. Bertoldi & McKee [Bertoldi & McKee 1990] derived the conditions for which gravitational collapse can be expected by analysing the balance between the gas pressure in stratified clouds and the external pressure and recoil. In their Figure 14, reprinted here as Fig. 5, all the models presented here fall far into the unstable region. Note that our globules are far from stratified; the timescale for stratification is roughly given by the sound crossing time,
| (5) |
where is the radius of the globule and the sound velocity in the neutral gas. In our case,
| (6) |
which is substantially longer than the timescales considered here.
4.3 Properties of the “bullets” in case C

In Fig. 8, the distribution of thermal and kinetic virial coefficients for the six most massive “bullets” in case D are shown after 100 kyrs evolutionary time, shortly before maximum compression. The coefficients were estimated by taking the ratio of internal or kinetic energy, respectively, compared to the gravitational energy at a radius, where the bullet is by its higher density still well separated from the embedding medium. The virial coefficients are all well above 10, which indicates that the bullets are no gravitationally bound entities, but are pressure-confined. This assumption is even affirmed due to the fact that all of the bullets are situated in the shocked, dense layer which is formed by the overpressure in the neighbouring ionized medium and the recoil caused by gas traversing the ionization front with high velocity.
The hydrodynamic lifetime of the bullets, estimated from their extent and the sound velocity in the neutral medium, are found to lie between 100 and 400 kyrs, which is comparable to the time the shock front needs to penetrate the whole globule.
4.4 Simplifications and caveats of the models
4.4.1 Equation of state
In the calculations presented above, we use a very simplified equation of state. We assume that the heating and cooling timescales are short compared to the other important timescales, and that the equilibrium temperature is constant at in the neutral and in the ionized regions. For material in the ionization front, we couple the temperature to the ionization fraction by
| (7) |
This ansatz is unsatisfactory in several respects. First, the temperature of recombination zones is severely underestimated, since the temperatures of recently recombined gas tend to lie in the regime of several thousand degrees Kelvin. We expect that this leads to overestimated densities in the shadow region “behind” the main clump. We thus expect the mass reservoir to be overestimated as well, leading to longer lifetimes and increased probability for gravitational collapse in the late stages after rebounce.
It would be desirable to implement a detailed heating and cooling model, which takes into account the temperatures of dust and gas separately. This implies the application of a more general method for determining the radiation field generated by the massive stars. One possibility is application of flux-limited diffusion, which was proposed by Levermore & Pomraning [Levermore & Pomraning 1981] and already successfully implemented into grid codes [Yorke & Kaisig 1995]. This issue is currently being addressed.
4.4.2 Diffuse recombination field
The model used for solving the radiation transfer of ionizing photons uses the simplification called “on the spot assumption”. Lyman continuum photons produced by electrons falling into the ground state of protons are themselves capable of ionizing H atoms. We assume that this happens very close to the site of their production and that following the exact equations of radiation transfer for these photons can be neglected. It was shown by Yorke et al. [Yorke & Welz 1996] that this assumption is not valid in special cases where the diffuse recombination radiation leads to the penetration of ionization fronts into regions which are shielded from the direct illumination by the ionizing stars. Those regions can thus be heated to temperatures around . As in the paragraph above, this again affects the regions where ionized gas streams into the shadows and starts recombining (see for example Fig. 3, lower panels).
We expect that the recombination of this material will be delayed, if not prevented, by the Lyman continuum photons. This can also be addressed as soon as an implementation of the Flux-Limited Diffusion Approximation for SPH is at hand.
5 Summary
In this paper we demonstrate that the physics of Radiation Driven Implosion strongly depends on the properties of the initial cloud material. In the presence of initial perturbations, the evolution is highly nonlinear and the fate of the imploding cloud is not easy to foresee. We find that gravitational collapse need not necessarily occur in those objects, depending on the presence, size and strength of initial density perturbations. The redistribution of kinetic energy from the implosion into undirected motion can stabilize the globules for a significant amount of time. Unfortunately, it is difficult to estimate this delay from the models presented here, since it depends on the decay rate of the kinetic energy, and the SPH method used here can reproduce this rate only insufficiently.
The delay could be relevant for star formation if the globule is stabilized for such a long time that the ionizing radiation can totally erode the globule. If gravitational collapse occurs before, we expect the collapsing regions to decouple from the gas around them. The remaining gas will then be further accelerated by the rocket effect from the ionization front, whereas the decoupled cores will lag behind and eventually be overtaken by the ionization front. This process could then repeat for several times, as long as there is still mass in the reservoir. We expect the outcome to be very similar to the observations of Sugitani et al. [Sugitani et al. 1999, Sugitani et al. 2000], where young stellar objects are aligned to the axis of the globules with an age gradient from the oldest objects far away from the globules and the youngest ones still sitting inside. By using the numerical technique called “sink particles” [Bate 1995], we are confident to be able to reproduce this scenario. One of the next steps should be to take into account the measured internal motion in molecular clouds. We will present calculations with clouds initially supported by turbulent motion in a subsequent paper.
Acknowledgments
References
- [Baker & Menzel 1962] Baker J., Menzel D., 1962, in Menzel, D., ed., Selected Papers on Physical Processes in Ionized Plasma, p. 58
- [Bate 1995] Bate M., 1995, The Role of Accretion in Binary Star Formation, PhD thesis, Univ. Cambridge
- [Bate & Burkert 1997] Bate M., Burkert A., 1997, MNRAS, 288, 1060
- [Benz 1984] Benz W., 1984, A&A, 139, 378
- [Bertoldi 1989] Bertoldi F., 1989, ApJ, 346, 735
- [Bertoldi & McKee 1990] Bertoldi F., McKee C.F., 1990, ApJ, 354, 529
- [Bonnor 1956] Bonnor, W. B., 1956, MNRAS, 116, 351
- [Elmegreen, Kimura & Tosa 1995] Elmegreen B.G., Kimura T., Tosa M., 1977, ApJ, 451, 675
- [Elmegreen & Lada 1977] Elmegreen B.G., Lada, C.J., 1977, ApJ, 214, 725
- [Emden 1907] Emden R., 1907, Gaskugeln, Leipzig and Berlin
- [Hester 1996] Hester, J.J. et al., 1996, AJ, 111, 2349
- [Kessel-Deynet & Burkert 2000] Kessel-Deynet O., Burkert A., 2000, MNRAS, 315, 713
- [Johnstone 1998] Johnstone, D., Hollenbach, D., Bally, J., 1998, ApJ, 499, 758
- [Klessen 1997] Klessen, R., 1997, MNRAS, 292, 11
- [Klessen & Burkert 2000] Klessen, R., Burkert, A., 2000, ApJS, 128, 287
- [Lefloch & Lazareff 1994] Lefloch B., Lazareff B., 1994, A&A, 289, 559
- [Levermore & Pomraning 1981] Levermore C.D., Pomraning G.C., 1981, ApJ, 248, 321
- [Lopez2001] López-Martin, L., Raga, A.C., Mellema, G., Henney, W.J., Cantó, J., 2001, ApJ, 548, 288
- [Sandford, Whitaker & Klein 1982] Sandford M.T., Whitaker R.W., Klein R.I., 1982, ApJ, 260, 183
- [Sandford, Whitaker & Klein 1984] Sandford M.T., Whitaker R.W., Klein R.I., 1984, ApJ, 282, 178
- [Sugitani et al. 1999] Sugitani K., Tamura M., Ogura K., 1999, in Nakamoto, T., ed, Star Formation 1999. Nobeyama Radio Observatory, p. 358
- [Sugitani et al. 2000] Sugitani K., Matsuo H., Nakano M. et al, 2000, AJ, 119, 323
- [Yorke & Kaisig 1995] Yorke H.W, Kaisig M., 1995, Comp. Phys. Comm., 89, 209
- [Yorke & Welz 1996] Yorke H.W., Welz A., 1996, A&A, 315, 555
- [White 1999] White, G.J. et al., 1999, A&A, 342, 233
- [Williams 2001] Williams, R.J.R., Ward-Thompson, D., Whitworth, A.P., 2001, MNRAS, 327, 788
- [Zel’Dovich 1970] Zel’Dovich Y.B., 1970, A&A, 5, 84