2Université Paris 7 Denis Diderot, F-75251 Paris Cedex 05
3SAp, Centre d’études de Saclay, Orme des Merisiers, F-91191 Gif-Sur-Yvette
4Section of Astrophysics, Astronomy & Mechanics, University of Athens, 15784 Zografos, Athens, Greece
Are quasars accreting at super-Eddington rates?
In a previous paper, Collin &
Huré (2001), using a sample of Active Galactic Nuclei (AGN)
where the mass has been determined by
reverberation studies (the Kaspi et al. 2000 sample),
have shown that if the optical luminosity is emitted by
a steady accretion disc,
it implies that about half of the objects of the sample are accreting
close to the Eddington rate or at
super-Eddington rates.
We discuss here this problem in more details,
evaluating different uncertainties, and we conclude that this result is
unavoidable,
unless the masses are strongly underestimated by reverberation studies.
This can occur
if the broad line region is a flat
thin rotating structure with the same axis as the accretion disc,
close to the line of sight. However the masses deduced
from reverberation mapping in AGN follow the same
correlation between the
black hole mass and the bulge mass as normal galaxies (Laor 2001),
suggesting that they are correct within factor of a few. There
are then three issues to the problem: 1. accretion
proceeds at Eddington or super-Eddington rates in these objects
through slim or thick discs; 2.
the optical luminosity is not produced directly by the
gravitational release of energy, but by another additional mechanism, so
super-Eddington rates are not required;
3. accretion discs are completely “non
standard”.
Presently neither the predictions of models nor the observed
spectral distributions
are sufficient
to help choosing between these solutions. In particular, even for the
super-Eddington model, the observed optical to bolometric luminosity
ratio would be of the order of the observed one.
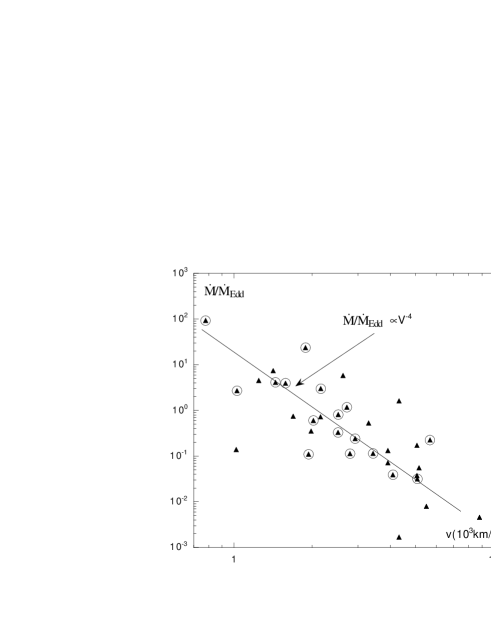
In the super-Eddington solution, there is
a strong anti-correlation
between the observed velocity widths of the lines and the
computed Eddington ratios (i.e. the accretion rate to the Eddington rate ratios),
the largest ratios
corresponding to the narrowest lines, actually to
“Narrow Line Seyfert 1” nuclei. For
the considered sample, the Eddington ratio
decreases with an increasing
black hole mass,
while the opposite is found if the accretion rate is assumed to be
proportional to the
optical-UV luminosity,
as it is usually done. If
these results are extrapolated to all quasars, it implies that the amount of
mass locked
in massive black holes should be larger than presently
thought.
If the Eddington ratio is assumed to be smaller than unity, the optical
luminosity has to be
produced by an additional non gravitational
mechanism. It has to be emitted by a dense and thick medium located at
large distances from the center (103 to
gravitational radii). It can be due to reprocessing of the
X-ray photons from the central source in a geometrically thin
warped disc, or in dense “blobs”
forming a
geometrically thick system, which
can be a part of the accretion flow or can constitute the basis of an
outflow.
The third possibility is not explored here, as it requires
completely new models of accretion discs which are still not
elaborated.
1 Introduction
Since the discovery of quasars and Active Galactic Nuclei (AGN), our ideas about their radiation mechanisms have strongly evolved. Both because the first quasars were radio loud objects, and the spectral distribution from infrared to X-rays was found close to a power law with a spectral index of unity (), the overall spectrum was attributed to the synchrotron and the synchro-Compton processes even in radio quiet objects. The seventies were therefore devoted to build models accounting for non-thermal radiation in the framework of accretion onto a black hole. A breakthrough occurred with the discovery in the spectrum of 3C 273 of an optical-UV feature called “Blue Bump”, corresponding to an important fraction of the bolometric luminosity. Since this emission does not display any line or edge and resembles a blackbody, Shields (1978) proposed to identify the emitting medium with an accretion disc, whose large optical thickness and low temperature could provide the observed spectrum. This idea was widely accepted, and many works dealt with the determination of the black hole masses and the accretion rates required to fit the blue bump observed in the spectra of AGNs and quasars (Malkan & Sargent 1982 and subsequent works). However, before the end of the eighties, it was still assumed that a non-thermal power law continuum was dominating the near infrared and contributing to the optical band. This idea has been abandoned after the publication of the generic spectrum of radio quiet quasars by Sanders et al. (1989), showing the presence of an “infrared bump”, likely due to hot dust emission peaking at a few m. Since dust sublimates at about 1700 K, it cannot dominate the spectrum below 1 m. It was thus implicitly assumed that the bulk of the emission below 1m is provided by the disc itself. Meanwhile the soft X-ray excess has been discovered (Wilkes & Elvis 1987), and it was suggested that the blue bump (which was then called the “Big Blue Bump” or BBB to distinguish it from the “small blue bump” made of a combination of FeII lines and Balmer continuum from the Broad Line Region - or BLR) extends from the optical up to the soft X-ray range (Walter et al. 1994). The extension of the BBB in the soft X-ray range was explained by Compton scattering in the X-ray irradiated “skin” of the accretion disc (Ross & Fabian 1993, Nayakshin, Kazanas & Kallman 2000). Finally the last possible “refuge” for non-thermal radiation in radio quiet objects was strongly challenged since the discovery in the hard X-ray band of a “hump” and an underlying power law (Pounds et al. 1990), this last component having an energy cut off well below 500 keV. The origin of this emission is likely to be inverse Compton process in a hot corona irradiated by UV photons produced by the disc (Haardt & Maraschi 1991, 1993). So the entire spectrum in radio quiet objects seems now well explained only by thermal emission. In this picture, the optical continuum is attributed mostly to gravitational release in a “cold” disc.
In a recent study based on black hole masses in AGN determined by reverberation mapping, Collin & Huré (2001) showed that the observed optical-UV luminosity is too large to be due to a standard thin accretion disc in many objects. We recall these results below, and we perform a more detailed study, trying to estimate different uncertainties. In Section 2 we determine the Mass-Luminosity relationship found in the “thin disc model”. In Section 3 several causes of uncertainties in this determination are reviewed. In Section 4 we compare the expected spectral distribution to the observations. Section 5 deals with the possibility of super-Eddington accretion rates, and their cosmological consequences. In Section 6 we discuss the possibility that the optical-UV continuum might provided by non-gravitational release of energy.
2 The Mass-Luminosity relation in the “thin disc” model
A major tool for determining the mass of central black holes (BHs) in AGN is reverberation mapping: the study of correlated variations of the lines and continuum fluxes gives the size of the BLR, while the measure of their Full Widths at Half Maximum (FWHM) gives the bulk velocity (see for a review Peterson 2001). It has been used in several tens of AGN, under the assumption that the BLR (or at least the part of the BLR emitting the lines used in these studies) is gravitationally bound to the BH . The FWHM is thus related to the mass by the equation;
| (1) |
where is the radius of the BLR, and is a factor of the order of unity, depending on the orbital shape and on the distribution of matter.
Several bias can alter this determination (Fromerth & Melia 2000, Krolik 2001), and we discuss their implications in Section 3. In the rest of the paper we assume that the masses determined with this method are correct within a factor of a few.
A considerable advantage of knowing the black hole mass is that it gives an additional constraint on the computed disc spectrum, which depends now only on the accretion rate (besides the inclination angle, but there are strong hints that in Seyfert galaxies and quasars it is relatively small). In previous fits of the “Big Blue Bump”, both the mass and the accretion rate were free parameters.
Collin & Huré (2001) used the luminosities of 34 AGN covering a range of four orders of magnitudes and their masses deduced from reverberation mapping by Kaspi et al. (2000), to determine the bolometric luminosity of these objects, assuming that the luminosity at 5100Å is entirely due to a steady thin accretion disc. We discuss here in more details the uncertainties of the results and their various implications 111we correct also a mistake in the determination of the luminosity (cf. below).
Thin discs are generally modelled using the -prescription for the turbulent viscosity introduced by Shakura & Sunayev (1973). It can be shown however that, for a geometrically thin disc with a local energy release, the viscosity prescription does not influence the optical emission, as long as a local blackbody assumption is valid. The radiation temperature at a distance from a BH of mass is then equal to the effective temperature:
| (2) |
where the non-dimensional factor takes into account the boundary conditions, and depends on and on the angular momentum per unit mass of the BH (Novikov & Thorne 1973; Page & Thorne 1974). There are two extreme cases: a Schwarzschild BH with , and a maximally rotating Kerr BH with . The emitted spectrum at a given wavelength in the visible range, say =5100Å, can then be calculated by integrating over the disc the value of the Planck function at this wavelength (actually the emission at a given frequency is dominated by the emission at a radius such that , cf. Frank, King & Raine (1992); for the optical band, the radius of this region is large, , with being the gravitational radius).
The flux at a frequency observed at Earth is given, in the Schwarzschild case, by:
| (3) |
where is the frequency at emission, and is the proper distance of the object
| (4) |
This expression is valid for (Weinberg 1972). is the redshift, the inclination of the disc axis on the line of sight, the external (galactic) absorption, and (respt. ) the inner (respt. the outer) radius of the accretion disc.
For a Kerr BH, the expression is more complicated, as the spectrum is formed closer to the BH and therefore is more influenced by gravitational redshift and gravitational lens effects, which are strongly dependent on the disc inclination (Cunningham 1975). These effects produce harder spectra for higher inclinations. However they do not affect the emission of the remote regions, like the optical continuum.
Setting the boundary condition and assuming that the disc extends down to the BH and is infinite (which holds if ), Eqs. 2 and 3 can be reduced to:
| (5) |
where is the temperature at the inner radius. This expression can however be strongly incorrect, for instance in the case of a truncated disc.
There are large deviations to the blackbody spectrum, in particular in the EUV band, which is emitted by the inner hottest regions of the disc where Compton scattering is important. However the spectrum is close to a blackbody in the optical band, because the disc is still optically thick in the corresponding emitting region (this is not the case for larger radii), and on the other hand Compton diffusions are negligible (see for instance the reviews of Koratkar & Blaes 1999 and Collin 2001). Moreover Hubeny et al. (2001) have studied the influence on the emergent spectrum of the metal opacity, and found that it is negligible in the optical band (cf. their figure 13). The viscosity parameter can have a larger effect, but nevertheless it is limited to a few tens of percents in this band.
It is thus possible to determine the accretion rate from Eqs. 2 and 3, knowing and the observed value of at a given wavelength in the optical range, and assuming a given value of cos. It is important to realize that this can be done even though the local blackbody approximation does not hold at higher or lower frequencies, as mentioned above. Since in the thin disc model the bolometric luminosity is equal to , where the efficiency is 0.057 and 0.32 in the Schwarzschild and in the maximally rotating Kerr cases respectively (Novikov & Thorne 1973), one can deduce in these two extreme cases. Note that in the optical band the Kerr and the Schwarzschild spectral shapes are identical, though the integrated flux differs by a factor 5.6 for the same accretion rate (cf. Hubeny et al. 2000).
We have made this computation for the 34 objects of the Kaspi et al. sample for which the BH masses are known, for a Schwarzschild BH. In an aim of uniformity, instead of the observed fluxes in the rest frame at 5100Å, we use the luminosities given by Kaspi et al. at 5100Å, in the rest frame, , which corresponds to an isotropic emission (so in the following we will call it the “isotropic luminosity”):
(Note that Collin and Huré (2001) have erroneously identified to the monochromatic luminosity of the disc). We use also the “mean” masses given by Kaspi et al. (cf. below the definition of the “mean” mass). is taken equal to 50 km s-1 Mpc-1 (it means that we multiply of Kaspi et al. by 2.25, since they use ), and to 0.5. The discs are assumed to extend up to 2 10, and down to 6 for a Schwarzschild BH.
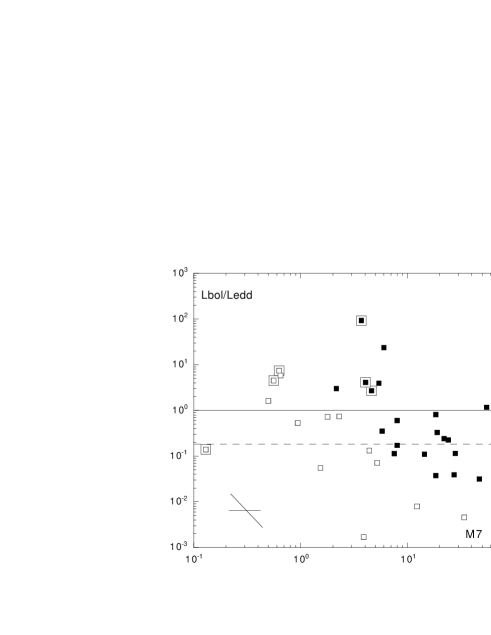
Fig. 1 displays the Eddington ratio versus the BH mass, in the Schwarzschild case, for cos=0.75. Note that for the same object, the Eddington ratio would be larger by a factor 5.6 for a maximally rotating Kerr BH. We see that even in the Schwarzschild case, 11 objects have super-Eddington luminosities, and 7 have luminosities larger than 0.3, the limit of the thin accretion disc. More than half of the sample is therefore not consistent with the model of a geometrically thin disc, and about one third contradicts the simple idea that super-Eddington luminosities cannot exist in the stationary case. In the Kerr case, 21 objects (i.e. more than half) have super-Eddington luminosities.
3 What can be wrong with this analysis?
3.1 Observational errors
3.1.1 Influence of the underlying galactic contribution
The first idea which comes to mind is that the optical continuum is dominated by the contribution of the galaxy. It can indeed be the case for low luminosity objects. The optical luminosity of the disc, and therefore the computed Eddington ratio, would thus be overestimated.
We have distinguished in Fig. 1 the objects with a isotropic monochromatic luminosity larger than ergs s-1. Except for three Seyfert galaxies which reach this luminosity (Ark 120, Mrk 509 and F9), the other luminous objects are all PG quasars. Fig. 1 shows that they form a sequence parallel to local AGN but at higher Eddington ratios. So the problem is even more dramatic for these objects. However it is unlikely that they are dominated by the underlying galaxy at 5100Å. Kriss (1988) has estimated the stellar fraction in the IR-optical range for a sample of quasars containing several of our PG quasars, and he has found that even for the less luminous one this fraction is smaller than 7.5. Also, a large fraction of our PG quasars pertain to the atlas of quasar energy distribution of Elvis et al. (1994) who give the observed spectrum and the spectrum corrected for the host galaxy contribution (see their figure 9), and we have checked that for the objects of our sample it is always smaller than 10-20 in the optical range. So the problem is not solved.

3.1.2 Uncertainties on the measured optical luminosities
According to Eq. 5, is proportional to for a given mass. Thus an uncertainty on the optical flux induces a larger relative uncertainty on .
The optical luminosities in Kaspi et al. (2000) are determined with a good precision (a few percents), but they are “averaged” luminosities which can differ from instantaneous ones typically by a factor two, translating in a factor three on . This uncertainty is smaller than required to suppress the super-Eddington rates, and it acts in either directions.
If the objects were preferentially seen face-on (cos), their observed optical luminosity would correspond to a lower value of for a given accretion rate, leading to a decrease of the computed Eddington ratio by a factor 1.5. On the other hand, another effect could lead to an increase of the Eddington ratio if an object is seen at even a relatively small inclination. Due to the large amount of matter traversed by inclined light rays, the intensity emitted by the disc is larger in the vertical direction if the source function decreases like in a stellar atmosphere (it is the “limb-darkening” effect for the Sun). It can increase the influence of the inclination angle, and therefore the Eddington ratio for a non-zero inclination.
The luminosity depends on the cosmological constants. The value of the luminosity for equal to a value of 75 km s-1 Mpc-1 would be smaller by a factor two than for of 50 km s-1 Mpc-1 chosen here, corresponding to a decrease by a factor three of . The influence of is actually negligible, owing to the relatively small redshifts of the sample. Again this is not a solution to the problem.
3.1.3 Uncertainties on the derived masses
The uncertainties on the measured masses are more important, since for a given value of , is proportional to .
The most obvious error occurs if the BLR is not gravitationally bound to the black hole. The mass would then be overestimated and the Eddington ratio underestimated. This effect is opposite to what we are looking for. This is indeed possible for the region emitting UV lines, such as CIV, which can be outflowing (cf. Done & Krolik 1996). But Balmer lines which are used here for the reverberation study are likely to be gravitationally bound (cf. Peterson & Wandel 2000, who show that the velocity dispersion is Keplerian in NGC 5548).
The shape of the BLR can also be a cause of error. For instance the size of the BLR would be underestimated, and therefore the mass also underestimated, if the BLR would be a cone pointing in the direction of the line of sight. Krolik (2001) discusses in detail several similar systematic errors in the determination of the BH masses by reverberation mapping, due to the uncertainties on the shape and on the distribution of the orbits, on the emissivity distribution, besides those simply due to a bad sampling of the observations. All these uncertainties lead to systematic errors by factors up to three in both directions. They could alter quantitatively but not qualitatively our conclusion, since one order of magnitude error on the Eddington ratio would not be sufficient to suppress the problem.
Besides the uncertainty on the factor in Eq. 1 (Kaspi et al. assume which corresponds to an isotropic distribution of velocities), there are several methods for determining the FWHMs. They can be measured on the averaged line profile, giving a “mean” BH mass, or they can be measured on the rms profile, giving a “rms” mass. The first method is preferred by Kaspi et al. (2000), and the second one is used by Peterson et al. (1998, 2000). For the Kaspi et al. sample the two methods give masses differing by factors up to three (ten in one case). Fig. 2 displays the ratios computed for the masses determined by Kaspi et al. (2000) using the rms and the mean methods. For one object only, PG 1613+658, the difference between the two measurements is as large as a factor 10, transforming a sub-Eddington into a super-Eddington rate for the rms mass. For another object (PG 1704+608), the Eddington ratio is increased by a factor 30, and reaches the enormous value of 5 104! However the two methods do not give results differing systematically in the same direction. Note that the Eddington ratio is not exactly proportional to for a given as it is predicted by the approximation of Eq. 5.
The most important error would occur if the BLR would be a thin flat rotating structure constituting the outer regions of the accretion disc, as proposed by Dumont & Collin-Souffrin (1990). In this case the factor in Eq. 1 is equal to sin which is of the order of for small inclinations. However this angle cannot be very small, as it is limited by the ratio of the scale height to the radius (i.e. to the aspect ratio of the disc). Since the accretion disc is gravitationally unstable at the distance of the BLR, it is probably not described correctly by a geometrically thin Shakura-Sunyaev model (Collin & Huré 2001). Moreover if the disc is a flat structure, X-ray irradiation by the central source would be insufficient to account for the broad line intensities. An aspect ratio smaller than unity, say 0.3, is however not excluded. It could lead to a dramatic effect on the Eddington ratio, which is proportional to sincos according to Eqs. 3 and 5. The Eddington ratio would be reduced by a factor , if the object was seen at an inclination angle smaller than 17o. Statistically it seems however implausible that all the “super-Eddington objects” would be seen at such a small inclination angle, which should correspond to less than 5 of the total number of AGN (and to less than 15 of the number of Seyfert 1 and quasars, according to the “Unifying Scheme”). But it is not impossible that a few extreme objects are seen at a very small inclination angle, and are in fact close to the Eddington rate.
To conclude this section, it is worth recalling that the BH masses determined by reverberation mapping are in agreement with those determined by other methods, in particular by the method of the galaxy bulge mass (Magorrian et al. 1998). Laor (1998, 2000, 2001) has made an extensive study of the masses of PG quasars and their host galaxies. Extrapolating the correlation between the size of the BLR and the optical luminosity found in reverberation studies to a sample of PG quasars studied with the HST, where both the FWHMs of the H line and the luminosities of the host galaxies have been determined carefully, he found that the PG quasars overlap “remarkably well” the non-linear relation between the masses of the BHs and the masses of the host galaxy bulges. He concludes in particular that “this overlap indicates that any remaining systematic errors are less than a factor 2-3” (see also Gebhardt et al. 2000, Ferrarese & Merritt 2000, and Ferrarese et al. 2001).
3.2 Theoretical uncertainties
3.2.1 Influence of the inner and outer radii
If the “cold” disc is truncated at a large inner radius (for instance by becoming hot), the computed optical luminosity would be smaller for a given accretion rate, especially for low accretion rates and large masses. So the computed Eddington ratio would be larger, and idem if the outer radius is smaller than 2 10 (the limit of the disc in our computations). If on the contrary the disc extends further away, an amount of optical radiation could be added, but only small. Moreover 2 10 corresponds to the radius where the self-gravity of the disc begins to dominate on the vertical gravity of the black hole, and the disc becomes gravitationally unstable (cf. Collin & Huré 2001). The radius of gravitational instability is even smaller for larger masses. So an outer radius of 2 10 corresponds most probably to an underestimation of the Eddington ratio.
3.2.2 Non-stationary discs
The previous discussion was based on the assumption that the accretion rate is constant along the radius. But this might not be the case.
First, the disc can be non-steady, owing to the existence of instabilities such as the thermal-viscous instability (cf. Siemiginowska, Czerny, & Kostyunin 1996). For these authors, the active phase of a galactic nucleus corresponds to outbursts induced in the disc by the instability. In this case the optical luminosity is not necessarily related to the instantaneous accretion rate in the same way as in steady discs. However it is difficult to make detailed predictions of the spectrum, which depends on the viscosity parameter .
The accretion rate can also decrease with a decreasing radius. It can be the case if a fraction of the accretion flow is converted at small radii into an outflow. Such flows should be observed through Broad Absorption Lines and/or X-ray absorption. Only one object of the super-Eddington ones is a BAL quasar (PG 1700+518), a fraction comparable to the average fraction of BALs among all quasars. We will see in the next section that no strong X-ray absorption seems to be present in the super-Eddington objects. So this assumption is unlikely.
Finally if one allows for a fraction of the accretion power to be dissipated in a corona and not in the disc itself, the problem of the optical luminosity will be even worse, since only a fraction of this energy will be returned to the disc in the form of X-ray heating.
Unless the masses determined by reverberation studies are in strong failure, it is thus difficult to avoid the conclusion that for a large fraction of the objects the geometrically thin disc model is not valid. We are faced to the solutions:
-
•
the accretion rate is really super-Eddington; it is therefore necessary to appeal to “slim” or “ thick” discs, which have a low efficiency for converting the gravitational energy into radiation; in this case one has to consider the consequences on quasar evolution.
-
•
the optical luminosity is due to an additional component, not directly provided by the accretion disc, and the accretion rates are all sub-Eddington.
-
•
the accretion disc is completely different from a “standard” one.
4 Spectral distribution predicted for accretion discs
We first examine whether the disc model can give a spectral distribution in agreement with the observations, and therefore help to discriminate between the solutions. If both the sub and the super-Eddington objects are accounted for by disc emission, we have to consider not only thin, but also slim and thick disc models.
4.1 Slim discs or geometrically thick discs
Geometrically thick discs have been introduced in the framework of the -viscosity prescription and discussed by Abramowicz et al. (1980). They are characterized by an important advective cooling term, which induces a saturation of the luminosity for super-Eddington accretion rates. In the following we shall therefore use the term “Eddington ratio” for the ratio instead of (where ). Note that for a Kerr BH, must be multiplied by 5.6, according to our definition of . Madau (1988) has shown that the existence of a central funnel leads to a strong influence of the viewing angle on the spectrum: the overall spectral distribution is softer when seen at large inclinations. However the influence of the inclination on the optical continuum should be quite similar to the thin disc.
Slim discs (Abramowicz et al. 1988) are a vertically averaged version of the thick disc, valid up to Eddington ratios of a few. The spectra of slim discs have been more studied than those of thick discs (Szuszkiewicz et al. 1996, Wang et al. 2000, Mineshige et al. 2000). They differ from those of thin discs mainly in the UV and soft X-ray ranges: they are more influenced by Compton scattering which results in a higher cutoff energy, and by advection which produces a flattening of the spectrum. Slim or thick discs are more parameter dependent than thin discs. In particular their viscosity parameter is fundamental in determining their structure, which in turn allows to compute the spectrum (a very small value of is generally used, to avoid the disc becoming optically thin). They are also more sensitive to the inclination. However the structure of the outer regions of the disc is not altered with respect to a thin disc, so the spectrum and the flux are correctly described with the thin approximation in the optical range (Mineshige et al. 2000).
4.2 Comparison of the observed and predicted optical-UV continuum

It is thus possible to determine the spectrum of the disc, assuming that it extends far enough to emit the optical continuum. In this case the disc continuum has a spectral distribution (even in the case of a thick disc).
We have 11 objects in common with the Quasar Energy Distributions Atlas of Elvis et al. (1994) who have gathered the near IR-optical and UV observations from different sources. They have corrected their spectrum for reddening and for the host galaxy contribution. Figs. 3 compare the disc emission and the observed IR to UV continuum of 10 of these 11 PG quasars. The continuum at 5100Å differs slightly from the values given by Kaspi et al (2000) used here to deduce , because the host galaxy contribution was not removed in Kaspi et al. (but it amounts to less than 20%), and the observations have been made at different epochs (we have actually suppressed one object of the Elvis et al. sample, PG 1613+658, where the two values of differ by almost a factor two). The objects are ordered by decreasing value of the Eddington ratio from top to bottom and from left to right.
One sees first that the disc continuum decreases very rapidly in the IR band, which is generally attributed to the dust contribution. We have checked that all the objects can be fitted correctly between 3m and 3000Å (i.e. between 1014 and 1015 Hz) by a mixture of dust and disc emission. A similar result would be obtained with an additional power law component instead of dust emission.
Second we notice that the computed spectrum is too hard in the UV range, as already stressed by several authors (cf. for instance Koratkar & Blaes (1999) review). It seems that the “sub-Eddington objects” are better fitted by the accretion disc model. A way to reconcile the disc model with the spectrum of the super-Eddington objects is to assume that the “cold” disc is truncated for , with being much larger than the radius of the last stable orbit, giving rise for instance to a hot corona.
4.3 Predicted X-ray continuum and X-ray luminosity
At least in the case of slim discs, one expects that the emergent spectrum should extend into the soft X-ray range (Szuszkiewicz et al. 1996, Wang et al. 1999), corresponding to a strong soft X-ray excess.
In order to study this effect in more detail, we have gathered the results concerning the 2-10 keV and 0.5-4.5 keV fluxes and luminosities from different sources, restricting our study to the most luminous objects, i.e. the PG quasars. The data constitute an inhomogeneous set, observed at different epochs and reduced with different assumptions on the spectral shape and on the X-ray absorption, but nevertheless they give qualitative information.
Table 1 summarizes the data. Column 1 gives the name of the object, column 2 the redshift, column 3 the mass in 107 M⊙, column 4 the isotropic luminosity at 5100Å (rest frame), column 5 the line velocity computed as , column 6 and column 7, respectively the 2-10 keV and the 0.5-4.5 keV isotropic luminosities, column 8 the Eddington ratio in the case of a Schwarzschild BH and an inclination cos. Columns 3 to 5 are derived from Kaspi et al. 2000.
![[Uncaptioned image]](/html/astro-ph/0203439/assets/x4.png)
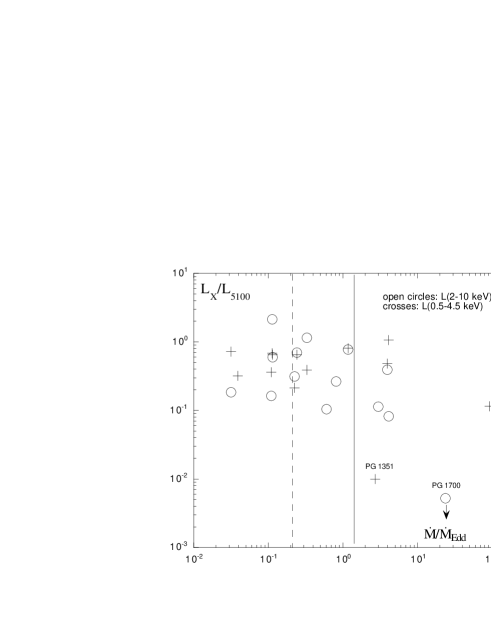
Fig. 4 displays the ratios keV)/ and keV versus the Eddington ratio. Two objects, PG 1700+518 and PG 1351+640, have very low X-ray to optical ratios. PG 1700+518 is a BAL quasar, and these objects are well known to be X-ray weak. PG 1351+640 is one of the super-Eddington objects, and it has a strong soft X-ray excess (Rush & Malkan 1996). It also exhibits UV band absorption features, however not so broad as a bona fide BAL QSO (Brandt et al. 2000). The other super-Eddington objects do not seem to display any particular behaviour in the X-ray range: they appear to have both normal and ratios, showing neither a strong soft X-ray excess, nor a strong X-ray absorption. From the very small number of objects for which both soft and hard X-ray data are available, it is therefore not possible to draw any conclusion.
4.4 Optical to bolometric luminosity ratio
A question one can ask is whether the observed ratio agrees roughly with the computed ratio. The observed generic spectrum of AGN (Laor et al. 1997) corresponds to of the order of 10. To compare the isotropic luminosity to the computed bolometric luminosity, it is necessary to divide by a factor 2cos(, if the disc radiates like a local blackbody at all frequencies, since:
| (7) |
Note that large uncertainties plague the determination of the observed spectral distribution in the UV and EUV ranges (the inclination in the Kerr case, the influence of Compton scattering…).
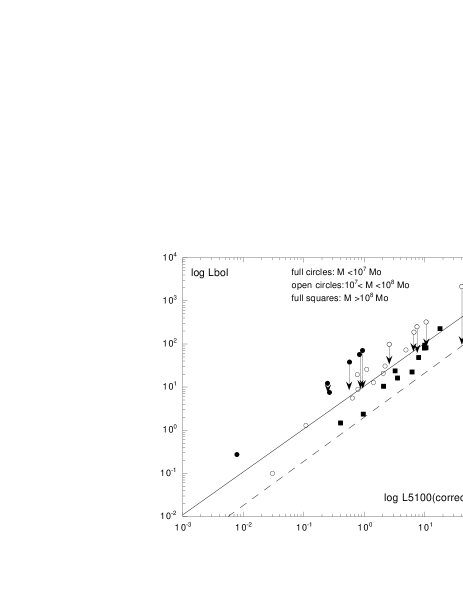
Fig. 5 displays versus (corrected), for a Schwarzschild BH and for an inclination cos. A quick look shows an apparently good correlation between the two variables, corresponding to , as observed. But when different ranges of BH masses are considered, the correlation is split: for a given value of , is smaller for a larger mass. For a given value of , Eq. 5 shows indeed that (i.e. ), is inversely proportional to . As we see on the figure, for a few objects having M⊙, and for M⊙. In the case of a Kerr BH, , in strong disagreement with the observed spectral distribution. Note that the actual “observed” bolometric luminosity should be even larger than given here, owing to the increased amount of EUV photons due to the inclination in the Kerr case, and to Compton scattering, in either the Kerr and the Schwarzschild cases.
However Fig.5 does not take into account the fact that the cannot be larger than . According to the thick disc model, when the accretion rate is larger than the Eddington rate, the radiative efficiency is low. Actually the product should be about constant in order to satisfy the relation . In Fig. 5 the super-Eddington objects are shown according to this limit. One sees that the relationship between and is now in better agreement with the observed one .
In conclusion of this section, we see that the “super-Eddington solution” is not dismissed by the observations. The optical-UV spectrum can be accounted for by an accretion disc, provided that the flux in the UV range is decreased with respect to the thin disc solution in super-Eddington objects. Also in the X-ray range there are neither enough observations and nor sufficiently high spectral resolution data to disentangle the possible combined effects of absorption and soft X-ray excess.
5 First possibility: super-Eddington accretion rates
5.1 Correlations
The spectral and variability properties exhibited by Narrow Line Seyfert 1 Galaxies (NLS1s) have led to think that they could be radiating close to their Eddington luminosity (cf. Boller et al. 2000). Therefore slim discs have been suggested to account for their large “soft X-ray excess” (Mineshige et al. 2000). Like in Collin & Huré (2001), in Fig. 1 we have distinguished the NLS1s (defined here by km/s, with (mean) and given by Kaspi et al., instead of the usual definition: FWHM km/s). This figure confirms that all except one NLS1 are super-Eddington objects (the exception being NGC 4051, which is peculiar in having a very low mass).
However NLS1s do not seem peculiar with respect to the other objects, as is shown in Fig. 6. When all objects of the Kaspi et al. sample are included, one finds that is roughly proportional to . It translates into a relation . The dependence of the size of the BLR on the BH mass and on the accretion rate could be explained by a combined effect of the radius of gravitational instability of the disc and of the ionization parameter, related to , as suggested by Collin & Huré (2001). Note that the most luminous objects (the PG quasars) are not different from the others in this context.
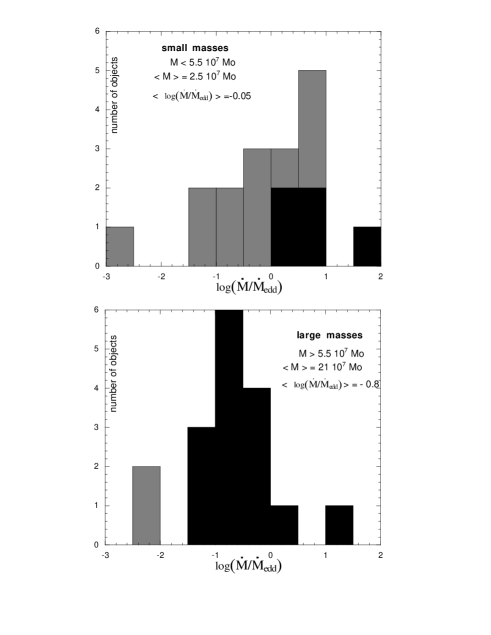
A loose anticorrelation between and appears in Fig. 1. Though it can be partly accounted for by the uncertainties on the masses which act in the same direction, it is clear that smaller masses correspond to larger Eddington ratios. The effect is quantified in Fig. 7, where the sample has been split into two equal parts. It shows that objects with an average mass of 2.5 M⊙ have an average log( equal to=-0.05, while objects with an average mass of 2.1 M⊙ have an average log( equal to -0.8. We have distinguished the objects with ergs/s. Though their number is small, we see that they display the same effect (actually even slightly amplified, but as the sample is too small we cannot be sure that it is real), meaning that the underlying contribution of the galaxy does not introduce any important bias.
The Kaspi et al. sample is actually made of two parts, on one side low luminosity local objects, which have been selected on various criteria, including a strong variability, on the other side a sample of 28 PG quasars selected on the basis of their positions, redshifts and magnitudes, from which only 17 objects had enough observations to be used for the reverberation study (Maoz et al. 1994, Kaspi et al. 2000). Since we do not know how these 17 objects have been selected, we cannot exclude a bias, for instance favoring more strongly variable objects or more luminous objects.
Several authors have deduced from their studies a relation between and the optical or UV luminosity. For instance Wandel, Peterson & Malkan (1999) found and Kaspi et al. (2000) found . Thus the assumption that is constant which was always made before, leads to the result that increases with . On the contrary, we find that the Eddington ratios are on average one order of magnitude larger for masses one order of magnitude smaller (cf. Fig. 7), i.e. that is about inversely proportional to . As already mentioned, this is due to the fact that the ratio increases with the mass, since larger masses correspond to an emission peaking at smaller frequencies for the same accretion rate.
5.2 Evolutionary consequences
The fact that the Eddington ratio can be larger than unity has important evolutionary implications. A BH accreting at the rate doubles its mass in a time of years. If some quasars are accreting with a small efficiency at a super-Eddington rate, their growing time is reduced by , and their “active phase” is therefore very short compared to the Hubble time. In particular it is much smaller than the time for the merging or for the interaction of two galaxies.
Another important cosmological implication concerns the mass in “dead black holes”. The mass density locked in black holes, required to account for the visible light of quasars, is indeed (cf. Soltan 1982, Chokshi & Turner 1992):
| (8) |
We have seen that a proportion of quasars, which can amount to half in the considered sample, has a super-Eddington accretion rate, and therefore an efficiency smaller than 0.1. It is of course impossible to determine the correction factor it would induce on Eq. 8 since we do not have a real statistic for the super-Eddington objects. Moreover other objects (those accreting at very low rate) can have also a very small efficiency (the “ADAFs”, cf. Narayan & Yi 1995), so the distribution of efficiencies during the growing and active phase is not known. Nevertheless one can expect that is larger than M⊙ Mpc-3 by a few units.
On the other hand the mass in the nuclei of normal local galaxies, which should be the remnants of the quasar population, is estimated from the Magorrian et al. (1998) linear relation between the BH and the host galaxy bulge mass () by Haehnelt, Natarajan & Rees (1998):
| (9) |
where is the mass density in bulges.
This estimate has to be revised according to Laor’s (1998, 2001) finding that the relation between and is not linear, and the ratio is about 0.0005 for low luminosity bulges and 0.005 in bright ellipticals. is thus probably smaller by one order of magnitude and therefore close to, or even smaller than, the value of . This is an uncomfortable result, owing to the fact that some late accretion could also take place in local BHs.
6 Second possibility: the Blue Bump is not emitted by gravitational release of energy
6.1 Physical conditions required for the emitting medium
The observed optical spectrum of AGN is not featureless, as it contains intense emission lines and a Balmer discontinuity. But they are attributed to the BLR. The BLR has been modelled successfully since two decades by a relatively dilute medium (with a density cm-3). Its optical thickness in the visible range is smaller than unity, and it emits a negligible continuum at wavelengths larger than the Balmer discontinuity. Since the observed Balmer discontinuity is attributed to the BLR, there is no place left for another important contribution.
Therefore is raised a general problem, namely the ability of an emitting medium to give rise to a featureless continuum in the optical range.
Let us now give up the disc model where the dependence of the flux on the radius is imposed, and simply use the fact that the medium emitting the part of the Blue Bump extending in the optical and in the near IR range should have a temperature of the order of K. The minimum radius of this region, , corresponds to the blackbody flux, as any other emission would be less efficient in terms of flux (except non-thermal emission, but we do not consider this possibility here). For K (the temperature corresponding to the maximum of the flux per unit frequency at 5000Å), it is given, within a factor of order of unity which depends on the geometry of the emitting medium, by:
| (10) |
where is expressed in 1044 ergs s-1 and is the coverage factor of the emitting medium (i.e. its opening angle).
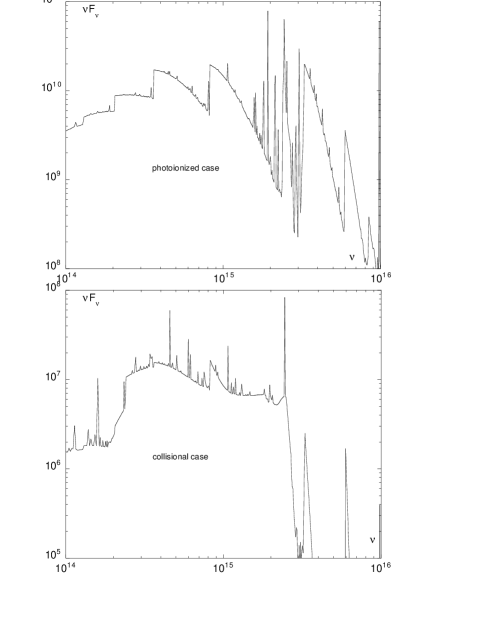
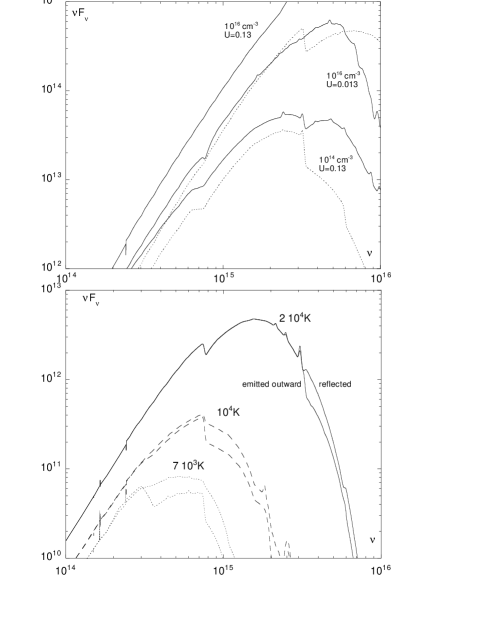

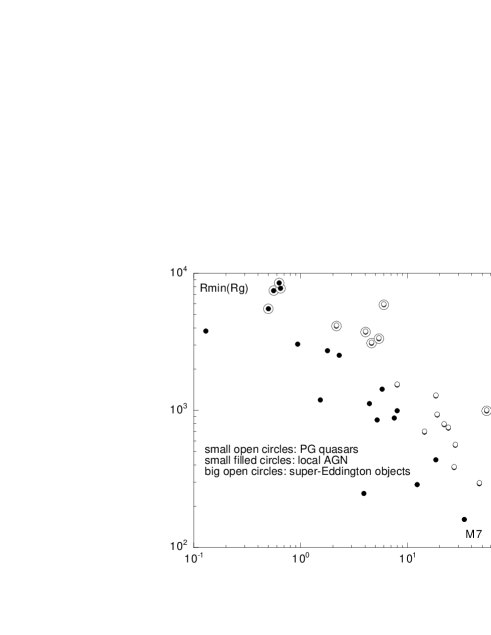
Fig. 8 displays this minimum radius for all the objects of the sample, assuming the maximum plausible coverage factor of 0.5 (corresponding to the largest value of ; note that K corresponds to a spectrum peaking at 5000Å, while a smaller temperature is required for larger wavelengths, so would be even larger). We see that the minimum radius for the optical emission is always of the order of or larger than a few hundreds . In particular it is larger than 10 for all the super-Eddington objects.
Whatever the structure of the emitting medium is, let us assume that it is irradiated and it emits by reprocessing of the central X-ray source.
A particularity of photoionized media is that they are generally far from Local Thermodynamical Equilibrium (LTE), and consequently their emission differs strongly from a Planck spectrum. It contains ionization edges and lines which are either in absorption or in emission, depending on the variation of the temperature and of the level populations with depth. To get a featureless optical continuum, a very high density and/or very large optical thickness (in the optical range) are required.
The medium emitting the optical continuum is at about the same distance as the BLR, but it should be much closer to LTE than the BLR, and therefore much thicker, (i.e. the ionized zone should be optically thick or effectively thick in the optical band). This is possible only if the density is much higher than the usual density of the BLR. To illustrate this point, the upper panel of Fig. 9 shows the total spectrum (i.e. the sum of the outward and inward spectra) emitted by a photoionized system of clouds with a density cm-3 and a column density cm-2. The photoionizing continuum is from 10 eV to 100 keV, and the ionization parameter defined as:
| (11) |
is equal to . The spectrum is computed using CLOUDY (cf. Ferland et al. 1998). The incident continuum is cut below 10eV, since we assume that there is no other emission than that produced by the system of clouds itself in the optical range (for instance an underlying power law). The emitted spectrum displays very strong Balmer and Paschen discontinuities, incompatible with the observations. The spectrum shown on the lower panel of Fig. 9 corresponds to an “hybrid” case where the medium is both collisionally and radiatively ionized, with a constant temperature equal to 5000K and an ionization parameter . This spectrum is more featureless in the optical-near IR range than in the pure photoionization case in terms of discontinuities, but nevertheless it displays a too strong Balmer discontinuity.
The density and the column density must therefore be larger than cm-3 and cm-2 to get a featureless continuum. Such models cannot be computed using CLOUDY. We have used the code TITAN designed for dense Thomson thick media (cf. Dumont et al. 2000). Examples of such cases are shown in the upper panel of Fig. 10 which displays the results of computations performed with a column density of cm-2, a density of and cm-3, with an ionization parameter and . The spectrum corresponding to cm-3 is closer to the blackbody value, as expected. All spectra are smooth (note however the presence of a few absorption lines) but they peak in the EUV and not in the optical band. This is because the temperature of the emitting shell, which is almost a constant as the medium is close to LTE, is too high for optical emission (cf. Fig 11). So one must seek for smaller ionization parameters, corresponding to smaller temperatures.
For practical reasons this is not possible presently with TITAN, which does not converge easily in this case; so we have computed hybrid cases where the temperature is set as a constant. Such cases are shown in the lower panel of Fig. 10, which displays the total spectra in three cases of temperatures, with small values of the ionization parameter. We note that the only spectrum peaking in the optical range (corresponding to K) displays large Balmer and Paschen discontinuities in its outward spectrum, but not in the reflected spectrum. The respective proportion of the reflected and emitted spectra in the observed spectrum depends on the geometry. It is quite possible that one sees preferentially the reflected spectrum (for instance in a torus geometry, where the observer is located above the torus). Moreover, the cases displayed here constitute only a few examples. We pospone to a future paper a more detailed discussion of the problem, which is out of the scope of the present article.
To summarize this discussion, we have seen that, in order to get a spectrum peaking in the optical range, and at the same time displaying very small edges or lines, it is necessary that the emitting medium, if photoionized, has both a large density (1014 cm-3), and a Thomson thickness at least of unity. Besides, to get the observed luminosity, it should be located far from the center and it should have a large spatial extension. The question is now to identify this medium.
6.2 Irradiated discs
It is admitted now that accretion discs are irradiated by the X-ray source providing the spectrum observed up to a few hundred keVs in AGN (see for a review Collin 2001). This is based on two arguments. First the UV and optical emitting bands are located at relatively large distances from each other, and the small time lags observed between the optical and UV light curves require a causal link propagating at the speed of light. This led to propose that the emitting medium is irradiated by the X-ray continuum, and emits partly as a result of this external radiative heating (Collin-Souffrin 1991). Second the presence in the X-ray spectrum of the iron K fluorescence line and of the X-ray hump (Pounds et al. 1990) implies reprocessing by a cold medium, likely an optically thick accretion disc.
In the most commonly accepted irradiated disc model, the X-ray source is located at a few disc scale heights above the inner regions of a geometrically thin disc, either as a “lamppost”, or as a patchy corona (the “flare model”). The irradiated disc absorbs the X-ray photons and reprocesses them into optical and UV-soft X radiation through atomic processes. In the hard X-ray band, the reprocessing is due to Compton diffusion. In the flare model, a magnetic flare suddenly releases a large X-ray luminosity, corresponding to a larger flux than the underlying viscous one, while it is not the case in the lamppost model.
If the disc is geometrically thin, the regions of the disc located at distances from the X-ray source larger than the height of the X-ray source (like those emitting the optical luminosity) receive a flux decreasing as , owing to the inclination of the light rays with respect to the disc surface (Dumont & Collin 1990). So the irradiating flux decreases like the viscous flux (Eq. 2). As a consequence the shape of the emitted optical continuum () is not modified with respect to the non-irradiated case (contrary to the EUV continuum, since the maximum surface temperature reached by the disc increases), and the optical luminosity cannot be increased by a large factor.
An important fraction of the UV and X-ray luminosity could be reprocessed by the outer regions of the disc into optical luminosity if the X-ray source is located at a large height above the disc. However this assumption contradicts the idea that the bulk of the X-rays is produced close to the BH.
If the scale height of the disc increases more rapidly than the radius (the disc is then said to be “flaring”), the outer regions of the disc can be irradiated more efficiently by the central X-ray source. This explanation has been often proposed (cf. for instance Siemiginowska et al. 1995, Soria & Puchnarewicz 2002) to account for the large amount of optical flux, and for the too “soft” observed continuum in the optical-UV range, compared with that expected from a disc. However this explanation presents some difficulty for two reasons. Either the optical flux is emitted at relatively small distances from the center, 102 to 10, and in this case an -disc in an AGN, which is dominated by radiation pressure and Thomson opacity, does not flare (cf. Shakura & Sunyaev 1973, Huré 2000). Or the optical flux is emitted at a large distance, 103 to 10, and in this case the -disc flares, but at the same time its midplane density decreases drastically (in ), and the density is much too small in the irradiated layers to give the required blackbody emission (cf. Dumont & Collin-Souffrin 1990). Note that these reasons do not hold for galactic BHs. First the opacity is dominated by atomic processes and not by Thomson scattering, and consequently the structure of the inner regions of the disc is different, and the height over radius ratio increases. Second the density is much larger than for AGN discs.
The flux reprocessed in the optical band can be increased if the X-ray photons are back-scattered towards the disc, but this requires a Thomson thick medium surrounding the disc and the X-ray source. This medium would create a cut-off at low energy (a few tens of keV) due to Compton scattering, which does not agree with the observed high energy spectrum of AGN.
The outer regions of the disc can also be irradiated by the central X-ray source if the disc is warped, as suggested by recent observations (Kinney et al. 2000). The warping can be due to self-irradiation instability (Pringle 1996), to misalignment of the spin of the BH with the disc (Baarden & Petterson 1975), or to feeding of the disc through a misaligned inflow. The range of observed spectral index in the optical band () is 0 to 0.5. If it is produced as a local blackbody by reprocessing of an external flux, the integration on the radius leads to an emitted flux , where is defined by the irradiating flux being proportional to . So the irradiating flux should vary as for an observed spectral index equal to 0, and as for 0.5, compared to the non-irradiated case where the flux varies as . These values are plausible, though they imply a large warping.
So finally the model of a geometrically thin warped irradiated disc is the minimum prerequisite to account for the observations. However one should check from a detailed modelling, with the observed values of the mass and the luminosity, that the required density and column density are reached at large distances from the center.
6.3 An inhomogeneous emitting medium made of dense clouds
If the emitting medium is not in the form of a thin disc, its large size (typically cm), combined with a density of at least cm-3, would imply an enormous column density for a uniform medium. When located on the line of sight, it would completely obscure any emission coming from the center, including gamma rays. This is not observed, except perhaps in the most obscured Ultra Luminous Infrared galaxies.
The suggestion that the BBB is emitted by a system of dense clouds reprocessing the X-ray continuum was made by Celotti et al. (1992), who assumed an emission region made of very dense (up to cm-3) Thomson thin clouds. Barvainis (1993), Collin-Souffrin et al. (1996), proposed an emission region made of less dense ( cm-3) Thomson thick clouds. The first model does not account for a featureless continuum in the UV range, where the medium is optically thin (cf. Kuncic et al. 1996). The second model can account easily for a featureless continuum both in the optical and in the UV range.
An additional advantage of the “thick cloud” model is that it can also account for the presence of the reflection features observed in the X-ray range, i.e. the fluorescence FeK line and the hump. In particular it can explain the broad profile of the Fe line (with extended blue and red wings), which in this case is due to comptonization, without requiring a relativistic broadening by reflection on a thin disc located very close to the BH (Abrassart & Dumont 1998, 1999).
7 Third possibility: completely non standard discs
If the release of gravitational energy is not local, the emitted spectrum can be completely different from that of a standard disc. The energy can be transported magnetically and released far from the BH, for instance in the form of relativistic particles emitting synchrotron radiation or through shocks formed in jets. In this case the emission spectrum depends on the mechanism of energy release, and is not known. Another possibility is that in the remote regions of the disc (which are self-gravitating, see Collin & Huré 2001 for the Kaspi et al. sample), self-gravitation induces changes in the rotation curve, which could become non-Keplerian. Such a mechanism has been proposed in the context of protostellar discs to explain their infrared spectrum (Lodato & Bertin 2001). Since these models are presently not sufficiently elaborated in the framework of AGN, we leave this question opened.
8 Conclusion
Though known with large uncertainties, the BH masses deduced from reverberation studies are now proved to be consistent with the relationship between BH mass and galaxy velocity dispersion (Laor 1998, 2001). For the sample of 34 AGN studied by reverberation mapping, we have used these masses to deduce the accretion rates and the corresponding bolometric luminosities, assuming that the observed optical luminosity is provided by the accretion disc. Through a discussion of the different sources of uncertainties, we have shown that it is difficult to escape the conclusion that, either a large fraction of the objects are accreting at Eddington ou super-Eddington rates through geometrically thick disc, or the optical luminosity is not provided by the disc.
We summarize here the main conclusions.
1. If a fraction of the objects are accreting at super-Eddington rates, their bolometric luminosity is limited to the Eddington luminosity, and the ratio of their optical to bolometric luminosity agrees with the observed ratio . As already known, we show that in general it is difficult to account for the observed spectrum in the optical-UV range with a standard accretion disc, in particular for the super-Eddington objects: the observed spectrum is too “soft”, or in other words, there is too much energy observed in the optical band compared to the UV band. It is necessary to assume that the disc is truncated at an inner radius much larger than the last stable orbit, or for any reason does not emit UV radiation. On the other hand, present X-ray observations are finally not able to help dismiss the “super-Eddington solution”.
2. If a large fraction of AGN are accreting at super-Eddington rates (via geometrically thick discs), some important evolutionary and cosmological consequences follow.
First the most massive objects are accreting at the smallest rates (expressed in Eddington ratios), i.e. the accretion rate is about inversely proportional to the mass, while an opposite result is found if the accretion rate is assumed to be proportional to the optical luminosity, as always done.
Second the lifetime of these AGN should be very short, and since the efficiency of mass-energy conversion is low in this process, the mass density locked in dead quasars should be larger than it is deduced for a “normal” efficiency.
Incidentally we find also that the NLS1 nuclei are at the extreme of a well defined sequence relating the Eddington ratio to the line widths.
3. If the optical luminosity is not emitted by a standard disc, super-Eddington rates are not required. However, in order to get a featureless emission like the blue bump, it is necessary to appeal to a dense and optically thick medium, and the observed luminosities imply a very large emitting surface, therefore large distances from the center. Either a warped geometrically thin disc illuminated by the central X-ray source, or a quasi-spherical system of dense clouds, can constitute an adequate emitting medium. In the latter case, such a system of clouds might also be responsible for the reflection features in the X-ray range, i.e. the broad Fe K line and the hump. Though these dense clouds can participate to the accretion flow, a tempting hypothesis is that they pertain to an outflowing wind, whose dilute counterpart constitutes the Warm Absorber and the Broad Absorption Line region.
In conclusion we are not able to give a firm answer to the question raised in the title. It is quite possible that a large fraction of objects accrete at super-Eddington rates, with all the consequences that it would imply, or that the Blue Bump - at least its optical part - is not due to a standard disc, and thus does not require super-Eddington accretion rates.
References
- (1) Abramowicz, M. A., Calvani, M., Nobili, L., 1980, ApJ, 242, 772
- (2) Abramowicz, M. A., Czerny, B., Lasota, J. P., Szuszkiewicz, E., 1988, ApJ, 332, 646
- (3) Abrassart, A., Dumont, A.-M. 1998, Proc. of the First XMM workshop on “Science with XMM”, M. Dahlem (ed.)
- (4) Abrassart, A., Dumont, A.-M. 1999, Proceedings of the Bologna Conference on “X-ray Astronomy, Stellar Endpoints, AGNs and the Diffuse X-ray Background” (Astroph. Lett. and Comm.)
- (5) Bardeen, J. M. , Petterson, J. A., 1975, ApJL, 195, L65
- (6) Barvainis, R., 1993, ApJ, 412, 513
- (7) Boller, Th., Brandt, W.N., Leighly K.M., Ward, M.J., 2000, Proceedings of the workshop on “observational and theoretical progress in the study of NLS1 galaxies” held in Bad Honnef, Germany, Dec. 8-11 1999, New Astronomy Review 44, 381-580
- (8) Brandt, W.N., Laor, A., Wills, B.J., 2000, ApJ, 528, 637
- (9) Celotti, A., Fabian, A. C., Rees, M. J., 1992, MNRAS, 255, 419
- (10) Chokshi, A. , Turner, E. L., 1992, MNRAS, 259, 421
- (11) Collin-Souffrin S., 1991, A&A, 249, 344
- (12) Collin-Souffrin, S., Czerny, B., Dumont, A.-M., Zycki, P. 1996, A&A, 314, 393
- (13) Collin, S., 2001, in “The starburst-AGN connection”, Advanced Lectures held in Tonantzintla, Mexico, Ed. World Scientific, p. 167
- (14) Collin, S., Huré, J.-M., 2001, A&A, 372, 50
- (15) Cunningham, C. T., 1975, ApJ, 202, 788
- (16) Done, C. , Krolik, J. H., 1996, ApJ, 463, 144
- (17) Dumont, A.-M., Collin-Souffrin S., 1990, A&A, 229, 302
- (18) Dumont, A.-M., Abrassart, A., Collin, S., 2000, A&A, 357, 823
- (19) Elvis, M., Wilkes, B. J., McDowell, J. C., et al., 1994, ApJS, 95, 1
- (20) Ferland, G. J., Korista, K. T., Verner, et al., 1998, PASP, 110, 761
- (21) Ferrarese, L. , Merritt, D., 2000, ApJL, 539, L9
- (22) Ferrarese, L., Pogge, R. W., Peterson, et al., 2001, ApJL, 555, L79
- (23) Frank, J., King, A.R., Raine, D.J., 1992, “Accretion Power in Astrophysics”, Cambridge University Press
- (24) Fromerth, M. J. , Melia, F., 2000, ApJ, 533, 172
- (25) Gebhardt, K., Kormendy, J., Ho, L.C., et al., 2000, ApJL, 543, L5
- (26) George, I. M., Turner, T. J., Yaqoob, et al., 2000, ApJ, 531, 52
- (27) Haardt, F., Maraschi, L. 1991, ApJ, 380, L51
- (28) Haardt, F., Maraschi, L. 1993, ApJ, 413, 507
- (29) Haehnelt, M. G., Natarajan, P., Rees, M. J., 1998, MNRAS, 300, 817
- (30) Hubeny, I., Agol, E., Blaes, O., Krolik, J. H., 2000, ApJ, 533, 710
- (31) Hubeny, I., Blaes, O., Krolik, J. H., Agol, E., 2001, ApJ, 559, 680
- (32) Huré, J-M. 2000, A&A, 358, 378
- (33) Kaspi, S., Smith, P. S., Netzer, H., et al., 2000, ApJ, 533, 631
- (34) Kinney, A. L., Schmitt, H. R., Clarke, et al., 2000, ApJ, 537, 152
- (35) Koratkar A., Blaes O. 1999, PASP, 111, 1
- (36) Krolik, J. H., 2001, ApJ, 551, 72
- (37) Kriss, G. A., 1988, ApJ, 324, 809
- (38) Kuncic, Z., Celotti, A., Rees, M. J., 1997, MNRAS, 284, 717
- (39) Laor, A., Fiore, F., Elvis, M., Wilkes, B.J., McDowell, J.C., 1997, ApJ, 477, 93
- (40) Laor, A., 1998, ApJL, 505, L83
- (41) Laor, A., 2000, ApJL, 543, L111
- (42) Laor, A., 2001, ApJ, 553, 677
- (43) Lawson, A. J. , Turner, M. J. L., 1997, MNRAS, 288, 920
- (44) Lodato, G., Bertin, G., 2001, A&A, 375, 455
- (45) Madau, P., 1988, ApJ, 327, 116
- (46) Magorrian, J., Tremaine, S., Richstone, D., et al., 1998, AJ, 115, 2285
- (47) Malkan, M.A., Sargent, W.C.W. 1982, ApJ, 254, 122
- (48) Maoz, D., Smith, P. S., Jannuzi, B. T., Kaspi, S., Netzer, H., 1994, ApJ, 421, 34
- (49) Mineshige, S., Kawaguchi, T., Takeuchi, M., Hayashida, K., 2000, PASJ, 52, 499
- (50) Narayan, R., Yi, I., 1995, ApJ, 452, 710
- (51) Nayakshin, S., Kazanas, D., Kallman, T. R., 2000, ApJ, 537, 833
- (52) Novikov I. D., Thorne K. S., 1973, in De Witt C., DeWitt B., eds, “Black Holes”, Gordon & Breach, New York, p. 343
- (53) Page, D. N. , Thorne, K. S., 1974, ApJ, 191, 499
- (54) Peterson, B. M., Wanders, I., Bertram, R., et al., 1998, ApJ, 501, 82
- (55) Peterson, B. M., Wandel, A., 2000, ApJL, 540, L13
- (56) Peterson, B. M., McHardy, I. M., Wilkes, B. J., et al., 2000, ApJ, 542, 161
- (57) Peterson, B.M., 2001, in “The starburst-AGN connection”, Advanced Lectures held in Tonantzintla, Mexico, Ed. World Scientific
- (58) Pringle, J. E., 1996, MNRAS, 281, 357
- (59) Soria, R. , Puchnarewicz, E. M., 2002, MNRAS, 329, 456
- (60) Ross, R. R. , Fabian, A. C., 1993, MNRAS, 261, 74
- (61) Pounds, K. A., Nandra, K., Stewart, G. C., George, I. M., Fabian, A. C., 1990, Nature, 344, 132
- (62) Rush, B., Malkan, M.A., 1996, ApJ, 456, 466
- (63) Sanders, D. B., Phinney, E. S., Neugebauer, G., Soifer, B. T., Matthews, K., 1989, ApJ, 347, 29
- (64) Shakura N.I., Sunyaev R.A., 1973, A&A, 24, 337
- (65) Shields, G.A. 1978, Nature, 272, 423
- (66) Siemiginowska, A., Czerny, B., Kostyunin, V., 1996, ApJ, 458, 491
- (67) Soltan, A., 1982, MNRAS, 200, 115
- (68) Siemiginowska, A., Kuhn, O., Elvis, et al., 1995, ApJ, 454, 77
- (69) Szuszkiewicz, E., Malkan, M.A., Abramowicz, M.A., 1996, ApJ, 458, 474
- (70) Tananbaum, H., Avni, Y., Green, R. F., Schmidt, M., Zamorani, G., 1986, ApJ, 305, 57
- (71) Walter, R., Orr, A., Courvoisier, et al., 1994, A&A, 285, 119
- (72) Wang, J., Szuszkiewicz, E., Lu, F., Zhou, Y., 1999, ApJ, 522, 839
- (73) Wandel, A., Peterson, B. M., Malkan, M. A., 1999, ApJ, 526, 579
- (74) Weinberg, S., 1972, ” Gravitation and cosmology: Principles and applications of the general theory of relativity”, New York: Wiley
- (75) Wilkes, B. J. , Elvis, M., 1987, ApJ, 323, 243