Spectral mapping of the spiral structures in IP Pegasi on the decline from an outburst
Abstract
We report eclipse mapping of time resolved spectroscopy of the dwarf nova IP Pegasi on the late decline from the May 1993 outburst. The continuum light curves exhibit an asymmetric ‘V’ shape with broad bulges and results in eclipse maps with two asymmetric arcs extended both in radius [, where is the distance from the disc centre to the inner lagrangian point] and in azimuth (by ), interpreted as a two-armed spiral shock. The spiral arms are thus still visible some 8 days after the onset of the outburst. Their fractional contribution to the continuum emission, 12 per cent of the total light, is similar to that measured close to outburst maximum, whereas their orientation is rotated by with respect to the spirals seen in the eclipse map at outburst maximum. The radial temperature distribution computed from the spiral-free disc regions is flat, with temperatures of about at all disc radii.
Velocity-resolved light curves across the H and the He I lines show the classical rotational disturbance, with the blue side of the line being eclipsed earlier than the red side. The differences between the H and the He I maps are significant. The spiral arms are clearly seen in the He I maps, with the receding arm being stronger in the red side while the approaching arm is stronger in the blue side of the line. The analysis of the H maps suggests that this emission arises mainly from a large and vertically-extended region which we interpret as an outflowing (and spiraling) disc wind. The H emission-line surface brightness is flat in the inner disc regions ( for ) but decreases sharply with radius in the outer disc ( for ). The spectrum of the uneclipsed light is dominated by a strong, blueshifted and narrow H emission line superimposed on a red continuum and can be understood as a combination of emission from an M5V secondary star plus optically thin emission from the outer parts of the vertically-extended disc wind. The inner disc regions show an emission line spectrum with a strong [ Å] and broad () H component superimposed on a flat continuum. This is in marked contrast with the results from the spectral mapping of nova-like variables of comparable inclination and mass ratio and suggests that intrinsically different physical conditions hold in the inner disc regions of outbursting dwarf novae and nova-like systems.
keywords:
binaries: close – novae, cataclysmic variables – eclipses – stars: individual: (IP Pegasi).1 Introduction
Many aspects of accretion disc physics are best studied in mass-exchanging binaries such as non-magnetic Cataclysmic Variables (CVs). In these close binaries mass is fed to a white dwarf (the primary) by a Roche lobe filling companion star (the secondary) via an accretion disc, which usually dominates the ultraviolet and optical light of the system (Frank, King & Raine 1992; Warner 1995).
Accretion discs in CVs cover a range of accretion rates, Ṁ, and different viscosity regimes. For example, the sub-class of dwarf novae comprises low-mass transfer CVs showing recurrent outbursts (of 2–5 magnitudes, on timescales of weeks to months), caused either by an instability in the mass transfer from the secondary star (the MTI model) or by a thermal instability in the accretion disc (the DI model) which switches the disc from a low to a high viscosity regime (See, e.g., Pringle, Verbunt & Wade 1986). On the other hand, nova-like variables seem to be permanently in a high viscosity state, presumably as a result of the fact that the mass transfer rate is always high.
The observation of accretion discs in CVs is well beyond the capabilities of current direct imaging techniques as it requires resolving structures on angular scales of micro arcseconds. However, the binary nature of these systems allows the application of powerful indirect imaging techniques such as eclipse mapping (Horne 1985) and Doppler tomography (Marsh & Horne 1988) to probe the dynamics, structure and the time evolution of their accretion discs.
IP Pegasi is an intensively studied eclipsing dwarf nova with an orbital period of 3.8 hr. Doppler tomography of emission lines revealed the presence of conspicuous spiral structures during outburst (Steeghs, Harlaftis & Horne 1997; Harlaftis et al. 1999), in support of hydrodynamical disc simulations (Armitage & Murray 1998, Stehle 1999). Tidally induced spiral shocks are expected to appear in dwarf novae discs during outburst as the disc expands and its outer parts feel more effectively the gravitational attraction of the secondary star. Eclipse mapping close to outburst maximum helped to constrain the location and orientation of the spiral structures and to show that the gas in the spiral shocks has sub-Keplerian velocities (Baptista, Harlaftis & Steeghs 2000a; hereafter BHS).
In this paper we present spectrally-resolved eclipse maps of the accretion disc of IP Pegasi on the late decline from an outburst. The observations and the data reduction are described in section 2. The details of the data analysis are given in section 3. In section 4 we investigate the disc structure at different wavelengths, we present and discuss spatially-resolved disc spectra and the spectrum of the uneclipsed light as well as the radial distribution of the disc brightness temperatures and of the H line intensity. The results are summarized in section 5.
2 Observations
Time-resolved optical spectro-photometry ( Å, dispersion of 2.3 Å per pixel) covering one eclipse of IP Peg was obtained with the 1.3-m Michigan-Dartmouth-MIT (MDM) telescope during the late decline from the 1993 May outburst. The run started on May 26 at 9:41 UT and consists of 25 short exposures () at a time resolution of 147 s. The observations were taken under good sky conditions but at relatively high air masses () and cover a narrow phase range around eclipse (from to cycle).
The data were bias-subtracted and corrected for flat-field effects, and the 1-D spectra were optimally extracted with the algorithm of Horne (1986). Arc-lamp observations were used to calibrate the wavelength scale. Observations of the standard spectrophotometric stars Feige 67 and BD+26 2606 (Oke & Gunn 1983; Massey et al. 1988) were used to derive the instrumental sensitivity function and to flux calibrate the set of extracted spectra to an accuracy of better than 5 per cent. Error bars were computed taking into account the photon count noise and the sensitivity response of the instrument. We corrected for slit losses by comparing simultaneous band photometry provided by Zhang (1993, private communication) with synthetic photometry computed from our spectra. However, since the data were acquired at an airmass of up to 2.5 there is a danger that the red end of the calibrated spectra are contaminated by color dependent slit losses due to differential atmospheric refraction (estimated uncertainty of less than 20 per cent).
Figure 1 shows the visual light curve of IP Peg for the period May–June 1993 from AAVSO observations. A vertical dotted line marks the epoch of our observations and a filled hexagon shows the corresponding out-of-eclipse synthetic band magnitude.

The outburst started roughly on JD 2449126. Our observations were performed days after the onset of the outburst and capture the late stages of the fast decline from maximum, when the star was about 0.5 mag above its quiescent (optical) brightness level. HST observations on the following nights show that in the ultraviolet IP Peg was still declining in brightness 3 days after our observations (Baptista et al. 1994a).
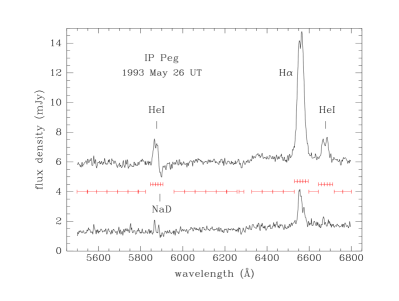
Average out-of-eclipse and mid-eclipse spectra are shown in Fig. 2. The out of eclipse spectrum is dominated by strong, broad and double-peaked H I and He I emission lines, as previously seen in outburst spectra (Piché & Szkody 1989; Marsh & Horne 1990). The interstellar Na D line is also visible. The H line has an equivalent width of Å. There is still significant H emission during eclipse whereas the strength of the He I lines is considerably reduced at these phases (the net line emission flux reduces by factors of about 5 and 15, respectively for H and the He I lines), indicating that the He I lines comes from closer to the disc centre than H.
3 Data Analysis
3.1 Light curves
The spectra were divided into a set of 21 narrow continuum passbands ( Å wide) and 15 velocity-resolved passbands across the H, He I and He I emission lines (resolution of per bin), in a total of 36 passbands (indicated in Fig. 2). In order to define the velocity-resolved passbands, a systemic velocity of (Marsh 1988; Hessman 1989) was subtracted from the rest wavelength of each pixel; the spectral bins were defined by central velocity and velocity shift, and the average flux per bin was computed by summing across the bin with partial pixel arithmetic (each pixel was weighted by the fraction of its width that is included in the passband). Errors in the average flux per bin were also computed including partial pixel arithmetic. For those passbands including emission lines the light curve comprises the total flux at the corresponding bin with no subtraction of a possible continuum contribution 111This choice allows one to simultaneously probe regions in which the lines are in absorption or emission with a single eclipse map by simply subtracting an average adjacent continuum map from the total flux line map to derive a net emission/absorption line map..
Light curves were constructed for each passband by computing the average flux on the corresponding wavelength range and phase folding the results according to the ephemeris of Wolf et al. (1993),
| (1) |
where gives the inferior conjunction of the white dwarf. IP Peg shows long-term ( years) cyclical orbital period changes, with departures of the observed mid-eclipse timings of up to 2 minutes with respect to the ephemeris of Eq.(1). In order to correctly phase our light curves, we measured white dwarf egress times from quiescent data a few months before and after this outburst (Baptista et al. 1994a). From these timings we inferred a white dwarf mid-eclipse phase of cycle for this epoch (adopting an eclipse width of cycles, Wood & Crawford 1986) and corrected the data accordingly in order to make the centre of the white dwarf eclipse coincident with phase zero.
In the standard eclipse mapping method all variations in the eclipse light curve are interpreted as being caused by the changing occultation of the emitting region by the secondary star. Thus, out-of-eclipse brightness changes (e.g., orbital modulation due to anisotropic emission from the bright spot) have to be removed before the light curves can be analyzed. The small differences in the out-of-eclipse brightness level before and after eclipse (of up to 10 per cent) were removed by fitting a straight line to the phases outside eclipse, dividing the light curve by the fitted line, and scaling the normalized light curve to the value at phase zero. This procedure removes orbital variations outside eclipse with only minor effects on the eclipse shape itself.
3.2 Eclipse Maps
The light curves were analyzed with eclipse mapping techniques (Horne 1985; Baptista & Steiner 1993) to solve for a map of the disk brightness distribution and for the flux of an additional uneclipsed component in each band. The reader is referred to Baptista (2001) for a recent review on the eclipse mapping method.
For our eclipse maps we adopted a flat grid of pixels centered on the primary star with side 2 RL1, where RL1 is the distance from the disk center to the inner Lagrangian point. The eclipse geometry is defined by the mass ratio and the inclination . The mass ratio defines the shape and the relative size of the Roche lobes. The inclination determines the shape and extension of the shadow of the secondary star as projected onto the orbital plane. We adopted the values derived by Wood & Crawford (1986), and , which corresponds to an eclipse phase width of cycles. This combination of parameters ensures that the white dwarf is at the centre of the map. Eclipse maps obtained using a different set of parameters, and (Marsh 1988) show no perceptible difference with respect to the maps derived using the above geometry. Hence, for the remainder of the paper we will refer to and show the results for ().
For the reconstructions we adopted the default of limited azimuthal smearing of Rutten, van Paradijs & Tinbergen (1992a), which is better suited for recovering asymmetric structures than the original default of full azimuthal smearing (cf. Baptista, Steiner & Horne 1996). The reader is referred to BHS and Baptista (2001) for eclipse mapping simulations with asymmetric sources which show how the presence of spiral structures affect the shape of the eclipse light curve, and which evaluate the ability of the eclipse mapping method to reconstruct asymmetric structures in eclipse maps.
The statistical uncertainties of the eclipse maps were estimated with a Monte Carlo procedure (e.g., Rutten et al. 1992a). For a given narrow-band light curve a set of 20 artificial light curves is generated, in which the data points are independently and randomly varied according to a Gaussian distribution with standard deviation equal to the uncertainty at that point. The light curves are fitted with the eclipse mapping algorithm to produce a set of randomized eclipse maps. These are combined to produce an average map and a map of the residuals with respect to the average, which yields the statistical uncertainty at each pixel. The uncertainties obtained with this procedure are used to estimate the errors in the derived radial brightness and temperature distributions as well as in the spatially-resolved spectra.
4 Results
4.1 Disc structure
In this section we compare eclipse maps at selected passbands in order to study the structure of the accretion disc at different wavelengths.
The lower panels of Fig. 3 show the light curve and the eclipse map of the continuum passband at .
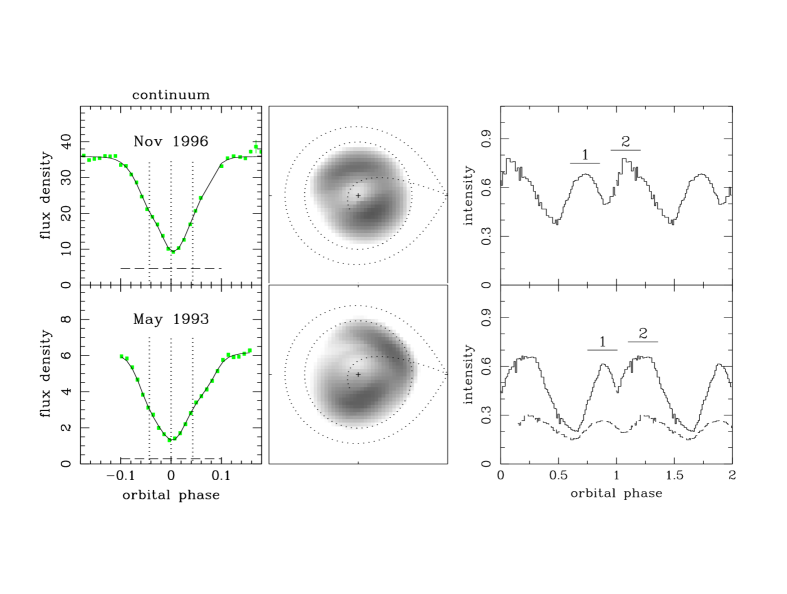
The light curve exhibits an asymmetric ‘V’ shape with broad bulges similar to those seen in the light curves of BHS and results in an eclipse map with two clear asymmetric arcs extended both in radius [] and in azimuth (by ), which we interpret as emission from spiral shocks – as previously seen in Doppler tomograms (Steeghs et al. 1997; Harlaftis et al. 1999) and in the eclipse maps of BHS. Similar eclipse shape and asymmetric structures in the eclipse map are consistently found in all continuum passbands. Furthermore, since the eclipse in the simultaneous band light curve shows the same ‘V’ shape with broad bulges, we are confident that the asymmetric structures in the eclipse maps are real and are not artifacts caused, e.g., by an improper correction of the slit losses. The continuum arcs contribute about 12 per cent of the total flux of the eclipse map, which is comparable to the 13 per cent fractional contribution found by BHS despite the reduction by a factor of 6 in the out of eclipse flux level between the two outburst stages. Hence, the spirals are still visible in the late stages of the outburst and their fractional contribution to the continuum emission is similar to that measured close to outburst maximum. This confirms and extends the results from Morales-Rueda, Marsh & Billington (2000), who found that the spiral structure was still clearly visible in Doppler tomograms of IP Peg 5 and 6 days after the start of an outburst, and also those of Steeghs et al. (1996), the He I Doppler tomogram of which shows a clear spiral pattern some 8 days after the onset of the outburst.
Fig. 3 presents an illustrative comparison between our results and those from BHS, which show the accretion disc of IP Peg close to the maximum of the 1996 November outburst. Horizontal dashed lines in the left-hand panels indicate the uneclipsed component in each case. While the uneclipsed component of the outburst maximum map corresponds to about 12 per cent of the total flux (BHS), it is reduced to about 5 per cent in our late decline map. If this light arises from a vertically-extended disc wind (see below, and also section 4.3) this comparison suggests that the wind emission (and possibly the amount of ejected material) decreases faster than the disc brightness at the late decline stage. This is in line with previous suggestions by Piché & Szkody (1989) and Marsh & Horne (1990), who attributed the low-velocity component seen in He II to an outflowing wind from the inner disc regions and pointed out that the reduction in strength of this feature as the outburst proceeds could be an evidence of a decreasing mass outflow in the wind.
The BHS continuum map corresponds to a shorter wavelength than our data (). Nevertheless, since our experiment shows that the continuum maps are reassuringly similar over a rather large spectral range ( Å), the following discussion should be free from wavelength-dependent effects.
With respect to the arcs seen in the continuum map of BHS, the asymmetric arcs in our continuum maps appear rotated in azimuth in the retrograde sense (the disc gas and the secondary star in the maps of Fig. 3 rotate counter-clockwise). In order to quantify this statement, we divided the eclipse maps in azimuthal slices (i.e., ‘slices of pizza’) and computed the maximum intensity as well as the radius at which the intensity reaches a maximum for each azimuth. This exercise allows us to trace the distribution in radius and azimuth of the spiral structures. The azimuthal distribution of the maximum intensity for each map is plotted in the rightmost panels of Fig. 3 as a function of orbital phase (orbital phases increases clockwise in the eclipse maps of Fig. 3 and phase zero coincides with the inner lagrangian point L1). The location of the spiral arms are indicated by horizontal bars with labels 1 and 2. Assuming that the spiral structure which develops is repeatable from one outburst to another, the difference in azimuth (orbital phase) of the spiral arms from one map to the other is clearly visible. By cross-correlating the two distributions we find a phase offset of cycle (or, equivalently, a change in azimuth of ). For illustration purposes, the azimuthal distribution of the maximum intensity for the Nov 1996 map is plotted as a dashed line in the right-hand lower panel, displaced in phase by cycle. It therefore seems that the orientation of the spiral arms has changed from outburst maximum to the late decline.
Changes in the orientation of the spiral arms of similar amplitude () are clearly seen in the sequence of He II tomograms of U Gem on the decline from an outburst (Groot 2001), whereas hints of the same effect in IP Peg can be found by comparing the He I Doppler tomogram of Steeghs et al. (1997) with that of Steeghs et al. (1996). Possible explanations include a thickness effect (changes in vertical thickness along the spiral arms leading to different apparent orientations), an optical depth effect (changes in intensity along the spiral pattern due to variable obscuration, also leading to different apparent orientations), or a geometrical effect (a real change in the azimuth of the spirals).
We may exclude the possibility that the asymmetric structures are caused by density enhancements in an elliptical precessing disc (instead of tidally induced spiral shocks) because in this case there would be an even probability of framing the structures (fixed in the frame rotating with the precessing disc) at any orientation – which is hard to reconcile with the fact that in all Doppler tomograms and eclipse maps the asymmetries are seen roughly at the same azimuths.
We now turn our attention to the disc structures in the emission line maps. Velocity-resolved light curves and eclipse maps in He I and H are shown, respectively, in Figs. 4 and 5. For illustration purposes, open symbols depict the corresponding net emission line light curves (obtained by subtraction of an average of the two adjacent continuum light curves in each case).
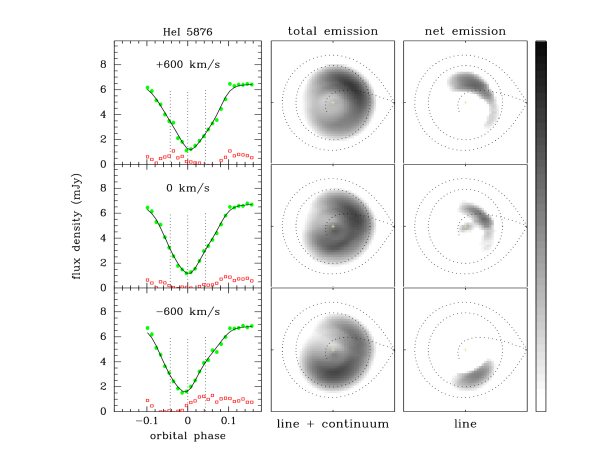
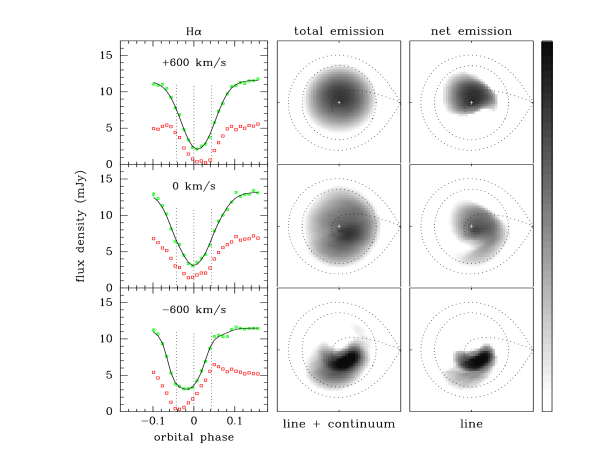
The eclipse maps in the middle panels correspond to the total emission (line + continuum), while those in the right-hand panels show the net line emission. The net emission maps were derived by combining the continuum maps on both sides of the line and subtracting the resulting average continuum map from the line + continuum map. Only the regions in which the intensities are positive are shown in the net emission maps.
Hereafter, we will refer to the line + continuum light curve (or eclipse map) simply as the line light curve (or eclipse map).
The He I line light curves display the same asymmetric ‘V’ shape of the continuum bands, but the strength of the bulges changes with velocity. The sequence of light curves across the line (Fig. 4, left-hand panels) shows the expected behaviour for the eclipse of gas rotating in the prograde sense (the classical rotational disturbance), with the blue side of the line () being eclipsed earlier than the red side (). However, the eclipse maps in the symmetric velocity bins do not show the reflection symmetry (over the line joining both stars) expected for line emission from a symmetric Keplerian disc around the white dwarf. In fact, the He I eclipse maps (middle panels) show the same two asymmetric arcs of the continuum maps, with the interesting addition that the receding arc (i.e., the one in the upper right quadrant of the map) is stronger in the red side and the approaching arc (lower left quadrant) is stronger in the blue side of the line. Aside from the expected contribution by low (projected) velocity material running roughly along the disc regions closest to the secondary star, the line centre map shows a compact, low-velocity emitting region at disc centre, emphasizing the non-Keplerian distribution of the emitting gas. The two remaining velocity-resolved maps (at , not shown in Fig. 4) are hardly distinguishable from the neighbouring continuum maps, indicating that there is no significant He I (net) emission at high velocities. Similar results are found for the He I line. These results suggest that the high-velocity emitting regions close to the white dwarf are veiled by low-velocity material, in agreement with the fact the He I line profiles are relatively narrow (both lines disappear in the continuum at velocities of about ). This could be another manifestation of outflowing gas in a disc wind arising from close to the white dwarf.
Thus, the double-peaked profiles of the He I lines are not from a symmetric Keplerian disc but are produced by the two-armed spirals. Since the spirals extend up to large disc radii, the outer parts of them are still visible at mid-eclipse, leading to the residual He I double-peaked emission seen in the mid-eclipse spectrum (Fig. 2).
A rotational disturbance effect is also clearly visible in the H light curves. This leads to eclipse maps in which the intensity distribution moves from the approaching to the receding side of the disc for increasing velocities. There are, however, significant differences with respect to the He I line. The H eclipse shapes are narrower and more symmetric than those of He I, leading to single-mode brightness distributions concentrated towards the inner disc regions. As with the He I maps, there is no reflection symmetry for the eclipse maps of the symmetric velocity bins, while the line centre map reveals that most of the inner disc is covered by low velocity gas – again indicating that a substantial contribution to the emission comes from sources other than gas in Keplerian orbits. Perhaps more important, there is no evidence of the two-armed spiral structure clearly seen in the continuum and He I maps (the strong asymmetric structure seen in the blue bin map sits at a different azimuth and at a much smaller radius than the spiral arm in the continuum and He I maps). This suggests that the H emission arises from a large, vertically-extended and optically thick region that veils the high-velocity gas close to disc centre and the continuum emission from the spiral shocks. We interpret this region as an outflowing and opaque (close to the orbital plane) disc wind. Further evidence in support of this interpretation will be given in section 4.3.
Steeghs et al. (1996) found a narrow (), nearly stationary H emission component in IP Peg at a similar outburst stage (some 8 days after the onset of the outburst) which is only partially occulted during eclipse. They attributed this emission to stationary slingshot prominences caused by extended magnetic loops from the chromospherically active secondary star. Unfortunately, our relatively wide () line centre passband is not appropriate to map/resolve such narrow, low-velocity component.
We end this section by remarking that conservation of angular momentum implies that any extended emitting region around the white dwarf should display the classical rotational disturbance. However, our results reveal that neither the He I nor the H lines are produced in a Keplerian disc. The He I lines trace the two armed spiral shocks, while the H line probably traces an outflowing (and spiraling) disc wind. These results are consistent with the Doppler maps of Steeghs et al. (1996), who show that 8 days after the onset of the outburst the spirals are still clear in He I but are no longer evident in H.
4.2 Spatially-Resolved Spectra
Each of the eclipse maps yield spatially-resolved information about the emitting region on a specific wavelength range. By combining all narrow-band eclipse maps we are able to isolate the spectrum of the accretion disc for any desired region.
The annular regions defined for the extraction of spatially-resolved spectra are shown in Fig. 6. In order to investigate the emission from the different light sources we divided the maps into five annular sections aimed to separate the emission from the inner disc regions (labeled as regions A and B) and the spiral arms (regions C and D) as well as a spiral-free disc region at the same distance from disc centre (region E).
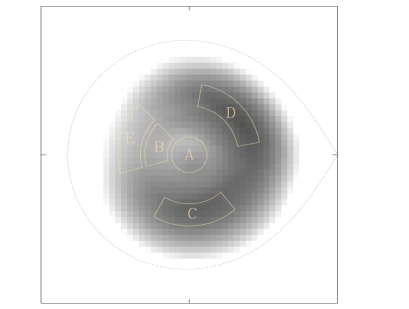
The central annular region, A, has a radial width of while the remaining regions have widths of . Regions C, D and E cover the same range of radii, namely, . The range in azimuth covered by the regions B and E was chosen in order to minimize contamination by light from the spiral arms. Each spectrum is obtained by averaging the intensity of all pixels inside the corresponding annulus and the statistical uncertainties affecting the average intensities are estimated with the Monte Carlo procedure described in section 3.2. The spectra are given in units of flux density per pixel which is, therefore, independent of the assumption about the distance to IP Peg. Changes in the definition of the annular regions by in radius and radial width and by in azimuth and azimuthal range result in changes in the extracted spectra of the same order of the quoted statistical uncertainties.
The spatially-resolved spectra are displayed in Fig. 7. The inner disc regions show an emission line spectrum with a strong and broad H component superimposed on a flat continuum. This is in marked contrast with the results obtained for the nova-like variables UX UMa (Rutten et al. 1994; Baptista et al. 1998) and UU Aqr (Baptista et al. 2000b), the inner disc regions of which show deep and narrow absorption lines over a strong blue continuum. Since the binary inclination of IP Peg is similar to that of UU Aqr (, Baptista, Steiner & Cieslinski 1994b), this difference cannot be attributed to inclination effects. The orbital periods and mass ratios of these two binaries are also comparable (UU Aqr has and , Diaz & Steiner 1991, Baptista et al. 1994b). Hence, this result suggests that different physical conditions hold in the inner disc regions of these binaries.
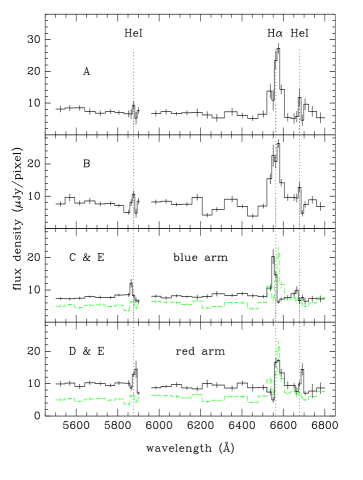
The differences between the H and He I lines are clear. The H line has a in the inner disc regions (A and B) which decreases to in regions C, D and E, whereas the He I emission lines are narrow everywhere, with a . The greatest contribution to the integrated H emission comes from the inner disc regions. The equivalent width of H is Å in regions A and B (twice that of the integrated, out of eclipse spectrum), and reduces to Å in the outer regions C, D and E. The strength of the H line is the same in the spirals and in the spiral-free disc region E, emphasizing that H is not a good tracer of the spiral arms at this late outburst stage. On the other hand, the He I lines are dominated by contributions from the spiral arms. The equivalent width of the He I lines at regions C and D is Å, while they are weakly in emission in the inner disc regions ( Å) and disappear in the continuum in the outer disc (region E). This underscores the conclusion of section 4.1 that the H and the He I lines are produced in different regions.
All lines are seen blueshifted in the spectrum of the approaching arm (labeled blue arm in Fig. 7) and redshifted in the spectrum of the receding arm (red arm), which is another way of seeing that the gas rotates in the prograde sense. The comparison of the spectrum of region E with those of regions C and D shows that the continuum in the spirals is slightly bluer than in the spiral-free disc region at same radii, suggesting that the gas in the spirals is somewhat hotter than in the neighbouring disc regions. The average continuum flux level is roughly the same in the inner and outer, spiral-free disc regions, , indicating a flat radial temperature distribution in the accretion disc (section 4.4).
4.3 The uneclipsed light
The uneclipsed component was introduced in the eclipse mapping method to account for the fraction of the total light which is not coming from the accretion disc plane (e.g., light from the secondary star or from a vertically-extended disc wind). However, detailed simulations by Wood (1994) show that it is usually impossible to distinguish between a flared disc and an uneclipsed component to the total light. Both effects lead to the appearance of spurious structures in the disc regions farther away from the secondary star (the left hemisphere of the eclipse maps of Figs. 3, 4 and 5, hereafter called the ‘back’ side of the disc) and eclipse maps obtained with either model may lead to equally good fits to the light curve. Baptista & Catalán (2001) pointed out that if the uneclipsed component is caused by an optically-thin, vertically-extended disc wind, the uneclipsed spectrum should show a Balmer jump in emission plus strong emission lines, while in the case of a flared disc the spurious uneclipsed spectrum should reflect the difference between the disc spectrum of the back (deeper atmospheric layers seen at lower effective inclinations) and the front (upper atmospheric layers seen at grazing incidence) sides and should mainly consist of continuum emission filled with absorption lines. Our spectral mapping results allow to test their prediction.
Fig. 8 shows the spectrum of the uneclipsed component. It is dominated by a strong, blueshifted and narrow H emission line superimposed on a red continuum. The He I line is marginally in emission while He I is absent. From these spectral features and the above discussion we conclude that the observed uneclipsed component is not an artifact caused by erroneously using a flat eclipse map to reconstruct a flared disc, but indeed corresponds to light coming from sources other than the accretion disc in the orbital plane.

In order to understand the uneclipsed spectrum, we first have to evaluate the contribution from the secondary star. Martin, Jones & Smith (1987) estimated the spectral type of the IP Peg secondary star to be M3-5, while Catalán, Smith & Jones (2001) used the TiO line-depth ratio to refine this estimate to MV. The former authors found a lower limit distance estimate of from the remaining infrared flux at mid-eclipse. The spectrum of an M5V star scaled to a distance of is depicted in Fig. 8 as a dashed line. The star flux is reduced if the distance is made larger. This exercise shows that, although the uneclipsed spectrum can easily accommodate the light from an M5V secondary star, the emission from such a star is not enough to account for the uneclipsed flux at the longer wavelengths. Choosing a secondary star of later spectral type does not overcome the mismatch (later spectral types lead to TiO absorption bands that are significantly stronger than observed). On the other hand, heating of the secondary star by irradiation from the hot, inner disc regions cannot be responsible for the extra uneclipsed light because the heated hemisphere (the one facing the white dwarf) is occulted during eclipse. Thus, there must be another source of light contributing to the uneclipsed spectrum.
The (extra) uneclipsed continuum increases towards longer wavelengths suggesting that the Paschen jump is in emission. Together with the H emission line, this indicates that the extra light consists of emission from optically thin gas from outside the orbital plane, probably arising in a vertically-extended disc wind. Our explanation for the inferences drawn from the H eclipse maps (section 4.1) and the uneclipsed spectrum follows that of Baptista et al. (2000b): the extended wind is dense and opaque close to the orbital plane (thus hiding the inner disc regions and the spirals from view) and becomes progressively transparent as the outflowing gas spreads over an increasing surface area (leading to optically thin emission farther out of the orbital plane).
We estimate the fractional contribution of the uneclipsed, optically thin gas to the total flux by dividing the flux of the uneclipsed light (after subtraction of the contribution from an assumed M5V secondary star) by the average out of eclipse level at that passband. The uneclipsed H line flux amounts to 12 per cent of the total flux at that wavelength. The uneclipsed continuum contributes an increasing fraction of the total flux for longer wavelengths, reaching 10 per cent at the red end of the spectrum. These numbers are significantly lower than the values of, respectively, 60 and 20 per cent found by Baptista et al. (2000b) for the nova-like UU Aqr, probably reflecting the different physical conditions between the accretion discs of nova-like’s and outbursting dwarf novae suggested in section 4.2. For example, the strong He I emission lines in the uneclipsed spectrum of UU Aqr (Fig. 10 of Baptista et al. 2000b) and the virtual absence of these lines in the spectrum of Fig. 8 suggests that the outflowing gas is cooler in IP Peg.
Finally, we remark that the lack of evidence of a flared disc in the uneclipsed spectrum, per se, is not enough to discard the possibility that the accretion disc of IP Peg is flared. If the half disc opening angle, , is so large that essentially all of the disc surface is hidden from view by the extended disc rim (as it should be if ), no front-back asymmetry is expected.
4.4 Radial temperature distribution
It has been a usual practice to convert the intensities in the eclipse maps to blackbody brightness temperatures and then compare them to the radial run of the effective temperature predicted by steady state, optically thick disc models. A criticism about this procedure is that a monochromatic blackbody brightness temperature may not always be a proper estimate of the disc effective temperature. As pointed out by Baptista et al. (1998), a relation between these two quantities is non-trivial, and can only be properly obtained by constructing self-consistent models of the vertical structure of the disc. Nevertheless, the brightness temperature should be close to the effective temperature for the optically thick disc regions.
Bobinger et al. (1997) analyzed light curves of IP Peg on the early decline from an outburst to find that the radial brightness temperature distribution is essentially flat (with temperatures decreasing during that outburst stage from about 9000 to ), in a clear disagreement with the radial dependence predicted by the steady state disk model (). They raised various possibilities to explain the flatness of the temperature distribution (hole in inner disc regions, high disc rim, optically thick wind sphere) without finding a compelling explanation for it.
A possibility not considered at that time is that the emission from the spiral arms distorts the results by artificially enhancing the intensities (and brightness temperatures) in the outer disc regions. We tested this possibility by computing the distribution for a disc section (slice of pizza) covering a range of azimuths identical to those of regions B and E in order to minimize contamination by light from the spiral arms. The blackbody brightness temperature that reproduces the observed surface brightness at each pixel was calculated assuming distances of 130 pc and 200 pc to the system (with no reddening included). The disc section was then divided in radial bins of and a median brightness temperature was derived for each bin. These are shown in Fig. 9 as interconnected squares.
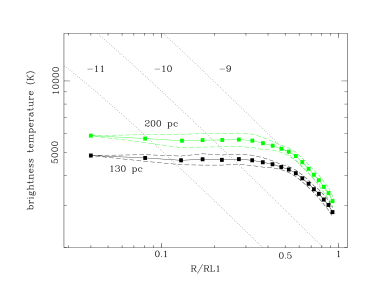
The dashed lines show the 1- limits on the average temperatures. Steady-state disc models for mass accretion rates of , , and yr-1 are plotted as dotted lines for comparison.
The distribution is flat, in agreement with the results of Bobinger et al. (1997), with temperatures of about (for ) or (if is assumed) in the whole disc (). The temperatures are systematically lower than those derived by Bobinger et al. (1997), probably because our observations correspond to a later stage of the decline than theirs. The agreement between the observed distribution and the law in the outer regions of the map () is fortuitous: it corresponds to the radii at which the intensities drop fast as the disc rim is reached.
We can therefore safely exclude the emission from the spiral arms as the cause of the observed flat radial temperature distribution of IP Peg in outburst.
As suggested by Morales-Rueda et al. (2000) and Webb et al. (1999), it could be that during outbursts the half disc opening angle in IP Peg is so large () that essentially all of the disc surface remains hidden from view by a thick disc rim and only the vertically-extended spiral arms and disc wind emission can be observed. In this case the occultation of the thick disc rim by the secondary star leads to a shallow, ‘V’ shaped eclipse (if the rim has an approximately uniform surface brightness distribution) and the resulting eclipse map naturally shows a flat (spurious) radial temperature distribution (see the simulations of Bobinger et al. 1997).
However, the evidences in favour of a large disc opening angle in IP Peg during outbursts are not yet conclusive. The large values of the models by Webb et al. (1999) are the direct consequence of the assumption that the outbursting disc brightness distribution is that of an optically thick steady-state disc model222 With the steep distribution, the only way of preventing an ‘U’ shaped, sharp and deep eclipse is to make the disc rim so high as to cover most (if not all) of the disc surface. . Although this may indeed be the case during the plateau phase of long-lasting outbursts, it is probably not generally true on the course of an outburst (see, e.g., Rutten et al. 1992b and Baptista & Catalán 2001). Doppler maps of the Balmer lines during outburst show that the line emission from the secondary star is displaced from the L1 point towards its centre of mass and that no emission is seen from its equator, leading Morales-Rueda et al. (2000) to the conclusion that the secondary star is shielded from the inner disc emission by a significantly thick disc rim (). These maps were computed assuming a semi-amplitude of the secondary star radial velocity of . The of IP Peg is uncertain by due to the effects of irradiation (e.g., Warner 1995). If the revised value of Beekman et al. (2000) is used, the Roche lobe of the secondary star is displaced upward in the Doppler maps, therefore pushing the line emission towards the L1 point and reducing the need of a large disc opening angle to explain the observations.
The most promising interpretation put forward by Bobinger et al. (1997) to explain the flat radial temperature distribution and its time evolution on the decline from maximum is that of an optically thick and geometrically flat wind-layer over the disc surface decreasing in radius along the decline from outburst. This is consistent with the inferences drawn from the H line maps (section 4.1). However, this scenario also has problems. It predicts that any asymmetric structure in the underlying disc would be screened by the opaque wind-layer, which is hard to reconcile with the conspicuous spiral arcs seen in the continuum and He I eclipse maps unless the vertical extent of the spiral arms is larger than that of the veiling wind-layer. On the other hand, the H maps require that the photosphere of the opaque wind-layer in this line is at a higher height than the spirals.
4.5 H surface brightness distribution
The top panel of Fig. 10 shows the radial intensity distribution for H and the adjacent continuum in a logarithmic scale.
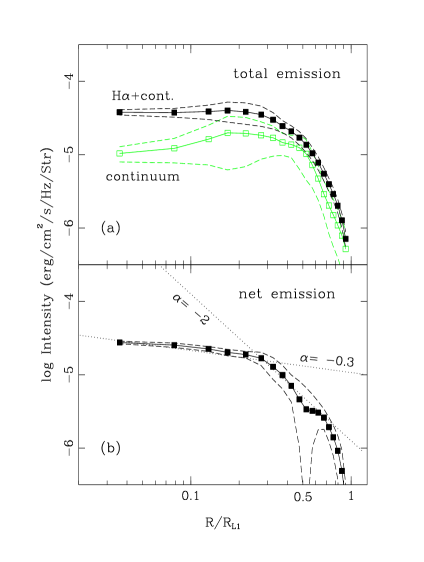
The eclipse maps were divided in radial bins of and a median intensity was computed for each bin. These are shown in Fig. 10 as interconnected squares. The dashed lines show the 1- limits on the average intensity. The line distribution is obtained from the average of all velocity-resolved maps across the line, while the continuum distribution is obtained from the average of eclipse maps on both sides of the line. The H net line emission surface brightness radial profile was computed by subtracting the distribution of the adjacent continuum from that of the line, and is shown in the lower panel. The large dispersion seen in the intermediate regions of the continuum distribution reflect the large asymmetries caused by the spiral arms. In the external map regions () the intensities of both line and continuum drop by a factor with respect to the inner disc regions, making the computation of the net emission quite noisy and unreliable.
H is seen in emission (intensities larger than those at the adjacent continuum) at all disc radii and up to . There are clearly two different emission regimes. The emission-line surface brightness is almost flat in the inner disc regions, for , but decreases sharply with radius in the outer disc, for . This is in line with the results of Marsh & Horne (1990). They found that in quiescence the Balmer lines show a steep surface brightness distribution, , while in outburst the surface distribution flattens in the inner disc regions () with a decreasing slope for the lower lines of the Balmer series. The observed behaviour suggests that the emission from the outer disc regions may be powered by the same mechanism producing the quiescent Balmer lines, whereas the H from the inner disc arises in the opaque outflowing wind by a different line emission mechanism, possibly photoionization by radiation from the boundary layer (Marsh & Horne 1990).
5 Conclusions
We analyzed time-resolved optical spectroscopy of the dwarf nova IP Pegasi on the late decline from the May 1993 outburst with eclipse mapping techniques in order to investigate the structure and the spectrum of its accretion disc. The main results of this study can be summarized as follows:
-
1.
The continuum light curves exhibit an asymmetric ‘V’ shape with broad bulges and results in eclipse maps with two asymmetric arcs extended both in radius [] and in azimuth (by ), interpreted as a two-armed spiral shock. Our results reveal that the spirals are still visible in the late stages of the outburst and their fractional contribution to the continuum emission is similar to that measured close to outburst maximum.
-
2.
The asymmetric arcs in our continuum maps are rotated in azimuth by ( of the binary cycle) in the retrograde sense in comparison with the eclipse map of BHS.
-
3.
Velocity-resolved light curves across the H and the He I lines show the classical rotational disturbance, with the blue side of the line being eclipsed earlier than the red side. The spiral arms are clearly seen in the He I maps, with the receding arm being stronger in the red side whereas the approaching arm is stronger in the blue side of the line. The double-peaked profiles of the He I lines are not from a symmetric Keplerian disc but are produced by the two-armed spirals. The analysis of the H maps suggests that the H emission arises from a large, vertically-extended and optically thick region which we interpret as an outflowing (and spiraling) disc wind.
-
4.
The inner disc regions show an emission line spectrum with a strong and broad H component superimposed on a flat continuum. This is in marked contrast with the results from the spectral mapping of nova-like variables of comparable binary parameters and suggests that intrinsically different physical conditions hold in the inner disc regions of outbursting dwarf novae and nova-like systems.
-
5.
The comparison of the spectrum of the spiral arms with that of a spiral-free disc region at same radius confirms that the He I lines are dominated by contribution from the spiral arms (with an equivalent width of Å) and suggests that the gas in the spirals is hotter than in the neighbouring disc regions.
-
6.
The spectrum of the uneclipsed light is dominated by a strong, blueshifted and narrow H emission line superimposed on a red continuum and can be understood as a combination of emission from an M5V secondary star plus optically thin emission from a vertically-extended disc wind. After subtraction of the contribution of the secondary star light, the uneclipsed H and continuum fluxes amount to, respectively, 12 and 10 per cent of the total flux at the corresponding wavelengths. These numbers are significantly lower than those found in spectral mapping experiments of the nova-like variables UX UMa and UU Aqr and suggest that the wind emission in the late stages of the outburst in IP Peg is considerably weaker than in those nova-like systems.
-
7.
The previously observed flat radial temperature distribution of IP Peg in outburst is not a distortion caused by the spiral arms. The radial temperature distribution computed from the spiral-free disc regions is still flat, with temperatures of about (for ) or (if is assumed) in the whole disc ().
-
8.
H is seen in emission (intensities larger than those at the adjacent continuum) at all disc radii and up to . The emission-line surface brightness is flat in the inner disc regions, for , but decreases sharply with radius in the outer disc, for .
Acknowledgments
We thank an anonymous referee for valuable comments and suggestions on an earlier version of the manuscript. In this research we have used, and acknowledge with thanks, data from the AAVSO International Database and the VSNET that are based on observations collected by variable star observers worldwide. We thank Er-Ho Zhang for kindly providing us with his unpublished band data. This work was partially supported by the PRONEX/Brazil program through the research grant FAURGS/CNPq 66.2088/1997-2. RB acknowledges financial support from CNPq/Brazil through grant no. 300 354/96-7.
References
- [1] Armitage P. J., Murray J. R., 1998. MNRAS, 297, L81
- [2] Baptista R., 2001. in Astro-Tomography: Indirect Imaging Methods in Observational Astrophysics, Springer-Verlag series: Lecture Notes in Physics, ed. H. Boffin & D. Steeghs, p. 307
- [3] Baptista R., Catalán M. S., 2001. MNRAS, 324, 599
- [4] Baptista R., Steiner J. E., 1993. A&A, 277, 331
- [5] Baptista R. et al., 1994a. in Interacting Binary Stars, ASP Conf. Series 56, ed. A. Shafter, ASP, San Francisco, p. 259
- [6] Baptista R., Steiner J. E., Cieslinski D., 1994b. ApJ, 433, 332
- [7] Baptista R., Steiner J. E., Horne K., 1996. MNRAS, 282, 99
- [8] Baptista R., Horne K., Wade R., Hubeny I., Long K., Rutten R. G. M., 1998. MNRAS, 298, 1079
- [9] Baptista R., Harlaftis E. T., Steeghs D., 2000a. MNRAS, 314, 727 (BHS)
- [10] Baptista R., Silveira C., Steiner J. E., Horne K., 2000b. MNRAS, 314, 713
- [11] Beekman G., Somers M., Naylor T., Hellier C., 2000. MNRAS, 318, 9
- [12] Bobinger A., Horne K., Mantel K.-H., Wolf S., 1997, A&A, 327, 1023
- [13] Catalán M.S., Smith R. C., Jones D. H. P., 2001. MNRAS, in press
- [14] Diaz M. P., Steiner J. E., 1991. AJ, 102, 1417
- [15] Frank J., King A. R., Raine D. J., 1992. Accretion Power in Astrophysics - 2nd edition, Cambridge University Press, Cambridge
- [16] Harlaftis E. T., Steeghs D., Horne K., Martín E., Magazzú A., 1999. MNRAS, 306, 348
- [17] Hessman F., 1989. AJ, 98, 675
- [18] Horne K., 1985. MNRAS, 213, 129
- [19] Horne K., 1986. PASP, 98, 609
- [20] Marsh T. R., 1988. MNRAS 231, 1117
- [21] Marsh T. R., Horne K., 1988. MNRAS, 235, 269
- [22] Marsh T. R., Horne K., 1990. ApJ, 349, 593
- [23] Martin J. S., Jones D. H. P., Smith R. C., 1987. MNRAS 224, 1031
- [24] Massey P., Strobel K., Barnes J. V., Anderson E., 1988. ApJ, 328, 315
- [25] Morales-Rueda L., Marsh T. R., Billington I., 2000. MNRAS 313, 454
- [26] Oke J. B., Gunn J. E., 1983. ApJ, 266, 713
- [27] Piché F., Szkody P., 1989. AJ, 98, 2225
- [28] Pringle J. E., Verbunt F., Wade R. A., 1986. MNRAS, 221, 169
- [29] Rutten R. G. M., van Paradijs J., Tinbergen J., 1992a. A&A, 260, 213
- [30] Rutten R. G. M., Kuulkers E., Vogt N., van Paradijs J., 1992b. A&A, 254, 159
- [31] Rutten R. G. M., Dhillon V. S., Horne K., Kuulkers E., 1994. A&A, 283, 441
- [32] Steeghs D., Horne K., Marsh T. R., Donati J. F., 1996. MNRAS, 281, 626
- [33] Steeghs D., Harlaftis E. T., Horne K., 1997. MNRAS, 290, L28
- [34] Stehle R., 1999. MNRAS, 304, 687
- [35] Warner B., 1995. Cataclysmic Variable Stars, Cambridge University Press, Cambridge
- [36] Webb N. A., Naylor T., Ioannou Z., Worraker W.J., Stull J., Allan A., Fried R., James N. D., Strange D., 1999. MNRAS 310, 407
- [37] Wolf S., Mantel K. H., Horne K., Barwig H., Schoembs R., Baernbantner O., 1993. A&A, 273, 160
- [38] Wood J. H., 1994. in Interacting Binary Stars, ASP Conf. Series 56, ed. A. Shafter, ASP, San Francisco, p. 48
- [39] Wood J. H., Crawford C. S., 1986. MNRAS, 222, 645