Abstract
We have organized an extensive multiwavelength campaign on BL Lacertae in the second half of 2000. Simultaneous or quasi-simultaneous observations were taken at radio frequencies, in the optical — carried out by the WEBT collaboration —, in X-rays — using BeppoSAX and RXTE —, and at VHE gamma-rays with the CAT and HEGRA Cherenkov telescope facilities. In this paper, we are presenting first results from this campaign. The WEBT optical campaign achieved an unprecedented time coverage, virtually continuous over several 10 – 20 hour segments, and revealed intraday variability on time scales of hours. The X-ray observations of Nov. 1 – 2, 2000, revealed significant variability on similar time scales, and provided evidence for the synchrotron spectrum extending out to keV during that time. At higher energies, the onset of the hard power-law commonly observed in radio-loud quasars and radio-selected BL Lac objects is seen. From the energy-resolved X-ray variability patterns, we find evidence that electron cooling might not be dominated by one single radiation mechanism; rather, a combination of synchrotron and Compton cooling seems to be required.
1 Introduction
BL Lacertae, historically the protypical BL Lac object, has been the target of many radio, optical, X-ray, and -ray observations in the past, and has been studied intensively during various intensive multiwavelength campaigns (e.g., Sambruna et al. 1999, Bloom et al. 1997, Madejski et al. 1999, Ravasio et al. 2002a). It is a particularly interesting object for detailed X-ray studies since it has been repeatedly observed that this is where the two broad components of the multiwavelength SEDs of blazars are overlapping and intersecting: While the low-frequency component, from radio to soft X-ray frequencies, is generally believed to be synchrotron emission from relativistic electrons in a relativistic jet, the high-energy component, at hard X-rays and -rays, is consistent with Compton emission from the same population of electrons, scattering their own synchrotron emission and/or soft photons originating external to the jet. In agreement with this hypothesis, the X-ray spectrum of BL Lacertae has repeatedly shown a concave shape (e.g., Madejski et al. 1999), with rapid variability, restricted to the low-energy excess portion of the spectrum (Ravasio et al. 2002a).
Whereas BL Lac objects are generally characterized by lineless, nonthermal optical spectra, BL Lacertae has occasionally shown strong, broad emission lines (Vermeulen et al. 1995) and is thus no longer considered a typical BL Lac object. The existence of emission lines reveals the presence of a non-negligible amount of scattering material in the broad line region (BLR), which is consistent with recent spectral modeling results of Madejski et al. (1999) and Böttcher & Bloom (2000), requiring a non-negligible external soft photon energy density to reproduce the simultaneous broadband spectrum of BL Lacertae during its giant outburst in 1997.
While simultaneous broadband spectra are very useful to constrain blazar jet models, there still remain severe ambiguities in their interpretation w.r.t. the dominant electron cooling, injection, and acceleration mechanisms. The combination of broadband spectra with timing and spectral variability information can help to break some of these degeneracies. For this reason, we have organized an intensive multiwavelength campaign to observe BL Lacertae in the second half of 2000 at as many frequencies as possible. We have put special emphasis on good timing information, which we have obtained, in particular, at optical and X-ray frequencies. In Section 2, we briefly review the observations carried out during the campaign. The diverse variability patterns are presented and analyzed in Section 3. The most detailed simultaneous broadband spectrum obtained during the campaign is discussed in Section 4.
2 Observations
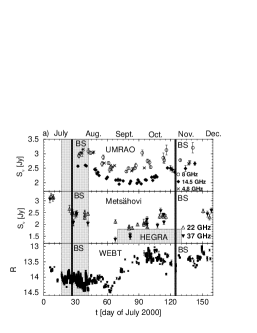
The broadband campaign on BL Lacertae in 2000 encompassed observations at radio, optical, X-ray, and VHE -ray energies during the period July 17, 2000, until the end of 2000. At radio frequencies, the object was monitored using the University of Michigan Radio Astronomy Observatory (UMRAO) 26 m telescope, at 4.8, 8, and 14.5 GHz, and with the 14 m Metsähovi Radio Telescope of Helsinki University, at 22 and 37 GHz.
Focusing on a core campaign period July 17 – Aug. 11, BL Lacertae was the target of an intensive optical campaign by the Whole Earth Blazar Telescope (WEBT, Villata et al. 2000), in which 24 optical telescopes throughout the northern hemisphere participated. For more details of the WEBT campaign and its results, see Villata et al. (2002; see also Raiteri et al. 2002 and http://www.to.astro.it/Groups/Extragal/2200.htm). The radio and optical R-band light curves, along with the overall timeline of the campaign, are shown in Fig. 1a. The figure illustrates that BL Lacertae underwent a transition from a rather quiescent state in July and August 2000 to an extended high state in mid-September 2000. For this reason, the WEBT campaign was extended until the end of 2000, although with less dense time coverage than during the core campaign.

At X-ray energies, BL Lacertae was observed with the BeppoSAX Narrow Field Instruments (NFI) in the energy range 0.1 – 300 keV in two 25 ksec pointings on July 26 – 27 and Nov. 1 – 2, 2000 (Ravasio et al. 2002b). In addition, the source was monitored by the Rossi X-ray Timing Explorer (RXTE) in 3 short pointings per week (Marscher et al. 2002); however, the results of those observations were not yet available at the time of this workshop, and will be included in the final analysis of this campaign later.
BL Lacertae has been observed by the HEGRA system of imaging Cherenkov telescopes, accumulating a total of 10.5 h of on-source time in Sept. – Nov. 2000. The source was not detected above a 99 % CL upper limit of 25 % of the Crab flux at photon energies above 0.7 TeV (Mang et al. 2001). The Cherenkov Array at Thémis (CAT) had also observed BL Lacertae during 4 nights between July 26 and Aug. 8 for a total of hr. However, due to poor weather conditions, those observations did not yield useful flux constraints. We had also been awarded observations with OSSE and COMPTEL on board the Compton Gamma-Ray Observatory (CGRO); however, unfortunately, the CGRO was de-orbited just around the time of our scheduled observations.
3 Radio, Optical and X-ray Variability
The radio and optical light curves of BL Lacertae over the entire campaign period are shown in Fig. 1a. We have calculated the discrete cross-correlation functions between the optical and radio bands as well as between the light curves at different radio frequencies. We found delays between different radio frequencies with the lower-frequency variability lagging behind the higher-frequency light curves by up to days, with the lags generally increasing with increasing frequency separation. The frequency dependence of the lags is not well described by power-law fits, but rather shows a gradual flattening towards the lowest frequencies. We found evidence for a positive correlation between the optical and radio light curves, indicating a delay of the radio light curves with respect to the R band of – 50 d. However, our data are spanning only a few months. Bregman et al. (1990) had found typical radio – optical correlations in BL Lacertae with delays of – 4.5 years, so that we will have to combine our intermediate-term light curves with long-term, historical light curves before drawing firm conclusions from these delays.
The WEBT campaign returned optical (R-band) light curves of unprecedented time coverage and resolution. Two examples of the observed rapid microvariability are shown in Fig. 1b. Brightness variations of , corresponding to flux variations of , within hr have been found, which is not exceptional for this source, and might indicate that BL Lacertae was in a rather quiescent state. However, this does place a constraint on the size of the emitting region of cm, where is the Doppler beaming factor.


From the BeppoSAX X-ray data, we have extracted light curves with 10-minute sampling, in the energy bands (0.6 – 2) keV (LECS), (2 – 4) keV (MECS), and (4 – 7) keV (MECS). We also calculated the hardness ratios HR1 (LECS [2 - 4 keV])/(LECS [0.6 - 2 keV]) and HR2 (MECS [4 - 7 keV])/(MECS [2 - 4 keV]) with the same 10-minute sampling (see Ravasio et al. 2002b). During our first pointing on July 26 – 27, no evidence for short-term variability was found. The spectrum was hard (energy index ), consistent with the hypothesis that the entire BeppoSAX spectrum was dominated by the SSC emission from low-energy electrons in the jet.
The results of our second BeppoSAX pointing on Nov. 1 – 2 were quite different. The light curves in all three LECS and MECS energy bands exhibited significant variability. Flux variations by a factor of within minutes were detected. The LECS + MECS spectrum was well fitted with a steep power-law with energy index up to keV; the PDS spectrum above keV indicated a significant spectral upturn, consistent with the onset of the SSC component around keV. The following discussion of the X-ray variability and the broadband spectrum of BL Lacertae during our campaign will focus on the results of this second observation on Nov. 1 – 2.
From the measured fluxes and hardness ratios, we have constructed hardness-intensity correlations (HICs). As an example, we show in Fig. 2a the various HICs for an individual flare, spanning a total of hr. Whereas in the HICs at soft X-ray energies, there is some indication of the typical clockwise rotation patterns which have also been observed in the X-ray spectral variability of high-frequency peaked BL Lac objects (HBLs, e.g., Mrk 421: Takahashi et al. 1996), we also find some correlations indicating the opposite behavior (i.e. counter-clockwise rotation patterns) as well as straight hardness-intensity anti-correlations in some of our soft X-ray HICs. Interestingly, such diverse HIC patterns have been predicted through numerical simulations of HBL flaring behaviour in a pure SSC model by Li & Kusunose (2000) under certain conditions: As long as the electron energy losses are dominated by synchrotron cooling, the synchrotron part of the spectrum was predicted to exhibit clockwise HIC rotation patterns; when SSC cooling becomes important, the synchrotron HICs turn into straight anti-correlations.
Our currently available BeppoSAX data have too large error bars due to limited photon statistics to draw firm conclusions on the basis of the measured HICs. However, if those results can be confirmed by future observations with Chandra or XMM-Newton, they may provide a new tool to constrain the dominant cooling mechanism of the electrons responsible for the synchrotron emission of BL Lacertae at soft X-ray energies.
Additional constraints on the physical parameters of the emitting region and on the dominant electron cooling mechanism can be obtained if one can determine the photon energy dependence of the decay time scale of individual flares. In the two extreme cases in which either synchrotron or SSC emission is dominating the electron cooling, the cooling time scale (in the observer’s frame) of electrons emitting synchrotron radiation at a photon energy keV, is
| (1) |
(Chiang & Böttcher 2002), where is a normalization factor depending on the spectral index and the low-energy cutoff of the injected electron distribution as well as the Thomson depth of the emitting region. The available data do not have sufficient photon statistics to allow us to exploit these relations for individual flares. However, an alternative route to extract information about the average physical conditions responsible for the observed X-ray flares, is to compute the autocorrelation functions of the X-ray variability in the three LECS + MECS energy bands and represent the widths of those autocorrelation functions as , where corresponds to a minimum width given primarily by the light-travel time through the source and the electron injection time scale. The result of this procedure is illustrated in Fig. 2b. Obviously, we can not distinguish between the two extreme cases of synchrotron vs. SSC cooling on the basis of the quality of the fit. However, important insight can be gained by deriving an estimate of the magnetic field from the normalizations of the two fits. For the case of pure synchrotron cooling, we find G, while for dominant SSC cooling, we find G. This is at least an order of magnitude larger than the magnetic-field values found in earlier analyses of broadband spectra of BL Lacertae (e.g., Madejski et al. 1999, Böttcher & Bloom 2000).
One can derive an independent estimate of the magnetic field based on the optical synchrotron flux at the time of the X-ray observations. Assuming that the peak of the synchrotron spectrum is in the optical domain during this period (see section 4), and that the magnetic field is in approximate equipartition with the electrons in the jet, we find G. Again, this is about an order of magnitude lower than the two estimates derived from the X-ray variability in the extreme cases of pure synchrotron or pure SSC cooling. This might be another indication that the electron cooling is probably not dominated by one single mechanism, and that possibly additional electron cooling due to Compton scattering of external soft photons could be required in order to reconcile the variability and spectral properties found in our observations.
4 Broadband spectrum
The simultaneous broadband spectrum of BL Lacertae during the second BeppoSAX pointing on Nov. 1 – 2, 2000, is shown in Fig. 3. For comparison, we also show the spectrum measured during the source’s major outburst in July 1997 (Bloom et al. 1997). The optical (UBVRI) photometric data have been de-reddened using the de-reddening law of Cardelli et al. (1989) with (Sambruna et al. 1999) and . The error bars on the optical data points represent the range of variability measured during those two days in the respective optical bands.

The HEGRA upper limit on the integrated TeV photon flux was converted to a flux limit by assuming a power-law shape of the spectrum with photon index , which leads to Jy Hz at 0.7 TeV. The resulting limiting spectrum is shown for in Fig. 3.
The comparison between the two spectra of BL Lacertae illustrates the dramatic spectral change at soft to medium-energy X-rays, and clearly demonstrates that we are observing the high-energy end of the low-frequency (synchrotron) component in the LECS + MECS spectrum. It is particularly interesting to note that the best-fit spectral index of measured at soft X-rays is very close to the canonical value of expected for the time-averaged synchrotron spectrum of strongly cooling electrons if the energy losses are dominated by SSC cooling (Chiang & Böttcher 2002).
The spectrum has been modeled with the time-dependent jet radiation transfer code described in Böttcher & Bloom (2000). The most relevant changes of the best-fit model parameters with respect to the fit to the 1997 flare spectrum correspond to an extension of the injected electron spectrum towards both lower and higher energies (i.e. decreasing and increasing ). Our spectral modeling results are consistent with the tentative result from our timing analysis that synchrotron, SSC, and external-Compton cooling all contribute significantly to the bolometric luminosity of the source and, consequently, to the electron cooling.
Acknowledgements
The work of M.B. is supported by NASA through Chandra Postdoctoral Fellowship Award no. 9-10007, issued by the Chandra X-ray Center, which is operated by the Smithsonian Astrophysical Observatory for and on behalf of NASA under contract NAS 8-39073.
References
- 1 Bloom S. D. et al.: 1997, Astrophys. J. Lett. 490, L145.
- 2 Böttcher M. & Bloom S. D.: 2000, Astron. J. 119, 469.
- 3 Bregman J. N. et al.: 1990, Astrophys. J. 354,, 574.
- 4 Cardelli, A. C., Clayton, G. C., & Mathis, J. S.: 1989, Astrophys. J. 345, 245
- 5 Chiang, J. & Böttcher M.: 2002, Astrophys. J. 564, 92.
- 6 Li H. & Kusunose M.: 2000, Astrophys. J. 536, 729.
- 7 Madejski G. et al.: 1999, Astrophys. J. 521, 145.
- 8 Mang, O. et al.: 2001, in proc.of the 27th ICRC, 2658.
- 9 Marscher A. P. et al.: 2002, in preparation.
- 10 Raiteri, C. M., et al., 2002, these proceedings.
- 11 Ravasio M. et al.: 2002a, Astron. Astrophys., in press.
- 12 Ravasio M. et al.: 2002b, in preparation.
- 13 Sambruna R. et al.: 1999, Astrophys. J. 515, 140.
- 14 Takahashi T et al.: 1996, Astrophys. J. Lett. 470, L89.
- 15 Vermeulen R. C. et al.: 1995, Astrophys. J. Lett. 452, L5.
- 16 Villata M. et al.: 2000, Astron. Astrophys. 363, 108.
- 17 Villata M. et al.: 2002, Astron. Astrophys. ,, submitted.
- 18