A morphological comparison between the central region in AGN and normal galaxies using HST data††thanks: Based on observations made with the NASA/ESA Hubble Space Telescope, obtained from the data archive at the Space Telescope Science Institute. STScI is operated by the Association of Universities for Research in Astronomy, Inc., under the NASA contract NAS5–26555.
We study the morphology of the central region of a sample of Active
Galactic Nuclei (AGN) and a “control” sample of normal galaxies using
archival observations of the WFPC2 instrument onboard the Hubble
Space Telescope (HST). We use the ellipse fitting technique in order to
get a good description of the inner “smooth” light distribution of the
galaxy. We then divide the observed galaxy image by the artificial image
from the fitted ellipses in order to detect morphological signatures in
the central region around the nucleus of the galaxy. We perform
quantitative comparisons of different subgroups of our sample of galaxies
(according to the Hubble type and the nuclear activity of the galaxies) by
calculating the average amplitude of the structures that are revealed with
the ellipse fitting technique. Our main conclusions are as follows:
1) All AGNs show significant structure in their inner 100 pc and 1 kpc
regions whose amplitude is similar in all of them, independent of the
Hubble type of the host galaxy.
2) When considering early-type galaxies, non-AGN galaxies show no
structure at all, contrary to what we find for AGN.
3) When considering late-type galaxies, both AGN and non-AGN galaxies show
significant structure in their central region.
Our results are consistent with the hypothesis that all early-type
galaxies host a supermassive black hole, but only those that have enough
material in the central regions to fuel it show an active nucleus. The
situation is more complicated in late-type galaxies. Either not all of
them host a central black hole, or, in some of them, the material
inside the innermost 100 pc region is not transported to the scales of the
central engine for some reason, or the large amount of gas and dust hides
the active nucleus from our sight.
Key Words.:
Galaxies: active — Galaxies: Seyfert — Galaxies: structure1 Introduction
An open question in current AGN research is how the central black hole is being fed with matter. The interstellar medium of the host galaxy seems to be a good fuel source since gas and dust is found in large quantities inside galaxies. What is not clear though, is how matter is transported from galactic scales (kiloparsec scales) to the small scales (parsec scales) near the nucleus.
One mechanism that has been proposed for the fueling of the active nucleus is the existence of galactic bars (Shlosman 1990). Many statistical studies have been performed in order to examine this possibility. Among others, Xanthopoulos (1996) analyzed optical (V, R, I) observations of a sample of 27 AGN and concluded that only half of them are barred. Observations of AGN in the near-infrared (NIR) revealed that the fraction of galaxies that host bars is larger than previously thought (e.g. Mulchaey et al. 1997; Márquez et al. 1999). This is mainly because dust and star formation effects can mask the bar structures and thus make them invisible at optical wavelengths while these effects are not very important in the NIR wavelengths. Making use of NIR data, Mulchaey & Regan (1997) concluded that the incidence of bars in Seyfert and normal galaxies is similar, suggesting that Seyfert nuclei do not occur preferentially in barred galaxies.
Another mechanism that has been proposed for the fueling of AGN involves interactions between the host galaxy and companion galaxies. It is argued that a dynamical instability, caused by the tidal field of the companion during a merger may drive a large fraction of the gas into the inner regions of the galaxy (Hernquist 1989). Statistical studies have been made to examine the environments of Seyfert and normal galaxies and the percentage of companions around them. The results have been inconclusive and rather ambiguous. For example, Fuentes–Williams & Stocke (1988) and Bushouse (1986) concluded that there is not a detectable difference in the environments of Seyfert and normal galaxies. Dahari (1984) and Rafanelli et al. (1995) on the other hand, found that Seyfert galaxies have an excess of companions relative to normal galaxies.
Consequently, the observations so far have shown that bars and interactions are not responsible for fueling the AGN in all cases. However, irrespective of the mechanism that transports material close to the central source, there should be enough potential fuel (in the form of interstellar dust and gas) in the circumnuclear region of Seyfert galaxies. Indeed, recent HST observations have shown that the central regions in Seyfert galaxies are rich in gas and dust. Malkan et al. (1998) found fine-scale structures of various morphological types in the central regions of Seyfert 1 and 2 galaxies. Regan & Mulchaey (1999) and Martini & Pogge (1999), examined the central morphology of Seyfert galaxies with the use of color maps. They found significant structure, with gas and dust organized mainly in nuclear spiral dust lanes on scales of a few hundred parsec. These spiral dust lanes could be the channels by which the material from the host galaxy is transported into the central engine. Recently, Pogge & Martini (2002) presented archival HST images of the nuclear regions of Seyfert galaxies from the CfA Redshift Survey sample. They found that essentially all the Seyfert galaxies in their sample have circumnuclear structures which are connected with the large-scale bars and spiral arms in the host galaxies and could be related to the fueling of AGN by matter inflow from the host galaxy disks.
The studies mentioned above investigated the circumnuclear morphology in AGNs mainly. In the present work we compare the morphology of the central regions in AGN and non-AGN galaxies in order to search for signatures of the AGN fueling through differences that may exist. This comparison is necessary in order to understand the main reason that makes a galaxy host an active nucleus. There are two obvious reasons that could cause this effect, the first being the presence of a supermassive black hole in the center of the galaxy, and the second is the presence of matter near the central region which could provide the central black hole with the necessary fuel. Since there is now sufficient observational evidence which suggests that the majority (if not all) of the galaxies contain a central black hole (e.g. Kormedy & Gebhardt 2001), it is important to investigate whether the lack of the fuelling material is the main reason for the presence of nuclear activity.
We make use of HST observations of a group of nearby AGN and “normal” (i.e. non-AGN) galaxies which have similar distributions of distance, morphological classification, as well as inclination. Using the “ellipse fitting” technique, we uncover their central, overall morphology. Any localised excesses or deficits of emission (indicative of the presence of significant amount of gas/dust) should show up as deviations from the smooth isophotes. By measuring the average amplitude of these deviations we can investigate, in a quantitative way, whether the central regions of AGNs are significantly more “irregular” than those in normal galaxies.
The paper is organized as follows. In Sect. 2 we give information on the sample of the galaxies, and in Sect. 3 we describe the method that we follow in order to uncover the nuclear structure in the galaxies. In Sect. 4 we present our results. A discussion follows in Sect. 5, while a summary of our work is presented in Sect. 6.
2 The sample
For the purposes of this study we chose objects from the Palomar optical spectroscopic survey of nearby galaxies (Ho et al. 1995). These authors surveyed a nearly complete sample of 486 bright ( mag), northern () galaxies using the Palomar 5m telescope and derived a catalogue of emission-line nuclei, including a comprehensive list of nearby AGNs (Ho et al. 1997a). The selection criteria of the survey ensure that the sample is a fair representation of the local galaxy population. Furthermore, the proximity of the objects enables fairly good spatial resolution to be achieved, which is crucial for the objectives of the present work.
Ho et al. (1997a) have classified the galaxies in their sample into various subclasses of emission-line nuclei: H II nuclei, Seyfert nuclei, LINERs and “transition” objects (i.e. composite LINER/H II nuclei). Although a significant fraction of LINERs or transition objects could be genuine AGNs (e.g. Ho 2001 and references therein) we considered only the classical Seyfert 1s and 2s as representatives of the local AGN population. As representatives of the non-AGN population we considered only the H II galaxies and the galaxies that show no emission lines in their spectra. In total, there are 52 Seyfert nuclei and 263 non-AGN galaxies in the Palomar sample.
From this list of 315 objects we chose the galaxies that fulfiled the following criteria: (1) inclination smaller than , (2) they were observed with the WFPC2 instrument onboard the HST (before the end of 1999) and their central region was mapped with the Planetary Camera (PC), and (3) their central region was not overexposed. The small inclination criterion was imposed because we are interested in studying the innermost region of the galaxies which, in inclined systems, can be obscured due to projection and/or obscuration effects. Most of the HST observations of the Palomar sample have been performed with the WFPC2 instrument, hence, the choice to study the galaxies which are observed with this instrument. Finally, the requirement of PC observations of the central region was enforced in order to maximize the available spatial resolution (the pixel size of this camera is , while the field of view is ).
There are 58 galaxies (23 active and 35 non-active) that meet our criteria. Most of them were observed with the F555W and F606W filters (13 and 34, respectively), 10 objects were observed with the F547M filter, and 1 with the F569W filter. The difference between the effective wavelength of the various filters is small and should not influence our results. Table 1 lists the observational details (i.e. filter, exposure times and ID program number of the original observing program) of the 58 galaxies.
| NAME | Filter | Exposure | Proposal ID |
|---|---|---|---|
| (NGC) | (sec) | ||
| 1058 | F606W | 80 | 5446 |
| 1068 | F547M | 300 | 5479 |
| 1358 | F606W | 500 | 5479 |
| 1667 | F606W | 500 | 5479 |
| 2273 | F606W | 500 | 5479 |
| 2300 | F555W | 350 | 6099 |
| 2639 | F606W | 500 | 5479 |
| 2655 | F547M | 300 | 5419 |
| 2748 | F606W | 400 | 6359 |
| 2775 | F606W | 400 | 6359 |
| 2903 | F555W | 400 | 5211 |
| 2964 | F606W | 400 | 6359 |
| 3031 | F547M | 100 | 5433 |
| 3227 | F547M | 160 | 7403 |
| 3310 | F606W | 500 | 5479 |
| 3344 | F606W | 80 | 5446 |
| 3504 | F606W | 500 | 5479 |
| 3516 | F547M | 70 | 6416 |
| 3810 | F606W | 80 | 5446 |
| 3982 | F606W | 500 | 5479 |
| 4062 | F606W | 80 | 5446 |
| 4102 | F606W | 400 | 6359 |
| 4138 | F547M | 200 | 6837 |
| 4152 | F606W | 500 | 5479 |
| 4168 | F547M | 230 | 6837 |
| 4212 | F606W | 80 | 5446 |
| 4245 | F606W | 80 | 5446 |
| 4365 | F555W | 900 | 5920 |
| 4371 | F606W | 80 | 5446 |
| 4378 | F606W | 80 | 5446 |
| 4379 | F555W | 160 | 5999 |
| 4380 | F606W | 80 | 5446 |
| 4382 | F555W | 700 | 7468 |
| 4405 | F606W | 80 | 5446 |
| 4406 | F555W | 500 | 5454 |
| 4414 | F606W | 80 | 8400 |
| 4473 | F555W | 600 | 6099 |
| 4477 | F606W | 80 | 5446 |
| 4478 | F555W | 400 | 6587 |
| 4501 | F547M | 230 | 6837 |
| 4536 | F555W | 300 | 5375 |
| 4567 | F606W | 80 | 5446 |
| 4578 | F606W | 80 | 5446 |
| 4612 | F606W | 80 | 5446 |
| 4621 | F555W | 140 | 5512 |
| 4639 | F547M | 230 | 5381 |
| 4649 | F555W | 1100 | 6286 |
| 4660 | F555W | 230 | 5512 |
| 4694 | F606W | 500 | 5479 |
| 4698 | F606W | 400 | 6359 |
| 4800 | F606W | 80 | 5446 |
| 4900 | F606W | 80 | 5446 |
| 5033 | F547M | 230 | 5381 |
| 5194 | F555W | 600 | 5777 |
| 5273 | F606W | 400 | 8597 |
| 6217 | F606W | 500 | 5479 |
| 7479 | F569W | 600 | 6266 |
| 7743 | F606W | 500 | 5479 |
| NAME | Type | D | Scale | |||
|---|---|---|---|---|---|---|
| (NGC) | (Mpc) | (deg) | (pc/pixel) | |||
| 1058 | A(S2) | 5 | 9.10 | -18.25 | 21 | 2.00 |
| 1068 | A(S1.8) | 3 | 14.40 | -21.32 | 32 | 3.17 |
| 1358 | A(S2) | 0 | 53.60 | -20.95 | 38 | 11.80 |
| 1667 | A(S2) | 5 | 61.20 | -21.52 | 40 | 13.46 |
| 2273 | A(S2) | 0 | 28.40 | -20.25 | 41 | 6.25 |
| 2300 | NA | -2 | 31.00 | -20.69 | 44 | 6.82 |
| 2639 | A(S1.9) | 1 | 42.60 | -20.96 | 54 | 9.37 |
| 2655 | A(S2) | 0 | 24.40 | -21.12 | 34 | 5.37 |
| 2748 | NA | 4 | 23.80 | -20.29 | 70 | 5.25 |
| 2775 | NA | 2 | 17.00 | -20.34 | 40 | 3.74 |
| 2903 | NA | 4 | 6.30 | -19.89 | 63 | 1.39 |
| 2964 | NA | 4 | 21.90 | -20.11 | 58 | 4.82 |
| 3031 | A(S1.5) | 2 | 1.40 | -18.34 | 60 | 0.31 |
| 3227 | A(S1.5) | 1 | 20.60 | -20.39 | 48 | 4.53 |
| 3310 | NA | 4 | 18.70 | -20.41 | 40 | 4.11 |
| 3344 | NA | 4 | 6.10 | -18.43 | 24 | 1.34 |
| 3504 | NA | 2 | 26.50 | -20.61 | 40 | 5.83 |
| 3516 | A(S1.2) | -2 | 38.90 | -20.81 | 40 | 8.56 |
| 3810 | NA | 5 | 16.90 | -20.19 | 46 | 3.72 |
| 3982 | A(S1.9) | 3 | 17.00 | -19.47 | 30 | 3.74 |
| 4062 | NA | 5 | 9.70 | -18.65 | 67 | 2.13 |
| 4102 | NA | 3 | 17.00 | -19.54 | 56 | 3.74 |
| 4138 | A(S1.9) | -1 | 17.00 | -19.05 | 50 | 3.74 |
| 4152 | NA | 5 | 34.50 | -20.34 | 40 | 7.59 |
| 4168 | A(S1.9) | -5 | 16.80 | -19.07 | .. | 3.70 |
| 4212 | NA | 4 | 16.80 | -19.78 | 53 | 3.70 |
| 4245 | NA | 0 | 9.70 | -17.92 | 41 | 2.13 |
| 4365 | NA | -5 | 16.80 | -20.64 | .. | 3.70 |
| 4371 | NA | -1 | 16.80 | -19.51 | 57 | 3.70 |
| 4378 | A(S2) | 1 | 35.10 | -20.51 | 21 | 7.72 |
| 4379 | NA | -2 | 16.80 | -18.60 | 32 | 3.70 |
| 4380 | NA | 3 | 16.80 | -19.06 | 58 | 3.70 |
| 4382 | NA | -1 | 16.80 | -21.14 | 40 | 3.70 |
| 4405 | NA | 0 | 31.50 | -19.63 | 51 | 6.93 |
| 4406 | NA | -5 | 16.80 | -21.39 | .. | 3.70 |
| 4414 | NA | 5 | 9.70 | -19.31 | 57 | 2.13 |
| 4473 | NA | -5 | 16.80 | -20.10 | .. | 3.70 |
| 4477 | A(S2) | -2 | 16.80 | -19.83 | 24 | 3.70 |
| 4478 | NA | -5 | 16.80 | -18.92 | .. | 3.70 |
| 4501 | A(S2) | 3 | 16.80 | -21.27 | 59 | 3.70 |
| 4536 | NA | 4 | 13.30 | -20.04 | 67 | 2.93 |
| 4567 | NA | 4 | 16.80 | -19.34 | 48 | 3.70 |
| 4578 | NA | -2 | 16.80 | -18.96 | 43 | 3.70 |
| 4612 | NA | -2 | 16.80 | -18.75 | 38 | 3.70 |
| 4621 | NA | -5 | 16.80 | -20.60 | .. | 3.70 |
| 4639 | A(S1) | 4 | 16.80 | -19.28 | 48 | 3.70 |
| 4649 | NA | -5 | 16.80 | -21.43 | .. | 3.70 |
| 4660 | NA | -5 | 16.80 | -19.06 | .. | 3.70 |
| 4694 | NA | -2 | 16.80 | -19.08 | 63 | 3.70 |
| 4698 | A(S2) | 2 | 16.80 | -19.89 | 53 | 3.70 |
| 4800 | NA | 3 | 15.20 | -18.78 | 43 | 3.34 |
| 4900 | NA | 5 | 17.30 | -19.10 | 21 | 3.81 |
| 5033 | A(S1.5) | 5 | 18.70 | -21.15 | 64 | 4.11 |
| 5194 | A(S2) | 4 | 7.70 | -20.76 | 53 | 1.69 |
| 5273 | A(S1.5) | -2 | 21.30 | -19.26 | 24 | 4.69 |
| 6217 | NA | 4 | 23.90 | -20.23 | 34 | 5.26 |
| 7479 | A(S1.9) | 5 | 32.40 | -21.33 | 41 | 7.13 |
| 7743 | A(S2) | -1 | 24.40 | -19.78 | 32 | 5.37 |
In Table 2 (columns 3, 4, 5 and 6) we list the global and photometric properties of the 58 galaxies, i.e. the numerical Hubble type index (), their distance, the absolute band magnitude (), corrected for intrinsic and galactic absorption, and the inclination () (the data listed in this table were taken from Ho et al. , 1997a). The parameter ranges from -5 to 5 with 25 galaxies being early-type () and 33 galaxies being late-type (). Column 2 in Table 2 lists the galaxy “activity type”: “A” and “NA” stand for AGN and non-AGN, according to the classification of Ho et al. (1997a) while for AGNs the Seyfert type is also given. Finally, the last column in the same table lists the projected scale in parsecs per PC pixel at the distance of the galaxy.
Although the original sample of Ho et al. (1995) is an almost complete sample of nearby galaxies (see discussion in Ho et al. , 1997b), this is not true for the present sample. Since the main selection criterion is the availability of WFPC2 observations, it is important to examine if sample biases and selection effects are introduced in this way.
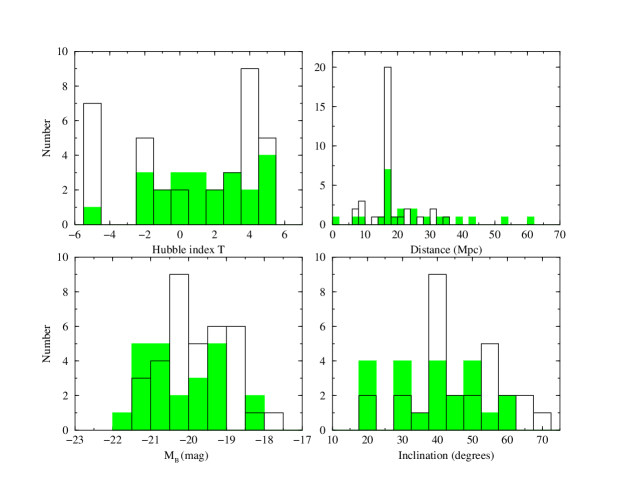
Table 3 lists the median global properties of the objects in our sample and Fig. 1 shows the distribution of morphological type, distance, absolute magnitude and inclination for the AGN and non-AGN group of galaxies (filled and open histograms, respectively). The average properties of the galaxies are similar for both groups (Table 3). The exception is the absolute magnitude, with the AGNs being brighter than the non-AGNs by mags on average.
Application of the Kolmogorov–Smirnov (K–S) test (Press et al. 1992) confirms that the distributions plotted in Fig. 1 are similar, apart from the distributions of . The probability that the sample distributions of , distance and inclination are drawn from the same parent population is , , and , respectively (hereafter, when we compare different distributions or compute correlation coefficients, we consider as “statistically significant” these differences or correlations with a probability to appear by chance being less than ). In the case of the distributions of , the K–S test gives a probability of only . We conclude that the distributions of distance, morphological classification and inclination of the non-AGN sample match those of the AGN sample. The distribution of the galaxy luminosity is different between the two samples, however, as we discuss in Sect. 4 this does not affect our conclusions.
| Group | D | Scale | |||
|---|---|---|---|---|---|
| (Mpc) | (deg) | (pc/pixel) | |||
| A | 1 | 17.8 | 40 | 3.74 | |
| NA | 2 | 16.8 | 44 | 3.70 |
3 The Data and method of analysis
All the WFPC2 images that we used were already processed by the standard STScI reduction pipeline (Biretta et al. 2000). Since we have chosen images with no saturation effects, the only additional processing step required is the removal of cosmic rays. For that reason, we used the filter/cosmic task of MIDAS astronomical package. Any residual cosmic ray events as well as bright foreground stars were removed by hand. For those galaxies with more than one image, we chose to study the one with the largest exposure time which did not cause saturation effects in the central region. If there were two or more images of the same integration time, we analyzed the images (as explained below) and then combined the resulting “variance” values (see below).
Our main aim is to study, in a quantitative way, the irregularities in the morphology of the central region of the galaxies. Our methodology consists of two steps. In the first step, we use the ellipse fitting technique to recover the axisymmetric isophotes around the center of the galaxies. If there are localized regions with excess emission (for example regions of star clusters or H II regions) or deficits (caused by dust absorption), they will show as deviations from the smooth isophotes. Based on this idea, in the second step, we compute the scatter of the pixel values around their mean (i.e. their variance) and use this value as a measure of the amplitude of the central structures. Although it is hard to estimate the significance of the derived amplitudes for each individual galaxy, the comparison of the distribution of the amplitudes for various groups of galaxies can provide us with useful information. For example, one would expect that AGNs, hosting a black hole and a large amount of gas in their nuclear region should show larger amplitude structure (and thus larger variance), on average, when compared with the normal galaxies. We describe below the two steps in more detail.
As mentioned above, first, we perform ellipse fitting to the isophotes of the galaxy image. This choice is motivated by the fact that the isophotes of galaxies, especially elliptical (E) and lenticular (S0) as well as the bulge of spiral galaxies, are not far from ellipses. This technique has been widely used in the past by various authors, mainly as a method of retrieving embedded galaxy structures that are hidden by the large-scale distribution of light of the main body of the galaxy. Descriptions of ellipse fitting techniques and their applications to the surface photometry of galaxies can be found in Kent (1983), Jedrzejewski (1987), Bender & Möllenhoff (1987), Wozniak et al. (1995) and Milvang–Jensen & Jørgensen (1999). Using the fit/ell3 task of MIDAS, which is based on the formulas of Bender & Möllenhoff (1987), we fit the isophotes of the galaxy image and construct an artificial image from the fitted ellipses.
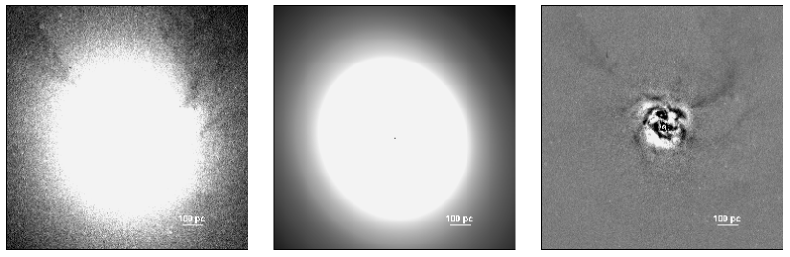
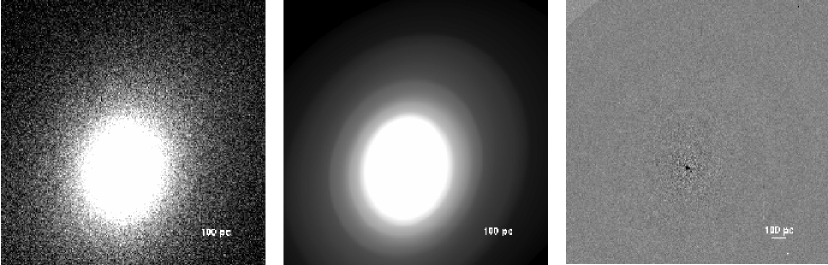
As an example, in Fig. 2 we show the central region of NGC 5273 (left panel) together with the “artificial” image from the fitted ellipses (middle panel). In order to recover the morphological features in the innermost part of the galaxy we then divide the galaxy image by the artificial image from the fitted ellipses. In doing so, we normalise the pixel values of the central regions in all galaxies to unity so that the amplitude of the structures in one galaxy can be compared with the amplitude in other galaxies, irrespective of their brightness or exposure time. The resulting image for NGC 5273, which we call the “structure” image, is also shown in Fig. 2 (right panel). If there were no structure in the central region, we would expect a smooth image with all the pixels having a value around . On the contrary, the image on the right panel of Fig. 2 shows positive and negative deviations from the smooth isophotes, indicative of localised structures. As an example of a galaxy with no deviations from the underlying galactic isophotes, in Fig. 3 we show the HST image of NGC 4612, together with the image from the fitted ellipses and the resulting image, after dividing the HST image with the image from the elliptical isophotes (left, middle and right panel, respectively). The structure image is almost completely smooth, with an average value of and no obvious deviations from the fitted isophotes.
In the second step, we choose two regions around the center of each galaxy with size of 100 pc and 1 kpc. The regions are defined as orthogonal boxes centered on the galaxy and with their largest side parallel to the major axis of the galaxy. The ratio of the small-to-large side of the box is taken as the cosine of the inclination angle of the galaxy. First, we measure the mean of the pixel values in each region and then their variance by using the statistics/image task of MIDAS. There are two mechanisms that contribute to the variance that we measure. One is the photon noise process and the other is the presence of features/irregularities in the region. Since we are interested in measuring the amplitude of the deviations that are caused by the galaxy micro-structures, we have to correct the estimated variance for the contribution of the photon noise statistics. Let us denote with , , and the total variance of a region, say , the variance that is introduced by the photon noise process, and the variance that is due to micro-structures, respectively. Since the photon noise variations and the variations due to morphological irregularities contribute to in an independent way, then , or . Therefore, we have to subtract the variance that is caused by the photon noise statistics from the total variance of each region in order to compute the variance that is due to real galactic structures. This is an important correction, since the flux (and hence the photon noise statistics) is different for each galaxy due to differences in the exposure time and their magnitude.
The contribution of each pixel to the total variance in each region is , where is the pixel value, is the mean value of all the pixels in the region and is the total number of pixels. The photon noise process contribution for that pixel is , where and are the gain and read-out noise of WFPC2 (, and ), respectively. Therefore, the contribution to the total variance of the photon noise statistics is , where the summation is over the the pixels of the region. In order to estimate this, we constructed an “error image”, i.e. we multiplied the original image with , added the value, and then divided with in order to take account for the fact that we have also divided the original image with the fitted ellipses ( is the value of the elliptical isophot at each pixel ). The mean value of the regions in the “error” image which have the same dimensions as the respective regions in the structure image is a good approximation of .
4 Results
The estimated values of for the inner 100 pc and 1 kpc regions of all the galaxies in our sample are listed in Table 4 (columns 2 and 3, respectively). In effect, the variance that we estimate gives a measure of the average amplitude of the deviations from the smooth isophotes in each galaxy. The average in the innermost 100 pc and 1 kpc regions is and , respectively (note that for the nearest galaxies, the 1 kpc region is larger than the field of view of the PC camera; for that reason we could not estimate their ). Consequently, the average amplitude of the localised structures in the innermost 100 pc and 1 kpc regions are and of the underlying galaxy emission, respectively. The fact that the average structure amplitude decreases with distance from the center (i.e. ) implies that most of the structure is concentrated at the center of the galaxies. As a result, consideration of a larger region will tend to dilute the signal, i.e. decrease .
Before comparing the structure amplitudes for the various groups of galaxies, we have to examine whether our results are biased by any observational or global characteristics of the galaxies. First of all, if the central region isophotes are not elliptical then the residuals that we detect could be the result of the failure of the elliptical isophotes to fit properly the underlying starlight distribution. An indication that the “ellipse fitting” method works successfully in suppressing the underlying galaxy distribution and revealing real structures in the central regions of the galaxies is given by the fact that most of the dust/emission structures that we detect are certainly visible in the original images as well. In order to investigate further this possibility, we plotted the fitted ellipses superimposed on the galactic isophotes for all the galaxies in our sample. For galaxies with , the agreement between the overall shape of the isophotes and the fitted ellipses is very good. In many cases the isophotes are not smooth and small-scale departures from the elliptical shape are apparent, indicative of the localised structures that we want to study. For the galaxies, in some cases, we do observe systematic deviations of the isophotes from ellipses at large distances from the galactic centers. They are caused mainly by the presence of spiral arms, while in a few cases the presence of an inclined disk causes the isophotes to become more elongated than the fitted ellipses. However, at small radii, the isophotes are well approximated by ellipses, with any deviations being localised and suggestive of small-scale structures.
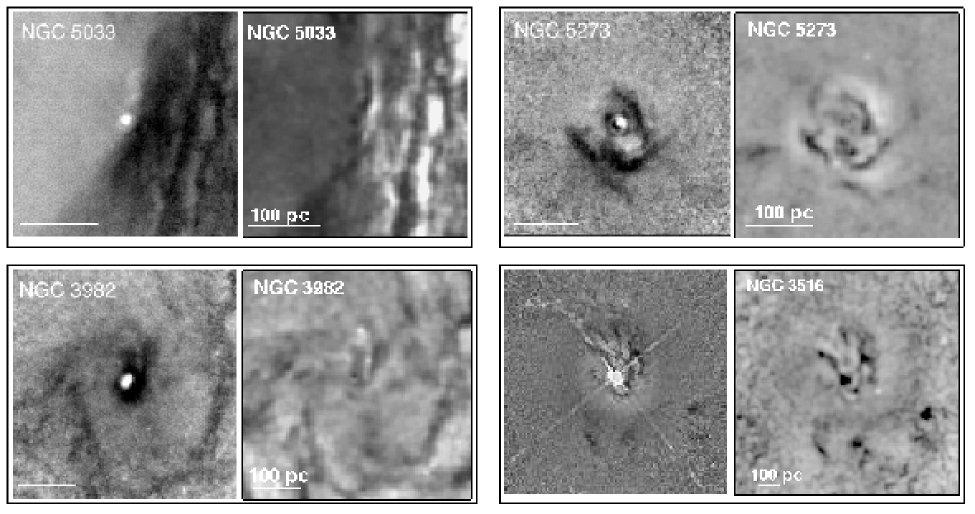
As a final test of how well the ellipse fitting method detects the underlying morphological signatures, we compared our “structure” images with images obtained by using other techniques. In Fig. 4, we plot the “structure” image of the Seyfert 2 galaxies NGC 5033, NGC 5273 and NGC 3982 (top left, top right and bottom left respectively; note that the structure image of NGC 5273, also presented in Fig. 2, is now fliped and scaled to different brightness levels so that it can be compared with the respective color map image). The central micro-structure in these galaxies have been studied by Martini & Pogge (1999) with the use of () color maps. These maps are shown in Fig. 4 as well. In the same figure, we also plot the “structure” image of NGC 3516 (a Seyfert 1 galaxy; bottom right panel) together with another structure image which was constructed with the use of the “Richardson - Lucy” (R–L) image restoration technique (Pogge & Martini, 2002). In all panels, the left hand side images are those taken from the literature (downloaded in electronic form from the respective journal site) and the right hand side images are the “structure” images created with the ellipse fitting method presented in this work. The brightness levels and the image scales were adjusted in such a way so that they are roughly comparable with the ones taken from the literature.
Comparison of the “structure” images with the color maps in Fig. 4 shows clearly that the ellipse fitting technique reveals successfully most of the features that appear in the color maps (in some cases, the features appear more enhanced in the “structure” images). There are no additional features that could be identified with ellipse fitting residuals. It is also evident that the bright cores seen in all the galaxies in the color maps are fitted quite well with ellipses. As a result, they do not appear and do not cause any artifacts in the “structure” images. This is true even in the case of NGC 3516. In order to avoid the overexposed bright nucleus which appears in the image of Pogge & Martini (2002), we have used an image of shorter exposure, taken with a different filter. The nucleus is successfully removed, and the same features appear in both images. We conclude that the “ellipse fitting” method works successfully in suppressing the underlying smooth galaxy distribution and revealing real structures in the central regions of the galaxies. However, it is hard to judge whether the values (of the galaxies mainly) are indicative of the real structure amplitudes only, or whether the amplitude of any fitting method residuals contributes significantly as well. Because of this reason, the values should be considered as a rough estimate of the galactic micro-structure amplitudes.
Furthermore, Fig. 5 (upper panel) shows a plot of as a function of exposure time, for both the 100 pc and 1 kpc regions. Although we have normalised the structure images to the underlying galaxy isophotes, hence the estimation of is not affected by differences in the brightness of the galaxies, there is still the possibility that if the signal to noise is small in some cases (due to short exposure time) we may not be able to estimate accurately the amplitude of the central structures. As Fig. 5 shows, this is not the case. There is no correlation between or with exposure time. This result is verified when we use Kendall’s nonparametric statistic (Press et al. 1992) in order to investigate, quantitatively, whether there is a significant correlation between the two variables. We find and for the [, exposure] and [, exposure] variables, respectively. The probability that we would obtained these values by chance, if the two variables were uncorrelated, is in both cases.
On the other hand, both and are correlated with the inclination and distance of the galaxies. Looking at Fig. 5 (second panel from top) we can see a positive correlation between and inclination: as the inclination increases, so does . The vs distance plot (second panel from bottom in Fig. 5) shows that is also correlated with distance. In fact, in this case, an anti–correlation is observed. As the distance decreases, increases. Computation of Kendal’s yielded 0.28, 0.24, -0.16 and -0.23 for the vs inclination, and the vs distance correlations, respectively. The probability that these values would appear by chance if the variables [, inclination] and [, distance] were uncorrelated is and (in the case of the plots) and , (in the case of the plots) respectively. The dependence of on distance is easy to interpret. The median distance of all the galaxies is 16.7 Mpc. However, the distance of the nearest galaxy is only 1.4 Mpc, while the most distant galaxy is located at 61.2 Mpc. Any small scale structures will be smoothed out in the more distant galaxies, hence the increase of with decreasing distance. The dependence of the variance on the inclination is rather unexpected. One would expect that small scale structure would be diminished in inclined systems, while the opposite effect is observed. Visual inspection of the respective structure images shows that the increase of with increasing inclination is caused by the obscuration effects due to dust, which become more pronounced in inclined systems.
Finally, we also examined whether depends on the absolute band magnitude of the galaxies (Fig. 5, lower panel). As expected, there seems to be no correlation between the two variables. Indeed, and for the [] variables. The probability that the correlation of two uncorrelated variables would yield these values by chance is and respectively.
| NAME | ||
|---|---|---|
| (NGC) | 100 pc | 1 kpc |
| 1058 | 0.00300 | .. |
| 1068 | 0.00810 | 0.03900 |
| 1358 | 0.00920 | 0.00200 |
| 1667 | 0.01300 | 0.02400 |
| 2273 | 0.02260 | 0.02900 |
| 2300 | 0.00008 | -0.00570 |
| 2639 | 0.00510 | 0.00320 |
| 2655 | 0.01500 | 0.01700 |
| 2748 | 0.13700 | 0.00060 |
| 2775 | 0.00070 | 0.01700 |
| 2903 | 1.16400 | .. |
| 2964 | 0.14900 | 0.08100 |
| 3031 | -0.00440 | .. |
| 3227 | 0.04800 | 0.03900 |
| 3310 | 0.04200 | 0.16400 |
| 3344 | 0.00130 | .. |
| 3504 | 0.18600 | 0.13200 |
| 3516 | 0.06200 | .. |
| 3810 | 0.00420 | 0.01100 |
| 3982 | 0.00600 | 0.03100 |
| 4062 | 0.09340 | .. |
| 4102 | 0.18900 | 0.03500 |
| 4138 | 0.02000 | 0.04000 |
| 4152 | 0.05200 | 0.01400 |
| 4168 | 0.00250 | 0.00510 |
| 4212 | 0.11200 | .. |
| 4245 | -0.00120 | .. |
| 4365 | -0.00008 | -0.00050 |
| 4371 | -0.00120 | -0.01200 |
| 4378 | 0.00080 | 0.00160 |
| 4379 | -0.00020 | -0.01460 |
| 4380 | 0.00450 | .. |
| 4382 | 0.00026 | -0.00036 |
| 4405 | 0.00130 | 0.00900 |
| 4406 | 0.00090 | -0.00090 |
| 4414 | 0.05200 | .. |
| 4473 | -0.00006 | -0.00060 |
| 4477 | 0.00310 | -0.00630 |
| 4478 | 0.00180 | 0.00070 |
| 4501 | 0.00930 | 0.02900 |
| 4536 | 0.19600 | .. |
| 4567 | 0.04100 | 0.09000 |
| 4578 | -0.00070 | -0.02280 |
| 4612 | 0.00100 | 0.00400 |
| 4621 | 0.00017 | -0.01370 |
| 4639 | -0.00400 | -0.05000 |
| 4649 | -0.00006 | -0.00020 |
| 4660 | -0.00040 | -0.01400 |
| 4694 | 0.08700 | 0.01100 |
| 4698 | 0.00080 | -0.00300 |
| 4800 | 0.00090 | 0.01000 |
| 4900 | 0.91000 | .. |
| 5033 | 0.00140 | 0.06900 |
| 5194 | 0.05900 | .. |
| 5273 | 0.01780 | 0.00300 |
| 6217 | 0.02500 | 0.02700 |
| 7479 | 0.00260 | 0.02300 |
| 7743 | 0.01420 | 0.00492 |

4.1 Active vs non-Active galaxies
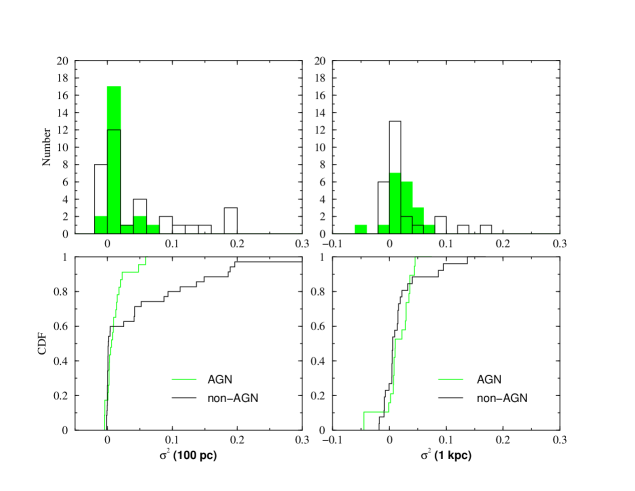
In Fig. 6 we plot the distribution of and for the AGN and non-AGN galaxies in our sample (filled and open histograms, respectively). The two distributions appear to be similar, although the non-AGN galaxies show an excess of larger values. This effect is more pronounced in the plots of the cumulative distribution functions (CDF) of (shown in the lower panel of Fig. 6). The CDF of the non-AGN galaxies shows clearly an extended tail towards larger values. The K–S test shows that the differences between the two distributions are not statistically significant. The probability that they are drawn from the same population is and for the and distributions respectively. We note that the dependence of on distance and inclination cannot influence our results since the distributions of inclination and distance are statistically similar for the active and non-active groups of galaxies.
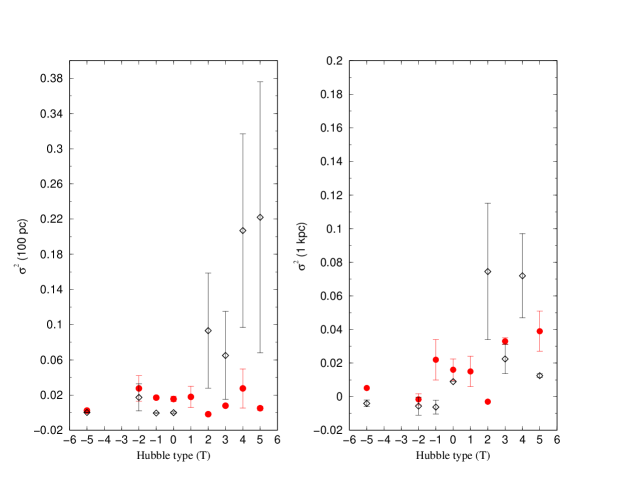
In order to examine whether depends on the galaxy Hubble type and the galaxy activity class, in Fig. 7 we plot the mean and for the AGN and normal galaxies as a function of . In the vs plot we observe a systematic increase of the structure amplitude with the Hubble type, which is roughly similar for both the AGNs (filled circles) and non-AGNs (open diamonds). This trend is expected, for three reasons. At a distance of 1 kpc, as increases, we start to detect the increasing amplitude of the spiral arms (with respect to the underlying galactic/bulge component). Furthermore, early-type galaxies are less gas–rich than late-type galaxies (Young & Scoville 1991). Therefore, obscuration effects and/or bright H II regions will become more prominent (and hence the variance will increase) as increases. Finally, as we mentioned in Section 4, in late-type galaxies, the presence of an exponential disk can cause fitting residuals to appear, and hence increase the values for these galaxies.
The vs plot shows a similar trend (the variance increases with increasing ), however there are two important differences as well. Firstly, AGNs appear to have similar values, irrespective of their Hubble type. On the other hand, the early and late normal galaxies show a large difference in their , with the late-type galaxies being much more irregular in their central regions than the early-type galaxies. We would like to emphasize that the differences in the variance of the early and late-type galaxies can not be caused by differences in their distance or inclination, since the distributions of the distance and inclination for the two groups of galaxies are statistically similar (the probability that they are drawn from the same parent population is and , respectively), or by any fitting method residuals, since the overall shape of the galactic isophotes at small radii in both early and late-type galaxies are well approximated by ellipses as we mentioned in Section 4.
4.2 Active vs non-Active early and late-type galaxies
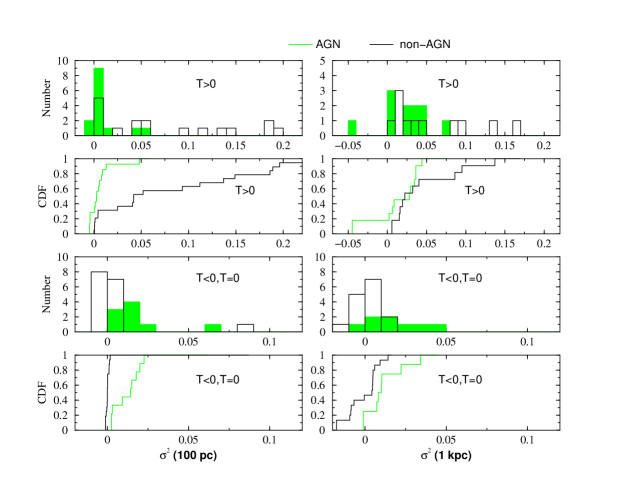
We investigated further the comparison between the distributions of the AGN and non-AGN groups of galaxies taking into account the differencies between the early and late-type of galaxies that Fig. 7 revealed. In Fig. 8, we plot the distributions of for AGN and non-AGN considering not the whole samples but only late or early-type galaxies (upper and second from bottom panel, respectively). In the case of late-type galaxies, the distribution of for normal galaxies extends to much larger values, when compared to the distribution of the AGN. The opposite is true in the case of early-type galaxies. There, the AGN distribution of shows a tail towards larger values, while the distribution of the normal galaxies is centered around .
These results become more pronounced in the plots of the cumulative distribution functions. The CDF plot of for late-type AGN and non-AGN shows clearly that, on average, normal galaxies have values larger than the AGN (second from top panel in Fig. 8). On the other hand, the CDF of the early-type AGN is shifted to larger values when compared to the CDF of the early type non-AGN galaxies (bottom panel in Fig. 8). Application of the K–S test shows that the distributions shown in Fig. 8 are significantly different. The probability that they are drawn from the same parent population is less than in the case of early-type galaxies (for both and ), and in the case of the distributions of for late-type AGN and non-AGN. On the other hand, the distributions for the same group of galaxies, are statistically similar, with a probability of being drawn from the same parent population of .
The difference between the distributions of of the non-AGN/AGN early and late type galaxies cannot be caused from differences in the distributions of their morphological type or inclination. For example, application of the K–S test shows that the Hubble type index and the inclination distributions of the early type, AGN and non-AGN galaxies are not significantly different. The probability of being drawn from the same parent polution is and respectively. The only significant difference that we find is between the distributions of distance for the early-type AGN/non-AGN galaxies. AGN have on average larger distance compared to the non-AGN, early-type galaxies. However, this result implies that the difference in the variance between the two groups is actually larger than what is observed in Fig. 8.
5 Discussion
We have used archival WFPC2 HST images to study the morphology of 58 nearby galaxies in a quantitative way, i.e. by measuring the variance (that is to say the average amplitude of the deviations from the smooth galactic isophotes), in two regions around the center of each galaxy, one with a radius of 100 pc and the other with a radius of 1 kpc. Our main results are as follows:
1) Taken as a whole, the galaxies show considerable structure in their central regions. The amplitude of the nuclear features is roughly and of the underlying galactic emission in the inner region of 100 pc and 1 kpc, respectively.
2) When we consider the whole AGN and non-AGN group of galaxies, the distributions of the variances are statistically similar.
3) The central structure tends to increase from early-type towards late-type galaxies.
4) The increases “smoothly” for both the AGN and non-AGN galaxies with increasing (see Fig. 7). Consequently, the spiral arm structure and large scale dust lane morphology (these two factors contribute most of the large scale structure that we observe) are similar in both groups of galaxies.
5)However, the values show a large, discontinuous increase between the non-AGN late and early-type of galaxies, while they remain roughly constant for active galaxies, both of early and late-type.
Consistent with previous studies (e.g. Malkan et al. 1998, Regan & Mulchaey 1999, Martini & Pogge 1999), we find that all AGN show evidence for significant central structure, irrespective of the host galaxy type. The deviations are caused by localised regions of excess emission or deficits, probably caused by dust absorption. The difference in the morphology of the central region between AGN and non-AGN galaxies is particularly strong in the case of early-type galaxies. The “structure” image of all the early-type, non-AGN galaxies (except from NGC 4649, see below) looks like the structure image of NGC 4612 in Fig. 3 (an early-type galaxy itself). No significant deviations, of any kind, from the fitted ellipses appears in the images of the other normal, early-type galaxies. On the contrary, the structure images of all the early-type, AGN galaxies show significant structures in their central regions. An example is shown in Fig. 2 (NGC 5273 is an early-type, AGN galaxy). The central region (i.e. the innermost pc) shows significant deviations from the isophotes, with many bright and dark regions appearing, in a rather “chaotic” pattern. Large-scale dark “lanes”, which extend up to the innermost region are also evident. The only exception among the early-type, non-AGN galaxies is NGC 4694, an H II galaxy according to Ho et al. (1997a), which shows large amplitude structure in its central regions (in fact, its value is the largest among the early-type galaxies), similar to the structure that is seen in the central region of AGNs. We suspect that this galaxy may have a misclassified Hubble type (indeed it has a much more peculiar shape than the typical galaxies) or a misclassified nuclear activity type.
Due to the small size of the early type, AGN and non-AGN galaxy samples, the significant differences that we find in the morphology of their central regions should be considered with caution. For example, although we find no statistically significant difference in the distribution of host type for the two samples, approximately of the early-type non-AGN are ellipticals (), while only of the early-type AGN are ellipticals. This could explain in part the observed difference in the distributions of values. However, only one of the remaining nine non-AGN galaxies (with shows central micro-structure (NGC 4694), while all eight early-type, AGN galaxies with show significant structure in their central regions. If confirmed with the use of larger samples, this result is consistent with the hypothesis that the presence of an active nucleus in early-type galaxies is associated with the presence of material in them. It is possible that all early-type galaxies host a supermassive black hole, but only in those cases where a sufficient quantity of interstellar material has managed to reach the innermost region (and fuel the central engine), an active nucleus is exhibited.
We find a different picture in the case of late-type galaxies. Almost all of them show large amplitude structure in their central regions. In fact, the average amplitude of the deviations in the 100 pc innermost region of the late-type non-AGN galaxies is larger than the amplitude in the AGN of the same morphological type (see Fig. 7). This is a puzzling result, which implies that the presence of significant structure, and hence of material in the inner region of these galaxies, does not result in the presence of an active nucleus in them.
One possibility is that the mass of the black hole in late-type normal galaxies is small and hence the luminosity of the nucleus is not large enough to be detected. We investigated this possibility by computing the mass of the putative black hole in the center of the galaxies according to the formula
| (1) |
given in Kormendy & Gebhardt (2001). This relation between the black hole mass () and the band luminosity of the bulge component of the galaxy () is established the last few years from stellar, ionized gas, and maser dynamics observations of many, mainly inactive or weakly active galaxies. Using the values of the absolute bulge magnitude () for our sample of galaxies (taken from Ho et al. 1997a) we calculated the luminosity of the bulge () and thus the black hole mass for each galaxy. We found that the black hole mass for the AGNs in our sample ranges from to with a median value of . For the non-AGNs, assuming that they also host an “invisible” black hole, the mass range would be from to with a median value of . Hence, on average, the active galaxies host a black hole with a mass which is 2.5 times larger than the mass of the black hole in the non-AGN galaxies in our sample. However, there is also a considerable overlap between the black hole mass values that we compute for the AGN and non-AGNs. Therefore, we conclude that most of the late-type, non-AGN galaxies in our sample either do not host a supermassive black hole, or, for some reason, although there is enough material in the central region (i.e. within the innermost 100 pc), it cannot fuel the central engine.
In order to investigate possible reasons that could prevent the fueling of the central engine in the galaxies that show the largest amplitude structure in their innermost 100 pc region, we compared the morphology of the circumnuclear structures that we observe in the late-type, AGN and non-AGN galaxies, in trying to find whether there exist any systematic differencies. We could not identify any clear patterns that appear exclusively in one of the two groups of galaxies. There are galaxies in both groups which show nuclear dust spiral formations, which some times appear to connect to larger scale dust lanes. In other cases, irrespective of the galaxy’s activity type, the distribution of the structures follows a chaotic pattern, with no clear, overall formation.
Therefore, the only significant difference that appears to exist between late-type, AGN and non-AGNs is the amplitude of the nuclear structures. Perhaps there exists an active nucleus in the late-type, non-AGN in our sample but, if the larger amplitude structure that we find in these galaxies implies the existence of a larger amount of gas in their central region, then this material, apart from fueling the central black hole, may also obscure the central active nucleus (including the Narrow Line Region) from our sight. At the same time, the large amounts of gas could result in the formation of a large number of star forming regions which make these galaxies look like H II galaxies. As the central gas content decreases, the active nucleus will be revealed and, at the same time, the central black hole will have increased its mass, rendering the galaxy a “normal” AGN.
6 Summary
Using archival Hubble Space Telescope images, we examined the central morphology of 58 galaxies (23 AGN and 35 non-AGN). Using the “ellipse fitting” technique, we “uncovered” hidden structures in the innermost parts of the galaxies. In order to compare, in a quantitative way, the structure seen in the samples of AGN and normal galaxies we calculated their variance (a quantity that is proportional to their amplitude normalised to the underlying galactic emission) and compared its distribution for different subgroups of the galaxies. We found that all AGNs show significant structure in their central 100 pc region. The amplitude of the structures is more or less independent of their Hubble type. When grouping the galaxies according to their Hubble type we found that, contrary to early-type AGNs, early-type non-AGN galaxies show no structure at all. This result is consistent with the hypothesis that all early-type galaxies host a supermassive black-hole, but in only those cases where there is significant amount of material in their central regions they host an active nucleus. On the other hand, late-type galaxies show significant nuclear structures irrespective of whether they are AGNs or not. This implies that the presence of material in the inner region of these galaxies does not result in the presence of an active nucleus as well. Either not all late-type galaxies host a central black hole, or, for some reason, contrary to what happens in AGN, the significant amount of material on the scales of tens-of-parsecs does not make it down to the scales of the central black hole. Another possibility is that the large amount of gas and dust in them obscure the nucleus from our sight.
Our results are based on the use of small size samples, because the the number of current HST, WFPC2 images of nearby galaxies that satisfy the criteria listed in Section 2 is small. Obviously, larger samples are needed in order to confirm our results. We plan to repeat the analysis that we presented in this work in the future when a larger number of observations of AGN and non-AGN galaxies will be available, and investigate in greater detail the differencies/similarities in the morphology of the central region in these galaxies.
Acknowledgements.
We wish to thank the referee (J. Mulchaey) for useful comments and suggestions on the improvement of this paper. This paper has also benefited a lot from discussions with N. Kylafis, J. Papamastorakis, V. Charmandaris and K. Xilouris.References
- (1) Bender, R., Möllenhoff, C., 1987, A&A, 177, 71
- (2) Biretta, J.A., et al. 2000, WFPC2 Instrument Handbook, Version 5.0 (Baltimore, STScI)
- (3) Bushouse, H.A., 1986, AJ, 91, 255
- (4) Dahari, O., 1984, AJ, 89, 966
- (5) Fuentes–Williams, T., Stocke, J.T., 1988, AJ, 96, 1235
- (6) Hernquist, L., 1989, Nat, 340, 687
- (7) Ho, L.C., Filippenko, A.V., Sargent, W.L.W., 1995, ApJS, 98, 477
- (8) Ho, L.C., Filippenko, A.V., Sargent, W.L.W., 1997a, ApJS, 112, 315
- (9) Ho, L.C., Filippenko, A.V., Sargent, W.L.W., 1997b, ApJ, 487, 568
- (10) Ho, L.C., 2001, astro-ph/0110438
- (11) Jedrzejewski, R.I., 1987, MNRAS, 226, 747
- (12) Kent, S.M., 1983, AJ, 266, 562
- (13) Kormendy, J., Gebhardt, K., 2001, astro-ph/0105230
- (14) Malkan, M.A., Gorjian, V., Tam, R., 1998, ApJS, 98, 477
- (15) Márquez, I., Durret, F., Gonzalez Delgado, R.M., et al., 1999, A&AS, 140, 1
- (16) Márquez, I., Durret, F., Masegosa, J., et al., 2000, A&A, 360, 431
- (17) Martini, P, Pogge, R.W., 1999, AJ, 118, 2646
- (18) Milvang-Jensen, B., Jørgensen, I., 1999, Baltic Astron., 8, 535
- (19) Mulchaey, J.S., Regan, M.W., Kundu, A, 1997, ApJS, 110, 299
- (20) Mulchaey, J.S., Regan, M.W., 1997, AJ, 482, L135
- (21) Pogge, R., & Martini, P. 2002, ApJ, (in press) (astro-ph/0201185)
- (22) Press, W.H., Tenkolsky, S.A., Vetterling, W.T., Flannery, B.P., 1992, Numerical Recipies. Cambridge Univ. Press, Cambridge
- (23) Rafanelli, P., Violato, M., Baruffolo, A., 1995, AJ, 109, 1546
- (24) Regan, M.W., Mulchaey, J.S., 1999, AJ, 117, 2676
- (25) Schmitt, H.R., 2001, AJ, 122, 2243
- (26) Shlosman, I., Begelman, M.C., Frank, J., 1990, Nat, 345, 679
- (27) Wozniak, H., Friedli, D., Martinet, L., et al., 1995, A&AS, 111, 115
- (28) Xanthopoulos, E., 1996, MNRAS, 280, 6
- (29) Young, J.S., Scoville, N.J., 1991, ARA&A, 29, 581