Absorbers and Globular Cluster Formation in
Powerful High Redshift Radio Galaxies
Abstract
A radiative hydrodynamic simulation for a typical, powerful high redshift radio galaxy is presented. The jet is injected at one third the speed of light into a 10000 times denser, homogeneous medium. In the beginning of the simulation, the bow shock consists of a spherical shell that is similar to a spherical blast wave. This shell cools radiatively down to K, providing after yrs a neutral column of around the whole system. The shell starts to fragment and forms condensations. This absorbing screen will cover a smaller and smaller fraction of the radio source, and therefore the emission line region, and eventually form stars in typically globular clusters of . Approximately are entrained into the radio cocoon. This gas, cooling and illuminated from the radio source, could be the emission line gas observed in high redshifted radio galaxies and radio loud quasars. The neutral column behind the bow shock can account for the absorption found in almost all of the small sources. The globular cluster excess of systems found in present day brightest cluster galaxies (BCGs), which are believed to be the vestiges of these objects, is consistent with the presented scenario.
Key Words.:
Hydrodynamics – Instabilities – Shock waves – Galaxies: jets – Radiation mechanisms: thermal – intergalactic medium1 Introduction
Collimated radio-luminous outflows are by now detected from the cosmological neighborhood up to redshifts in excess of five. According to the unified scheme these jet-sources come in two classes: Radio-loud quasars, where the current redshift record is (Fan et al. (2001)), and radio galaxies. Among the latter ones the highest known redshift is (van Breugel et al. (1999)). Infrared observations indicate that radio galaxies contain a luminous quasar hidden by a dusty torus, at least at redshift above (Meisenheimer et al. (2001)). The maximum power of radio galaxies increases with redshift (De Breuck et al. (2000)), the suspicion being that the most powerful active galaxies at develop into BCGs (Carilli et al. (2000), and references therein). This idea is supported e.g. by the fact that the co-moving space density of clusters at low redshift is comparable to that of powerful AGN at (West (1994)).
There is good reason to believe that the jets of higher redshift sources bore into a medium of higher density. If one just considers the cosmological expansion, the number density of the intergalactic material (IGM) scales like , on large scales. This means e.g. that if the well known radio galaxy Cygnus A, which has a surrounding IGM number density of a few times (Carilli & Barthel (1996)), was located at redshift , its jet had to bore into a medium with . However, the environments of the most powerful radio galaxies, which are believed to highlight the highest density peaks in the early universe, are not a priori expected to simply follow the Hubble flow. For example, it has to be taken into account that the associated galaxies appear as bright ellipticals only at redshift , whereas above this redshift one finds clumpy regions, distributed over upto 100 kpc (Pentericci et al. (2001)), and a considerable fraction of the gas is transformed into stars around that redshift. Direct estimates from emission line observations indicate IGM densities in the range of (van Ojik et al. (1997)) upto , if one ascribes the dominant energy source for ionization to the bow shock of the jet (Bicknell et al. (2000)). If the jets themselves consist in electron proton plasma and are subrelativistic on large scales – e.g. in Cygnus A a kpc scale jet velocity () of 0.4 is favoured (Carilli & Barthel (1996), being the velocity of light) – the number density in the jet () is given by
| (1) |
Here is the jet’s mass flux rate (in solar masses per year), is the jet radius (about 0.6 kpc in Cygnus A, Carilli & Barthel (1996)), and the mass of hydrogen. Adopting an IGM number density of for high redshift radio sources gives a density contrast . Due to the lower environment density (Daly (1995)), is thought to be higher in low redshift sources. Because the expansion velocity of the radio structure scales proportional to , the average extension of radio galaxies with of 100 kpc versus 10 kpc at (Carilli et al. (2000)) could be nicely explained by such a cosmological IGM density increase, if the average active time stays constant. Another indication for high density environments at high redshift is the observed bending of the kpc scale radio jets (e.g. Pentericci et al. (1997)). This underlines the clumpy nature of the IGM around high redshift radio galaxies (HZRG).
The optical emission of radio galaxies is often aligned with the jet axis. While below this emission is highly polarized, indicating mainly scattered light from a hidden AGN, above less then 2% polarization is found and stellar absorption lines are detected (Carilli et al. (2000)). This could indicate that – at high redshift – jets induce star formation. The aligned light could also reflect the large scale matter distribution (West (1994)).
Radio galaxies are surrounded by a Ly- halo. The size of this halo grows with redshift (Carilli et al. (2000)). Whilst sources at have halos of and an extension of 10 kpc, sources have 100 kpc halos of . The width of the emission lines is typically km/s (van Ojik et al. (1997); De Breuck et al. (2000)). HZRG with diameters less than 50 kpc show associated narrow absorption lines with a width of km/s (van Ojik et al. (1997)). The absorption is often saturated with column densities of , and is preferentially blue-shifted by upto 250 km/s. These absorption systems were thought of to consist of solar system sized clouds by van Ojik et al. (1997). Advanced modeling with photoionization codes lead to the proposition that the absorber was a low density region, surrounding every HZRG (Binette et al. (2000)). None of these models take into account the hydrodynamic facet of the problem. This letter is therefore dedicated to an understanding of the above mentioned features based on hydrodynamic modeling of HZRGs.
2 A hydrodynamic model for high redshift radio galaxies
One of the basic differences between jets at low and high redshift is the environmental density. We consider a – typical – jet with a density contrast of , a velocity of cm/s (internal Mach number 85), a jet radius of 1 kpc, and a density of the homogeneous external medium of 1 . This results in a kinetic jet luminosity of erg/s, which is transfered by some efficiency factor to radio luminosity. The velocity of advancement of the jet’s head – and the bow shock in front of it – is expected to be km/s. This velocity causes the external gas to get heated to a temperature of , according to standard hydrodynamic shock jump conditions, neglecting the internal energy of the pre-shock gas. The cooling time of this post-shock gas due to thermal bremsstrahlung with an emissivity of will be:
| (2) |
which is less than the typical lifetime of a jet. Therefore, cooling has a major effect on the evolution of the post-shock gas. This gas will cool down to high densities and a temperature of about K, where the cooling curve drops significantly (Sutherland & Dopita (1993)).
We have solved the hydrodynamic equations for the above mentioned parameters numerically with the code NIRVANA_C (Ziegler & Yorke (1997)), upgraded due to optically thin cooling (Thiele (2000)). NIRVANA_C is a second order accurate finite difference scheme. Cooling comes into play via the equation for the internal energy density ():
| (3) |
where is the global cooling function. NIRVANA_C also solves the ionization and recombination equations, by a time implicit method, in order to allow for nonequilibrium processes. For the present simulation, three species were used, namely ionized and neutral hydrogen, and electrons. Below K, an average cooling curve for solar metalicity was applied (Stone & Norman (1993)). The simulation was carried out in axisymmetry (2.5D), and the jet is resolved with 10 points. With that resolution, NIRVANA_C marginally resolves shocks in the jet beam and gets basic flow parameters right. Turbulence on small scales as well as details of the beam, especially of the head region, are unresolved (Krause & Camenzind (2001)). The simulation was stopped when the thickness of the shell behind the bow shock shrinked below the resolution, which was clearly the case after a simulation time of yrs.
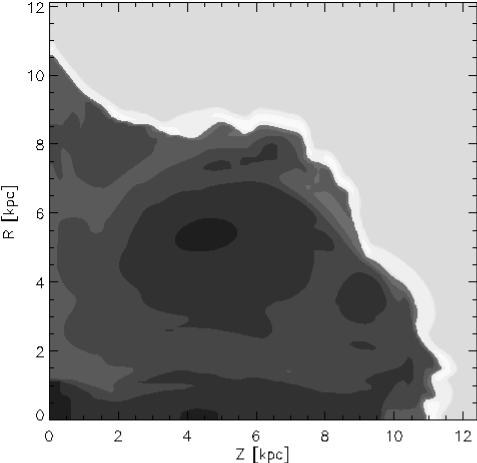
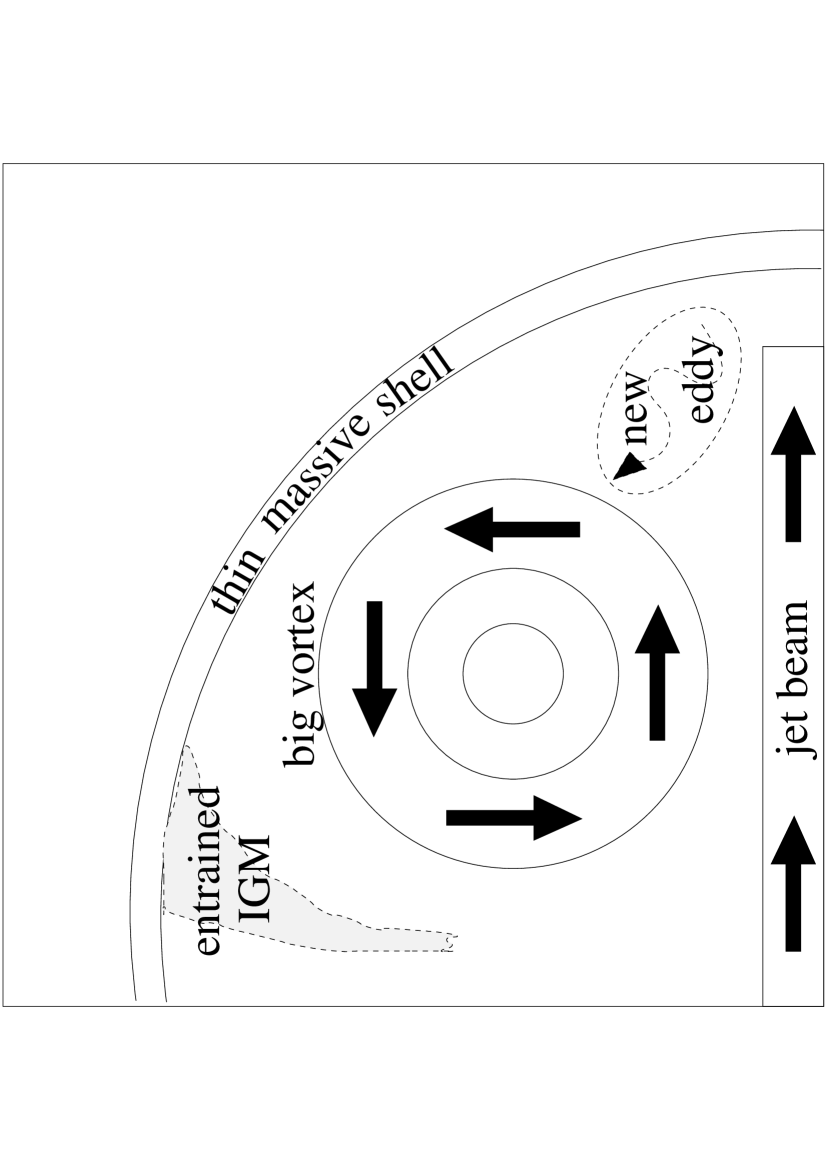
The results are quite unusual compared to simulations of higher : Most of the mass accumulates into an almost spherical shell behind the bow shock. The maximum density there is , and the gas has cooled to an average temperature of K in regions with density above , which still cover almost the whole shell surface. The mass accumulated in this shell is , 75 % of which are neutral. This gives an average neutral column for the shell of , which has to be compared to the amount of matter displaced by the shell: . It follows, that 98 % of the mass are accumulated in the thin shell. Therefore 2 % of the mass or were entrained into the cocoon.
The cocoon itself has a very peculiar structure. It is well known, that jet cocoons broaden when lowering (Norman et al. (1983)). But in this simulation, the cocoon is not elongated along the jet beam, forming individual vortices. Instead, all the vortices join into one big vortex with a diameter of roughly 8 kpc. The vortex shedding is sometimes violent: while, at the time shown, only a small eddy is ejected at the beam head, at other times we observed upto half the jet beam splitting and forming an eddy. The big vortex turns around at a maximum velocity of .
The velocity of the jet head differs considerably from higher simulations. At early times, it is about 10 times higher than the expectation above. Only after about two million years, the jet head moves, relatively constant, at maximum expected pace.
Within the cocoon, the sound speed is, on average, 20000 km/s. Therefore, pressure differences within the cocoon gas are rapidly communicated, with the result that the pressure is almost constant. The simulation shows that the bow shock is, at early times, perfectly spherical. It looks more like a supernova bubble than a jet cocoon. Indeed, if one compares the velocity of a spherical blast wave (e.g. Wünsch & Palous (2001), with constant energy ejection): to the velocity of the jet head, one finds, that the jet head outruns the blast wave only at times above yrs, for the parameters of our simulation. This is what we observe. We rewrite the above equation for the case, when the energy injection comes from a jet: . The blast wave velocity depends on , whereas the jet head velocity depends on (light jet limit). Because of that, the spherical state of the bow shock can be observed only at the earliest times, for higher .
3 Comparison to observations
Because of the large neutral column, this shell is a good candidate for the absorber in HZRGs. The width of an absorption line caused by this absorber would be approximately the sound speed within it (Dyson et al. (1980)), which is in our simulation about 55 km/s, on average. This is also in remarkable agreement with observations (van Ojik et al. (1997)). Typically, the material that is just heated by the shell emits Lyman at a few percent of the kinetic jet luminosity. This is less then the observed Ly luminosity, indicating that the bow shock is not the main emitter. At late times compared to , it is justified to approximate the bow shock with an isothermal shock description. Following Steffen et al. (1997), we derive for the thickness of the spherical thin shell:
| (4) |
Here, denotes the mean molecular weight per proton mass. The sound crossing time through this shell is about yrs, which is much longer than the cooling time (about yrs, Sutherland & Dopita (1993)). Therefore, it is possible, that the shell breaks up into individual subshells (Dyson et al. (1980)). This could well correspond to the multiple associated absorption systems, often observed in HZRGs. These absorbers are preferentially blue shifted, a natural feature of our model. But almost never, a velocity above 250 km/s is observed. Approximating the sideways expansion of the shell by the laws for the spherical shell also for some time after the jet head begins to shape the shell, one can calculate , given the bubble size ( kpc) at observation time. This yields , which means that the full range of currently known observations can be explained if the environmental density is . in the above formula could be replaced by to account for a declining density distribution. The would be lower, in that case. It is interesting to note here, that very similar numbers have been found from quite different arguments for the environment of the radio galaxy 4C 41.17 (Bicknell et al. (2000)).
The bubble interior looses a considerable amount of internal energy via synchrotron radiation, which is not included in the simulation. This lowers the requirement for the external density. Although the observed hydrogen mass in these systems barly exceeds , it is likely that they contain significantly more mass. Given that HZRG host the most powerful quasars of the universe, we should expect black hole masses of the order . The gas mass should be more than that. If the gas mass would be of the order , as is suggested here, the gas to black hole mass ratio would be similar to the bulge to black hole mass ratio found at low redshift. In that case, most of the shell’s mass would be – at any evolutionary state, the systems are observed at so far – in cold fragments just about to form stars.
The shell is not only thermally, but also gravitationally unstable. The time, when the instability on the shell surface occurs for the first time is (Wünsch & Palous (2001), again for constant energy injection rate and for the parameters of our model): . Gravitational and thermal instability will support each other. The Jeans mass in the shell is . Hence, the shell will form stars in globular clusters of that mass. Assuming an efficiency of , the shell would form, roughly, globular cluster systems. This is in remarkable agreement to what is found in nearby BCGs, like e.g. M87 (Harris et al. (1998)): BCGs show an excess of globular cluster systems of about compared to non BCG ellipticals with comparable luminosity. Sometimes, two distinguished globular cluster populations are observed. Harris et al. (1998) consider various formation scenarios in detail and conclude that a kind of galactic wind must have driven out a large fraction of the galaxies gas, before it was able to form stars.
When the shell fragments, its covering factor decreases further and the absorption vanishes. This scenario could nicely explain, why no absorbers are observed for galaxies larger than 50 kpc. Afterwards the shell would become visible in the optical, due to the newly born stars, which will also increase the ionization of the remaining parts of the absorbing shell. A bubble shaped star forming region like that can be found around the radio galaxy 1243+036 (van Ojik et al. (1996)).
These associated absorption systems also seem to be observed in high redshift quasars (Baker (1997); Baker (2001)). There, they have velocities of a few thousand km/s, consistent with the model, if one assumes that the line of sight in quasars is not far from the jet axis. In addition, this part of the shell could be accelerated by photoabsorption of photons from the quasar (Falle et al. (1981)).
In the simulation, we find that of shocked IGM are entrained into the cocoon. This number should not be taken too literally, because small scale turbulence could change that and high resolution studies are required to get this number accurate. Nevertheless, it is slightly more than the typical observed Lyman emitting gas mass. Higher resolution would also be essential in order to determine the mixing properties and density of this gas. The big vortex, we observe in the cocoon is an ideal accelerator for the entrained gas. In the simulation, the gas is swept along, and accumulates mainly on the left-hand side and along and next to the jet beam. There it is spun up to a velocity of km/s. We expect, that at higher resolution, small scale Kelvin-Helmholtz instabilities will entrain mass at the boundary of the vortex. This is also observed in other simulations (Krause & Camenzind (2001)). Given the high velocity of this propeller, it seems quite likely that emission line gas could be accelerated to the observed velocity of 1000 km/s. All that should be studied in more detail with simulations of higher resolution.
Acknowledgements.
This work was supported by the Deutsche Forschungsgemeinschaft (Sonderforschungsbereich 437).References
- Baker (1997) Baker, J.C. 1997 in The Most Distant Radio Galaxies, eds. Röttgering, H.J.A., Best, P.N., & Lehnert, M.D., 447
- Baker (2001) Baker, J.C. 2001 in Mass Outflow in active galactic nuclei, eds. Crenshaw, D.M., Kraemer, S.B. and George, I.M.
- Bicknell et al. (2000) Bicknell, G.V., et al. 2000, ApJ 540, 678
- Binette et al. (2000) Binette, L., Kurk, J.D., Villar-Martin, M., & Röttgering, H.J.A. 2000, A&A, 356, 23
- Carilli & Barthel (1996) Carilli, C.L. & Barthel, P.D. 1996, A&AR 7, 1
- Carilli et al. (2000) Carilli, C.L. et al. 2000, in Gas & Galaxy Evolution, eds. Hibbard, J.E., Rupen, M.P., & van Gorkom, J.H., ASP Conference Series
- Daly (1995) Daly, R.A. 1995, in Extragalactic Radio Sources, Proceedings of the 175th IAU Symposium, eds. Ekers, R., Fanti, C., & Padrielli, L., p319
- De Breuck et al. (2000) De Breuck, C., Röttgering, H., Miley, G., van Breugel, W., & Best, P. 2000, A&A, 362, 519
- Dyson et al. (1980) Dyson, J.E., Falle, S.A.E.G., & Perry, J.J. 1980, MNRAS, 191, 785
- Falle et al. (1981) Falle, S.A.E.G., Perry, J.J., & Dyson, J.E. 1981, MNRAS, 195, 397
- Fan et al. (2001) Fan, X. et al. 2001, AJ, 122, 2833
- Harris et al. (1998) Harris, W.E., Harris, G.L.H., & McLaughlin, D.E. 1998, AJ, 115, 1801
- Krause & Camenzind (2001) Krause, M. & Camenzind, M. 2001, A&A, 380, 789
- Meisenheimer et al. (2001) Meisenheimer, K. et al. 2001, A&A, 372, 719
- Norman et al. (1983) Norman, M.L., Winkler, K.A., & Smarr, L. 1983 in Astrophysical Jets, eds. Ferrari, A. & Pacholczyk, A.G., 227
- Pentericci et al. (1997) Pentericci, L., Röttgering, H. J. A., Miley, G. K., Carilli, C.L., & McCarthy, P. J. 1997, A&A, 326, 580
- Pentericci et al. (2001) Pentericci, L. et al. 2001, ApJS, 135, 63
- Steffen et al. (1997) Steffen, W. et al. 1997, MNRAS, 286, 1032
- Stone & Norman (1993) Stone, J.M. & Norman, M.L. 1993, ApJ, 413, 198
- Sutherland & Dopita (1993) Sutherland, R.S. & Dopita 1993, A&AS, 88, 253
- Thiele (2000) Thiele, M. 2000, Ph.D. thesis, University of Heidelberg, FRG
- van Breugel et al. (1999) van Breugel, W. et al. 1999, ApJ, 518, L61
- van Ojik et al. (1996) van Ojik, R. et al. 1996, A&A 313, 25
- van Ojik et al. (1997) van Ojik, R., Röttgering, H.J.A., Miley, G.K., & Hunstead, R.W. 1997, A&A, 317, 358
- West (1994) West, M.J. 1994, MNRAS 268,79
- Wünsch & Palous (2001) Wünsch, R. & Palous, J. 2001, A&A, 374,746
- Ziegler & Yorke (1997) Ziegler, U., Yorke, H. 1997, Comp. Phys. Comm., 101, 54