Are high-redshift damped Lyman galaxies Lyman-break galaxies? 111Based on observations made with the NASA/ESA Hubble Space Telescope. 222Based on observations collected at the European Southern Observatory, Paranal, Chile (ESO Programme 63.O-0618)
Abstract
We use deep HST STIS and NICMOS images of three spectroscopically confirmed galaxy counterparts of high-redshift damped Ly (DLA) absorbers (one of which is a new discovery) to test the hypothesis that high-redshift DLA galaxies are Lyman-break galaxies. If this hypothesis is correct the emission properties of DLA galaxies must lie within the range of emission properties measured for Lyman-break galaxies of similar absolute magnitude. This will be true regardless of selection biases in the sample of detected DLA galaxies. We test this prediction using several emission properties: half-light radius, radial profile (Sersic parameter), optical-to-near-infrared colour, morphology, Ly emission equivalent width, and Ly emission velocity structure. In all cases the measured values for the DLA galaxies lie within the range measured for the population of Lyman-break galaxies. None of the measurements is in conflict with the prediction. We conclude that the measured emission properties of the three DLA galaxies studied here are consistent with the conjecture that high-redshift DLA galaxies are Lyman-break galaxies. We show that this result does not conflict with the observation that the few high-redshift DLA galaxies discovered are mostly fainter than spectroscopically confirmed Lyman-break galaxies.
1 Introduction
At any redshift the majority of the neutral hydrogen in the Universe is contained in the absorbers of highest column density, the damped Ly (DLA) absorbers. Observations of the column density distribution functions for both HI and metals can be used to compute the cosmic mean densities and as functions of redshift . The metallicities of the DLA systems have a large scatter at all redshifts (Pettini et al. 1999; Prochaska & Wolfe 1999); the mean metallicity is 5-10% solar at and, within the current statistical uncertainties, may or may not increase with decreasing redshift, in accordance with models of cosmic chemical evolution (Kulkarni & Fall 2002). Selection biases caused by dust could dilute the apparent rate of chemical enrichment in the DLA absorbers (Pei & Fall 1995; Boissé et al. 1998). The dust-to-metals ratio also has a large scatter among individual DLA absorbers, but the mean value appears to remain roughly constant with redshift at about the value in the Milky Way (Pei, Fall, & Bechtold 1991; Pettini et al. 1997). The presence of metals implies that DLA absorbers are, or have been, in a state of active star formation and it is therefore interesting to ask whether those stellar populations are themselves visible, and if they are related to other known classes of high redshift objects. In this paper we shall narrowly focus on a single question: “Are high-redshift damped Ly galaxies Lyman-break galaxies?”.
The Lyman-break galaxies (LBGs, Steidel et al. 1996) are starburst galaxies at high redshift, recognisable by their relatively flat restframe ultraviolet continuum, and a sharp discontinuity at the Lyman limit. Under the definition of LBGs we include all objects identified by their characteristic continuum shape as such, on the basis of broadband photometry alone i.e. without requiring spectroscopic confirmation. The typical brightness of an LBG is not a well defined quantity as it depends strongly on the flux limit of the survey. In particular one may consider two distinct types of LBG survey, where surveys concerned solely with the determination of photometric redshifts have significantly fainter flux limits than those which classify as LBGs only galaxies with spectroscopically confirmed redshifts. It is of interest to note that to an AB magnitude limit , i.e. flux limited in the restframe optical continuum, nearly all galaxies in the Hubble Deep Field N in the redshift range are classified as LBGs (Papovich, Dickinson, & Ferguson 2001). With the caveat that this sample is small, it may be concluded that for observations in the optical and near-infrared, to very faint magnitudes, any galaxies with steep continuum, either due to reddening or to the presence of a population of old stars, are a minority population. So at these wavelengths, and down to the AB magnitude limit , the term ‘Lyman-break galaxy’ is essentially synonymous with ‘high-redshift galaxy’.
The global rate of star formation at these redshifts measured from emission from the LBGs is consistent with the rate of star formation inferred from the change with cosmic time of and in the DLA absorbers (Pei, Fall, & Hauser 1999), modulo uncertain corrections in both calculations for the effects of dust. The simplest interpretation of these results is that the DLA absorbers are the reservoirs of gas from which the stars in LBGs are forming. If this is the case, for every high-redshift DLA absorber detected in the spectrum of a quasar there should be stellar emission visible from a Lyman-break galaxy at the absorption redshift, coincident with or near to the line of sight to the quasar 333The covering factor of DLA absorbers is greater than the fraction of sky covered by detectable optical emission from LBGs. So the absorbing gas would extend beyond the optically visible stellar emission.. Yet searches for this stellar emission have had very little success (for reviews and discussions of past surveys see Møller & Warren 1993; Kulkarni et al. 2000). The large number of unsuccessful attempts to identify the galaxy counterparts of DLA absorbers, hereafter “DLA galaxies”, indicates that most DLA galaxies at have very small impact parameters or are very faint (e.g. Steidel, Pettini, & Hamilton 1995a). Indeed searches that have produced lists of candidates pending spectroscopic confirmation (e.g. Ellison et al. 2001a), as well as the very limited set of confirmed identifications available at present (Fynbo, Møller, & Warren 1999), both suggest that DLA galaxies mostly are fainter than LBGs, a result supported by upper limits on H emission (Bunker et al. 1999; Kulkarni et al. 2001). This is seen by some to contradict the view that DLA galaxies are Lyman-break galaxies. In particular the theoretical prediction that the angular momentum distribution of dark matter halos should cause LBGs and DLA galaxies to form two “quite distinct populations” (Mo, Mao, & White 1999) has received much attention, and it has been suggested that DLA galaxies make up a separate low surface brightness galaxy population (Jimenez, Bowen, & Matteucci 1999).
At redshifts the DLA galaxies are much easier to identify, but it is far from clear how they are related to high-redshift DLA galaxies. Nevertheless it has been found that also the low redshift DLA galaxies typically are sub (Steidel et al. 1995b; Lanzetta et al. 1997; Miller, Knezek, & Bregman 1999; Cohen 2001; Turnshek et al. 2001; Bouché et al. 2001).
In this paper we present results from deep images of three spectroscopically confirmed DLA galaxies observed with the HST instruments STIS and NICMOS, and make a comparison of their emission properties with the emission properties of LBGs. The images presented here are the first combined (both STIS and NICMOS) results from a large campaign of HST observations searching for 18 DLA galaxies towards 16 quasars. The targets, the strategy, and the goals are presented in detail in our first paper (Warren et al. 2001) which also presented the results of the NICMOS imaging campaign. Follow-up spectroscopy is being carried out with the ISAAC and FORS instruments on the ESO VLT. In §2 we present a discussion of how to use such a search for DLA galaxies to test the hypothesis that DLA galaxies are LBGs. In §3 we describe briefly the HST observations, and the measurements of the images. In §4 we make a comparison of the measured properties, including sizes, colours, and morphologies, with the properties of LBGs of similar absolute magnitude. In §5 we address the question posed at the top, and present our conclusions. Cosmological parameters of , , are assumed, and the term high redshift implies in this paper .
2 Interpreting searches for DLA galaxies
Because of the glare from the quasar the detectability of a DLA galaxy is dependent both on the brightness of the galaxy and the impact parameter (in addition to the brightness of the quasar and the stability of the point spread function (psf)). Any sample of DLA galaxies, including the small sample of three discussed here, is biased towards brighter objects and larger impact parameters. Yet if DLA galaxies are LBGs, the measured emission properties of any DLA galaxy must fall within the range of emission properties for LBGs of the same absolute magnitude. This statement is true regardless of how the DLA galaxies were selected. This is the basic prediction that we test in this paper. We compare the measured half-light radii, and colours of DLA galaxies, as well as the morphologies, and Ly emission properties, against the same properties measured for LBGs of similar absolute magnitude.
If DLA galaxies are LBGs they will nevertheless have a different luminosity distribution compared to a flux limited sample of LBGs, because DLA absorbers are detected in proportion to their gas cross section. It follows that the luminosity distribution of DLA galaxies is given by the LBG luminosity function weighted by the luminosity dependence of the gas cross section. A simple calculation illustrates the importance of this for the interpretation of searches for DLA galaxies. For a luminosity function of Schechter form, and a power-law relation between gas radius and luminosity , the mean luminosity of galaxies selected by gas cross section is (Fynbo, Møller, & Warren 1999; see also Wolfe et al. 1986; Impey & Bothun 1989). For LBGs at , Adelberger & Steidel (2000) measure . Depending on the value of , the value of the mean luminosity can be much less than . For example for , . In fact there is some theoretical support for a value of (Haehnelt, Steinmetz, & Rauch 2000), based on the kinematics of DLA absorbers as measured from the absorption profiles of low ionisation species. So the notion that DLA galaxies are typically fainter than is perfectly compatible with the hypothesis that DLA galaxies are Lyman-break galaxies. We note that a consequence of this is that the value of any property which depends on galaxy luminosity will differ between galaxy samples selected either by absorption (DLA galaxies) or by emission (LBG galaxies). For example, since spatial clustering is weaker for less massive (hence less luminous) galaxies (the effects of natural biasing in a hierarchical clustering scenario), we expect DLA galaxies to have a lower clustering amplitude than the emission-selected LBGs.
In the longer term, when we have completed our HST survey, we will have a sample of DLA galaxies complete within well defined selection criteria. Using the measured impact parameters we will be able to determine the form of the relation between radius and luminosity. In fact we have already attempted this (Fynbo et al. 1999). One point to note is that the conclusion that DLA galaxies are much fainter than is quite robust, and insensitive to the uncertainty of the faint-end slope of the Lyman-break galaxy luminosity function. For a different value of , the value of must be adjusted in order to reproduce the observed small impact parameters of DLA galaxies. The result is that the value of changes little, because the exponent appearing in the expression for remains approximately constant.
3 Properties of three DLA galaxies
In this section we detail the measurement of the emission properties of the three DLA galaxies, which will be compared against the LBGs in the next section.
3.1 Observations and targets
The larger imaging campaign is described by Warren et al. (2001). We are obtaining high-resolution optical and near-infrared images of quasars, searching for faint galaxies close to the quasar line of sight. These are candidate DLA galaxies, targets for spectroscopic follow up. In Warren et al. (2001) we list the 16 target quasars and their coordinates, we tabulate details of the 18 DLA absorbers, present details of the NICMOS observations, and the list of NICMOS candidates. Each quasar was observed for three orbits with the NIC2 camera and the F160W filter. The NICMOS images reach to an AB magnitude typically of . A total of 41 candidate counterparts were detected in boxes of side centered on each quasar. Spectroscopy of this candidate list is complete. So far one new spectroscopically confirmed DLA galaxy has been discovered. The other two DLA galaxies discussed here are previous discoveries.
In Møller et al. (in preparation) we will present the candidates detected using STIS. With STIS we are imaging in the 50CCD configuration i.e. without a filter in order to reach as deep as possible. In this configuration the effective central wavelength is 5851.5Å and the FWHM is 4410.3Å so 50CCD corresponds to a very wide V magnitude. Each quasar was observed for two orbits, at different orientations, resulting in a detection limit on the combined image of typically (AB magnitude). Because the STIS images reach much fainter magnitudes than the NICMOS images, the number of candidates in the STIS images is typically a factor 2-3 higher than in the NICMOS images.
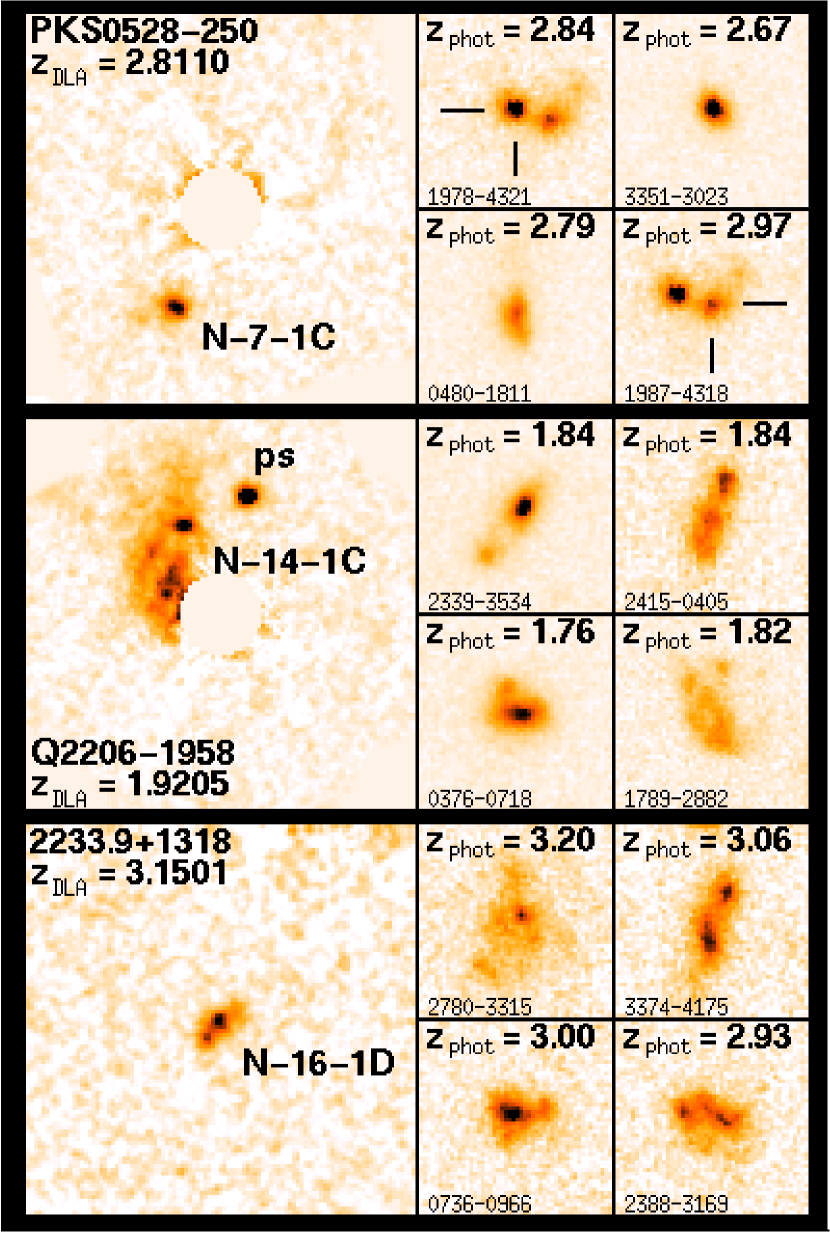
Fig. 1 reproduces the STIS images of the fields of the three quasars PKS 0528–250, Q 2206–1958, and 2233.9+1318, where the frames from both orbits have been registered and summed. The images show the field after subtraction of the quasar image. Strong residuals near the center of the quasar image have been masked. The DLA galaxies are indicated in each frame, labeled using the numbering scheme in the NICMOS paper. The measured impact parameters are , , , respectively. In each case the confirmed galaxies are the candidates in the NICMOS frames closest to the line of sight to the quasar. The three DLA galaxies have all been confirmed by spectroscopic detection of Ly in emission, but were originally found with three different search techniques. N-7-1C was identified on a deep Ly narrow band image obtained from the ground, N-14-1C was found on the image from our current STIS campaign (Fig. 1), and is also detected in the NICMOS image, and N-16-1D was found on ground based images with the Lyman-break technique. Careful psf-subtraction was in all cases instrumental in the discovery. We now briefly summarise previous results obtained on each of the three DLA galaxies.
3.1.1 N-7-1C
The galaxy N-7-1C was discovered by Møller & Warren (1993), who called it S1. The DLA absorber lies at a similar redshift to the quasar. Using spectroscopic data Warren & Møller (1996) and Møller, Warren, & Fynbo (1998) argued that the physical separation is sufficiently large that the ionising flux from the quasar is not important. This result was supported by Ge et al. (1997) who concluded that the distance between the DLA absorber and the quasar must be larger than 1 Mpc, on the basis of ionization modelling (see also Ledoux et al. 1998; Ellison et al. 2001b). Møller & Warren (1998) obtained WFPC2 images of N-7-1C and showed that the luminosity profile is similar to the profile of LBGs at similar redshift. Ge et al. (1997) reported a metallicity of the DLA absorber of 10% solar and a dust-to-gas ratio of 8% of the Milky Way value. Lu, Sargent, & Barlow (1997) were not able to fit the absorption spectrum of this DLA absorber into the rotating-disk model of Prochaska & Wolfe (1997, 1998), which requires a ‘leading-edge asymmetry’.
3.1.2 N-14-1C
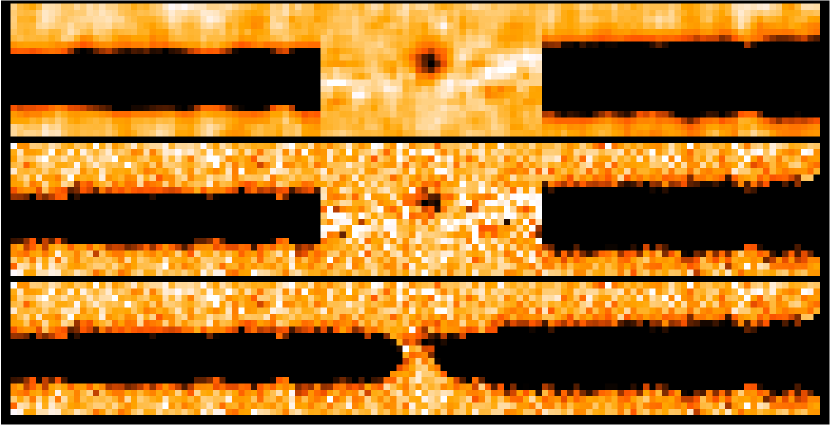
The galaxy N-14-1C is a new discovery. The spectrum confirming the identification is provided in Fig. 2. Details are presented in Tables 1 and 2. The metallicity of the corresponding absorber is 1/3 of the solar value, but despite being one of the most metal rich DLA absorbers known there is no evidence for dust (Prochaska & Wolfe 1997). In this case Prochaska & Wolfe (1997) found evidence for the leading edge asymmetry in the low ion absorption lines, which they interpret as evidence for a rotating disk.
| Quasar | Galaxy | aaImpact parameter measured in the STIS image (″) | Sersic | Ellip. | bb is the angle between the galaxy orientation and the line joining the galaxy to the quasar i.e. a galaxy pointing at the quasar has | |||||
|---|---|---|---|---|---|---|---|---|---|---|
| ″ | kpc | ″ | kpc | deg. | ||||||
| PKS 0528–250 | N-7-1C | 1.14 | 0.26 | 74 | ||||||
| Q 2206–1958 | N-14-1C | 0.99 | ||||||||
| 2233.9+1318 | N-16-1D | 2.51 | 0.61 | 24 | ||||||
Note. — For N-14-1C magnitudes are calculated from the integrated flux in an aperture of 0.6″ diameter, with no aperture correction. All other magnitudes are total magnitudes, computed as described in the text. All magnitudes are on the AB system.
| Galaxy | (Ly –DLA) | Ly FWHM | Ly flux | Ly EWrest | ||||
|---|---|---|---|---|---|---|---|---|
| cm-2 | km s-1 | km s-1 | erg s-1 cm-2 | |||||
| N-7-1C | 2.797 | 21.35 | 2.8110 | 2.8136(5) | ||||
| N-14-1C | 3.559 | 20.65 | 1.9205 | 1.9229(6) | ||||
| N-16-1D | 3.298 | 20.00 | 3.1501 | 3.1530(3) | 360 |
Note. — The data are taken from: this work, Djorgovski et al. (1996), Lu, Sargent and Barlow (1997), Warren and Møller (1996), Møller and Warren (1998), Warren et al. (2001)
3.1.3 N-16-1D
The galaxy N-16-1D was first reported by Steidel, Pettini, & Hamilton (1995a) who called it N1. Spectroscopic confirmation of the redshift was obtained by Djorgovski et al. (1996). Lu, Sargent, & Barlow (1997) reported a metallicity ‘typical of DLA galaxies at such redshifts’ ([Fe/H] = -1.4). They also found evidence for leading-edge asymmetry in the absorption spectrum.
3.2 Results
Photometry and profile fitting. In Table 1 we summarise the results of STIS and NICMOS photometry, and profile fitting of the galaxies. The columns list successively the quasar name, the galaxy name, the STIS and NICMOS AB magnitudes, the galaxy impact parameter , i.e. the angular offset of the galaxy from the quasar, and the details of the deconvolved surface-brightness profiles measured on the STIS frames. The measurement of N-14-1C was problematic, and is described later. For N-7-1C and N-16-1D we followed the same procedure described by Warren et al. (2001). Briefly, the best fit galaxy profile is determined by convolving parameterised models with the point spread function, and searching for the minimum. The confidence intervals on each parameter, marginalising over the other parameters, are computed on the basis of the Poisson errors for each pixel by locating the orthogonal tangent planes to the ellipsoid. We used the Sersic model, where the surface brightness as a function of radius is , where is the deconvolved half-light radius. Note that corresponds to an exponential profile, and to a de Vaucouleurs profile (for details see Warren et al. 2001). Table 1 lists , the value of , the galaxy ellipticity, and the parameter which is the angle between the galaxy major axis and the line pointing to the quasar. For these two sources the STIS magnitudes are total magnitudes, calculated by extrapolating the model fits to infinite radius. Because of the low of the NICMOS frames total NICMOS magnitudes were measured by determining the scaling of the STIS models that provided the best fit to the NICMOS data.
The galaxy N-14-1C has an irregular morphology (Fig. 1) with a bright knot at the end of a diffuse structure. The measured parameters of the fit varied greatly with the size of the fitting region. Therefore we resorted to aperture photometry to measure magnitudes, with a circular aperture of 0.6″ diameter. In order to obtain an estimate of the half-light radius we employed a model with fewer parameters, a circularly symmetric exponential model, which was much less sensitive to box size. Since the model is not a good fit we assigned a large uncertainty, , to this measurement.
Spectroscopy. As stated above the galaxy N-14-1C is a new discovery. The confirming spectrum was obtained with the FORS1 instrument on the European Southern Observatory 8.2m telescope UT1 on the night of 1999 August 12. The integration time was 8000s. With a slit width of and the 600B grating the resolution was 3.0Å. We used the SPSF method of Møller (2000) to extract the galaxy spectrum. The software optimises the spectral extraction of a faint galaxy close to a bright companion (here the quasar). In Fig. 2 we show the region of the spectrum around the wavelength of the DLA absorber, . An emission line at a wavelength of 3553.4Å, corresponding to Ly at redshift of , is clearly visible. The close agreement between the emission and absorption redshifts, and the small impact parameter of the galaxy confirm that N-14-1C is the DLA absorber galaxy counterpart.
In Table 2 we summarise relevant properties of the Ly emission line of the three galaxies. In successive columns are listed the galaxy name, the quasar redshift, the column density and redshift of the absorption line, and then the following properties of the emission lines: redshift, velocity difference relative to the absorber, FWHM, flux, and rest-frame equivalent width.
4 Comparison with other high-redshift galaxies
In this section we compare the measured emission properties for the three DLA galaxies against the distribution of emission properties measured for LBGs, also observed with HST. We begin by considering the half light radii and the observed optical-to-near-infrared colours. To obtain a comparison sample of LBGs we started with the catalogue of Cohen et al. (2000) of redshifts for galaxies in the Hubble Deep Field (HDF) N. We selected the 26 galaxies with spectroscopic redshifts in the range . This sample was reduced to 24 by removing two galaxies where the published redshifts are the subject of debate (Papovich et al. 2001). Marleau & Simard (1998) have measured the surface brightness profiles of galaxies in the HDF using Simard’s GIM2D software. We matched 21 of the 24 galaxies with their catalogue, and this forms our comparison sample of LBGs.


Half-light radii: In the list of Marleau & Simard (1998) 16 of the 21 galaxies show a single component. The other five galaxies are decomposed into a total of 14 components. We extracted from their catalogue the half light radius and the total apparent AB magnitude for the WFCAM F606W passband, , for each of the 30 galaxies or components. (Note that the pivot wavelength for the WFCAM F606W configuration is very close to the pivot wavelength for the STIS 50CCD passband.) These data are presented in Fig. 3 (upper plot), plotting half-light radius against absolute magnitude, (the AB absolute magnitude at a rest wavelength Å – we computed the small corrections assuming a continuum shape ). The LBGs are plotted as open symbols. Our measurements of the same parameters for the three DLA galaxies are plotted as filled symbols. There is no strong trend of size with luminosity for the LBGs. The DLA galaxies have similar luminosities to the faintest of the LBGs plotted. The range of half-light radii for the DLA galaxies is similar to the range for the LBGs, although the half-light radius for N-14-1C is a little larger than the LBG radii plotted. Note, however, that it is quite likely that Marleau and Simard would have decomposed a galaxy like N-14-1C into two components.
Marleau & Simard (1998) found that the LBGs mostly have small bulge-to-disk ratios. The small values of the Sersic parameter listed in Table 1 for N-7-1C and N-16-1D imply similarly disk-dominated profiles. At present we cannot quantify how N-14-1C fits into this pattern.
Optical-to-near-infrared colours: Papovich et al. (2001) provide optical-to-near-infrared () colours for high-redshift galaxies in the HDF N. For the same 21 galaxies considered above they list 23 components. Since there is not a one-to-one correspondence between their list of components and the list of Marleau & Simard (above) we have used the total apparent magnitudes from Papovich et al. to compute absolute magnitudes (their total magnitudes are typically 0.3 mag. fainter than the corresponding values in Marleau & Simard 1998).
In Fig. 3 (lower plot) we plot colour against absolute magnitude for the LBGs and DLA galaxies, using the same symbols as in the upper plot. As noted by Papovich et al. (2001) there is a marked trend of colour with luminosity, in the sense that galaxies of lower luminosity are bluer. They point out that this trend could reflect a sequence in age, in metallicity, or in dust content, but they do not draw any conclusions on this point. The DLA galaxies are very faint and blue, and have colours in the same range as LBGs of the same absolute magnitude.
Morphology: In addition to the size/luminosity relation, one may consider the more detailed morphology of the objects. Are DLA galaxies for example more disturbed, or do they have more components than LBGs? To address this question we searched the list of Fontana et al. (2000) for LBGs in the HDF S with redshift and V magnitudes as similar as possible to each of the three DLA galaxies. To be specific we selected, for each DLA galaxy, the four LBGs with and that gave the smallest value of the sum . We then extracted a image centred on each object. The four objects are shown in Fig. 1 next to the corresponding DLA galaxy. The three DLA galaxies themselves span a wide range in general morphology. N-7-1C has a regular single core morphology, N-14-1C is dominated by a single bright knot at the end of an extended structure, and N-16-1D is elongated with two or three compact components. Qualitatively, one can find examples that resemble each of the DLA galaxies amongst the Lyman-break galaxy images.
Ly emission/absorption: The restframe line equivalent widths (EWs) for the Ly emission lines from the DLA galaxies N-7-1C and N-16-1D are given in the literature as 51 and 37 Å, but with large errors due to uncertainties in determining their broad band fluxes. We have here calculated EWs for all three DLA galaxies as follows: The Ly line falls in all cases inside the 50CCD passband, so we first subtract the measured Ly flux from the flux. A linear interpolation of the and (corrected for Ly ) fluxes then allow a computation of the continuum flux at the wavelength of the redshifted Ly line. The resulting EWs are listed in Table 2, and cover the range 63 to 83Å. The median EW found here is larger than that for LBGs (about 50% of the LBGs have Ly in absorption so their median EW is close to zero). The distribution of Ly EWs for confirmed DLA galaxies will inevitably be skewed towards large emission line EWs as this makes spectroscopic confirmation easier. Nevertheless the values reported here lie within the measured range for LBGs (EWabs = 70Å to EWem = 100Å in a field 92% completed for objects having , Steidel et al. 2000), and so are in agreement with the basic prediction we are testing.
Table 2 also lists the velocity difference between the Ly emission and absorption lines (Ly –DLA) for the three DLA galaxies. Part of the velocity difference could be due to relative motion, either in the form of random motion of sub-clumps, of ongoing merging processes (Haehnelt, Steinmetz, & Rauch 1998) or of rotation (Prochaska & Wolfe 1997). However, it is noticeable that in all cases the emission line is redshifted relative to the DLA absorber. The lines are also rather broad km s-1 FWHM. The same characteristics have been noted in the LBGs (e.g. Pettini et al. 2000; Pettini et al. 2001; see also Schaye 2001) and can be explained in terms of radiative transfer effects of Ly photons escaping through outflowing gas. Photons at the Ly wavelength in the rest-frame of the moving HI are scattered repeatedly and are eventually absorbed by dust; those in the wings of the Ly line have a smaller scattering cross-section and escape from the neutral gas (Kunth et al. 1998). In terms of Ly line emission, the properties of all three DLA galaxies are therefore in good agreement with those of the LBGs.
5 Discussion and conclusions
In this paper we have presented new STIS imaging data and VLT spectroscopic data on a small set of three DLA galaxies. Two of those were previously known, one is a new discovery. The small set of three objects does not allow a conclusive answer to the dispute over whether DLA absorbers arise in large disks or merging sub-clumps. Our data set does allow us, however, to address the more fundamental (and model independent) question of the possible relationship between DLA and Lyman-break galaxies.
We have compared the emission properties of the three DLA galaxies with the emission properties of the population of LBGs. If DLA galaxies are LBGs then the measured values for an emission property for any DLA galaxy will lie within the range of values measured for LBGs of similar absolute magnitude – regardless of the selection biases that are inherent in the sample of DLA galaxies. We have tested this prediction, making the comparison for the following emission properties: half-light radius, radial profile (Sersic parameter), optical-to-near-infrared colour, morphology, Ly emission EW, and Ly emission velocity structure. In all cases the measured values for the DLA galaxies lie within the range measured for LBGs. None of the measurements is in conflict with the prediction. Therefore we conclude that the measured emission properties of the three damped Ly galaxies studied here are consistent with the conjecture that damped Ly galaxies are Lyman-break galaxies.
Is the number of detections in the follow-up spectroscopy so far completed of the 41 NICMOS candidates also consistent with this conjecture? Since two of the DLA galaxies discussed here were previously known they are ignored in this statistical analysis. We have obtained deep VLT FORS spectra, average integration time 6000s, of 11 of the 22 NICMOS candidates in 6 fields, targeting 8 DLA absorbers. We have identified and confirmed one new DLA galaxy, and we would expect to have confirmed new DLA galaxies. Here the factor is the fraction of DLA galaxies detectable in the NICMOS images i.e. above the magnitude and impact-parameter detection limits of our survey (approximately , – full details provided in Warren et al., 2001) and is the fraction of DLA galaxies with detectable Ly flux (our detection limit ranges from 0.2 to erg s-1 cm-2 depending on redshift, column density and impact-parameter of the DLA). If DLA galaxies are LBGs then both of the factors and are likely to be substantially less than unity (§2 and §4). Therefore the detection of only one new DLA galaxy so far is consistent with the hypothesis, but the number of detections is clearly too small to rule out other interpretations.
The combination of information on both the stellar (emission) and interstellar (absorption) components of the DLA galaxies is crucial for a complete understanding of these objects. The result presented here is a step towards combining the information from absorption-line and emission studies of high-redshift galaxies. To prove that DLA galaxies are LBGs, the test we have made is a necessary but not sufficient condition. We are building a larger sample of DLA galaxies with well-defined selection properties, from spectroscopy of candidates found in deep HST images. A definitive test will be possible with this sample. Knowing the selection biases we can determine the relation between gas radius and luminosity that explains the number of DLA galaxies detected, their luminosities, and their impact parameters.
References
- (1) Adelberger, K., & Steidel, C. C. 2000, ApJ, 544, 218
- (2) Boissé, P., Le Brun, V., Bergeron, J., & Deharveng, J. M. 1998, A&A, 333, 841
- (3) Bouché, N., Lowenthal, J. D., Charlton, J. C., Bershady, M. A., Churchill C. W., & Steidel, C. C. 2001, ApJ, 550, 585
- (4) Bunker, A. J., Warren, S. J., Clements, D. L., Williger, G. M., & Hewett, P. C. 1999, MNRAS, 309, 875
- (5) Cohen, J. G., 2001, AJ, 121, 1275
- (6) Cohen, J. G., Hogg, D. W., Blandford, R., Cowie, L. L., Hu, E., Songaila, A., Shopbell, P., & Richberg, K. 2000, ApJ, 538, 29
- (7) Djorgovski, S. G., Pahre, M. A., Bechtold, J., & Elston, R. 1996, Nature, 382, 234
- (8) Ellison, S. L., Pettini, M., Steidel, C. C., & Shapley, A. E. 2001a, ApJ, 549, 770
- (9) Ellison, S. L., Yan, L., Hook, I. M., Pettini, M., Wall, J. V., & Shaver, P. 2001b, A&A, in print (astro-ph/0112135)
- (10) Fontana, A., D’Odorico, S., Poli, F., Giallongo, E., Arnouts, S., Cristiani, S., Moorwood, A., & Saracco, P. 2000, AJ, 120, 2206
- (11) Fynbo, J. U., Møller, P., & Warren, S. J. 1999, MNRAS, 305, 849
- (12) Ge, J., Bechtold, J., Walker, C., Black, J. H. 1997, ApJ, 486, 727
- (13) Haehnelt, M. G., Steinmetz, M., & Rauch, M. 1998, ApJ, 495, 647
- (14) Haehnelt, M. G., Steinmetz, M., & Rauch, M. 2000, ApJ, 534, 594
- (15) Impey, C., & Bothun, G. 1989, ApJ, 341, 89
- (16) Jimenez, R., Bowen, D. V., & Matteucci, F. 1999, ApJ, 514, L83
-
(17)
Kulkarni, V. P., & Fall, S. M. 2002, ApJ, submitted
- (18) Kulkarni, V. P., Hill, J. M., Schneider, G., Weymann, R. J., Storrie-Lombardi, L. J., Rieke, M. J., Thompson, R. I., & Jannuzi, B. T. 2000, ApJ, 536, 36
- (19) Kulkarni, V. P., Hill, J. M., Schneider, G., Weymann, R. J., Storrie-Lombardi, L. J., Rieke, M. J., Thompson, R. I., & Jannuzi, B. T. 2001, ApJ, 551, 37
- (20) Kunth, D., Mas-Hesse, J. M., Terlevich, R., Lequeux, J., & Fall, S. M. 1998, A&A, 334, 11
- (21) Lanzetta, K. M., Wolfe, A. M., Altan, H., Barcons, X., Chen, H.-W., Fernandez-Soto, A., Meyer, D. M., Ortiz-Gil, A., Savaglio, S., Webb, J. K., Yahata, N. 1997, AJ, 114, 1337
- (22) Ledoux, C., Petitjean, P., Bergeron, J., Wampler, E. J., & Srianand, R. 1998, A&A, 337, 51
- (23) Lu, L., Sargent, W. L. W., & Barlow, T. A. 1997, ApJ, 484, 131
- (24) Marleau, F. R., & Simard, L. 1998, ApJ, 507, 585
- (25) Miller, E. D., Knezek, P. M., & Bregman, J. N. 1999, ApJ, 510, L95
- (26) Mo, H. J., Mao, S., & White, S. D. M. 1999, MNRAS, 304, 175
- (27) Møller, P. 2000, The Messenger, 99, 31
- (28) Møller, P., & Warren, S. J. 1993, A&A, 270, 43
- (29) Møller, P., & Warren, S. J. 1998, MNRAS, 299, 661
- (30) Møller, P., Warren, S. J., & Fynbo, J. U. 1998, A&A, 330, 19
- (31) Papovich, C., Dickinson, M., & Ferguson, H. C. 2001, ApJ, submitted (astro-ph/0105087)
- (32) Pei, Y. C., Fall, S. M., & Bechtold, J. 1991, ApJ, 378, 6
- (33) Pei, Y. C.,& Fall, S. M. 1995, ApJ, 454, 69
- (34) Pei, Y. C., Fall, S. M., & Hauser, M. G. 1999, ApJ, 522, 604
- (35) Pettini, M., Ellison, S. L., Steidel, C. C., & Bowen, D. V. 1999, ApJ, 510, 576
- (36) Pettini, M., King, D. L., Smith, L. J., & Hunstead, R. W. 1997, ApJ, 478, 536
- (37) Pettini, M., Steidel, C. C., Adelberger, K. L., Dickinson, M., & Giavalisco, M. 2000, ApJ, 528, 96
- (38) Pettini, M., Shapley, A. E., Steidel, C. C., Cuby, J.-G., Dickinson, M., Moorwood, A. F. M., Adelberger, K. L., & Giavalisco, M. 2001, ApJ, 554, 981
- (39) Prochaska, J. X., & Wolfe, A. M. 1997, ApJ, 487, 73
- (40) Prochaska, J. X., & Wolfe, A. M. 1998, ApJ, 507, 113
- (41) Prochaska, J. X., & Wolfe, A. M. 1999, ApJS, 121, 369
- (42) Schaye, J. 2001, ApJ, 559, L1
- (43) Steidel, C. C., Adelberger, K. L., Shapley, A. E., Pettini, M., Dickinson, M., & Giavalisco, M. 2000, ApJ, 532, 170
- (44) Steidel, C. C., Bowen, D. V., Blades, J. C., & Dickinson, M. 1995b, ApJ, 440, L45
- (45) Steidel, C. C., Giavalisco, M., Pettini, M., Dickinson, M., & Adelberger, K. L. 1996, ApJ, 462, L17
- (46) Steidel, C. C., Pettini M., & Hamilton D., 1995a, AJ, 110, 2519
- (47) Turnshek, D. A., Rao, S., Nestor, D., Lane, W., Monier, E., Bergeron, J., & Smette, A. 2001, ApJ, 553, 288
- (48) Warren, S. J., & Møller, P. 1996, A&A, 311, 25
- (49) Warren, S. J., Møller, P., Fall, S. M., & Jakobsen, P. 2001, MNRAS, 326, 759
- (50) Wolfe, A. M., Turnshek, D. A., Smith, H. E., & Cohen, R. D. 1986, ApJS, 61, 249