CO and Dust in PSS 2322+1944 at a redshift of 4.12
Using the IRAM interferometer we have detected J=43 and 54 CO line emission toward the radio quiet quasar PSS 2322+1944. At a redshift of this is the fourth and strongest detection of CO at . The velocity-integrated CO J=43 and J=54 line fluxes are and , and the linewidth is . The CO J=109 was searched for but not detected with an upper intensity limit of 30 mJy. The 1.35 mm (250 rest wavelength) continuum flux density is 7.51.3 mJy, in agreement with previous bolometer measurements at 1.2 mm with the 30-m IRAM telescope. The 3 mm (580 rest wavelength) continuum is not detected with a 3 upper limit of 0.7 mJy. We also report observations of the 450 continuum in PSS 2322+1944 using the SCUBA array at the JCMT. The quasar was detected with a 450 flux density of . At the angular resolution of at 1.3 mm and at 3.2 mm, the interferometer observations do not show evidence of spatial extension in the continuum or CO line emission. Assuming no gravitational magnification, we estimate a molecular gas mass of . The molecular gas is warm () and dense (). The infrared-to-CO luminosity ratio is , comparable to the values found for ultraluminous infrared galaxies. The detection of CO emission in this high redshift QSO provides further evidence that the radio emission and the millimeter to submillimeter continuum emission are predominantly powered by a starburst which is coeval with the AGN activity.
Key Words.:
Galaxies: formation – Quasars: emission lines – Quasars: individual: PSS 2322+1944 – Cosmology: observations – Cosmology: early Universe – Radio lines: galaxies1 Introduction
The study of dust and molecular gas in sources at high redshift has opened up new ways to probe the physical conditions during the early evolution of galaxies and to study the star formation history in the early universe. Spatially resolved observations of the molecular gas content in the host galaxies of high- quasars are a key for understanding the relationship between black hole formation and spheroidal galaxy formation. At redshifts , the CO J=10 line has been detected in 14 QSOs (Evans et al. 2001; Casoli & Loinard 2002) indicating large masses of molecular gas (a few ) fueling both the AGN and star formation in the QSO host galaxies. At higher redshifts, although the lines are broad and weak and precise redshifts are difficult to predict, in the last decade 12CO emission was detected in 15 galaxies at (see Guilloteau 2002 and reference therein; Andreani et al. 2000; Barvainis et al. 2002). Most of the detections were obtained for high rotational transitions of CO (J=32 to 98) lines which are redshifted to millimeter wavelengths. In a few cases, the J=21 and 10 lines were detected at centimeter wavelengths (Carilli et al. 1999, 2002; Papadopoulos et al. 2001). These CO observations imply that the high redshift galaxies contain large amounts, a few , of molecular gas which are predominantly excited by giant starbursts with star formation rates (see, e.g., Guilloteau et al. 1997, 1999).
In recent years we have concentrated our search for high- CO emission to QSOs with strong (sub)millimeter dust continuum emission. Based on the first surveys of (sub)millimeter emission of high- QSOs (McMahon et al. 1994; Omont et al. 1996a), we reported three detections of CO emission in sources: BR 12020725 (Omont et al. 1996b), BRI 13350415 (Guilloteau et al. 1997) and BRI 09520115 (Guilloteau et al. 1999). We recently extended these surveys for continuum emission using the Max-Planck millimeter bolometer (MAMBO) array at the 30-meter (Omont et al. 2001; Carilli et al. 2001a) and SCUBA at the JCMT (Isaak et al. 2002). Continuum emission was detected toward 35 new high- QSOs: Omont et al. (2001) and Isaak et al. (2002) observed a total of 75 bright quasars at from the Palomar Sky Survey (PSS) sample and detected 19 sources; Carilli et al. (2001a) made a deeper survey of a sample of 41 QSOs at selected from the Sloan Digital Sky Survey (SDSS) and detected 16 of them.
PSS 2322+1944, discovered by Djorgovski et al. (in prep.), is the brightest QSO in the survey of PSS quasars by Omont et al. (2001) and Isaak et al. (2002), with flux densities of and mJy at 250 and 350 GHz, respectively. The luminosity and implied dust mass are estimated111for a cosmology (, , ) adopted throughout this paper, the luminosity distance is . to be and (see Sect. 3). Under the assumption that the far-infrared luminosity arises exclusively from young stars, the implied star formation rate is a few . PSS 2322+1944 was also detected with the VLA at 1.4 GHz with a total flux density of being spatially extended on a scale of 1.5′′ (Carilli et al. 2001b). The ratio of radio to millimeter flux agrees with the radio-to-far infrared correlation for star-forming galaxies. PSS 2322+1944 is also an exceptional optical source as described by Djorgovski et al. (in prep.). From a Keck optical spectrum a redshift was derived from multiple, associated narrow absorption lines, yielding .
2 Observations and Results
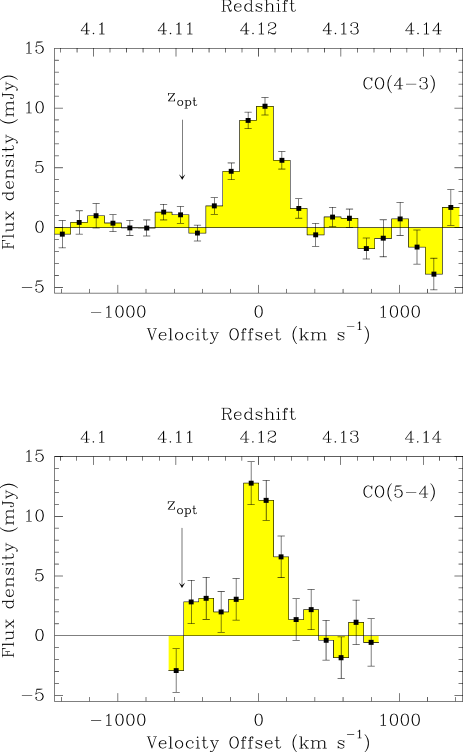
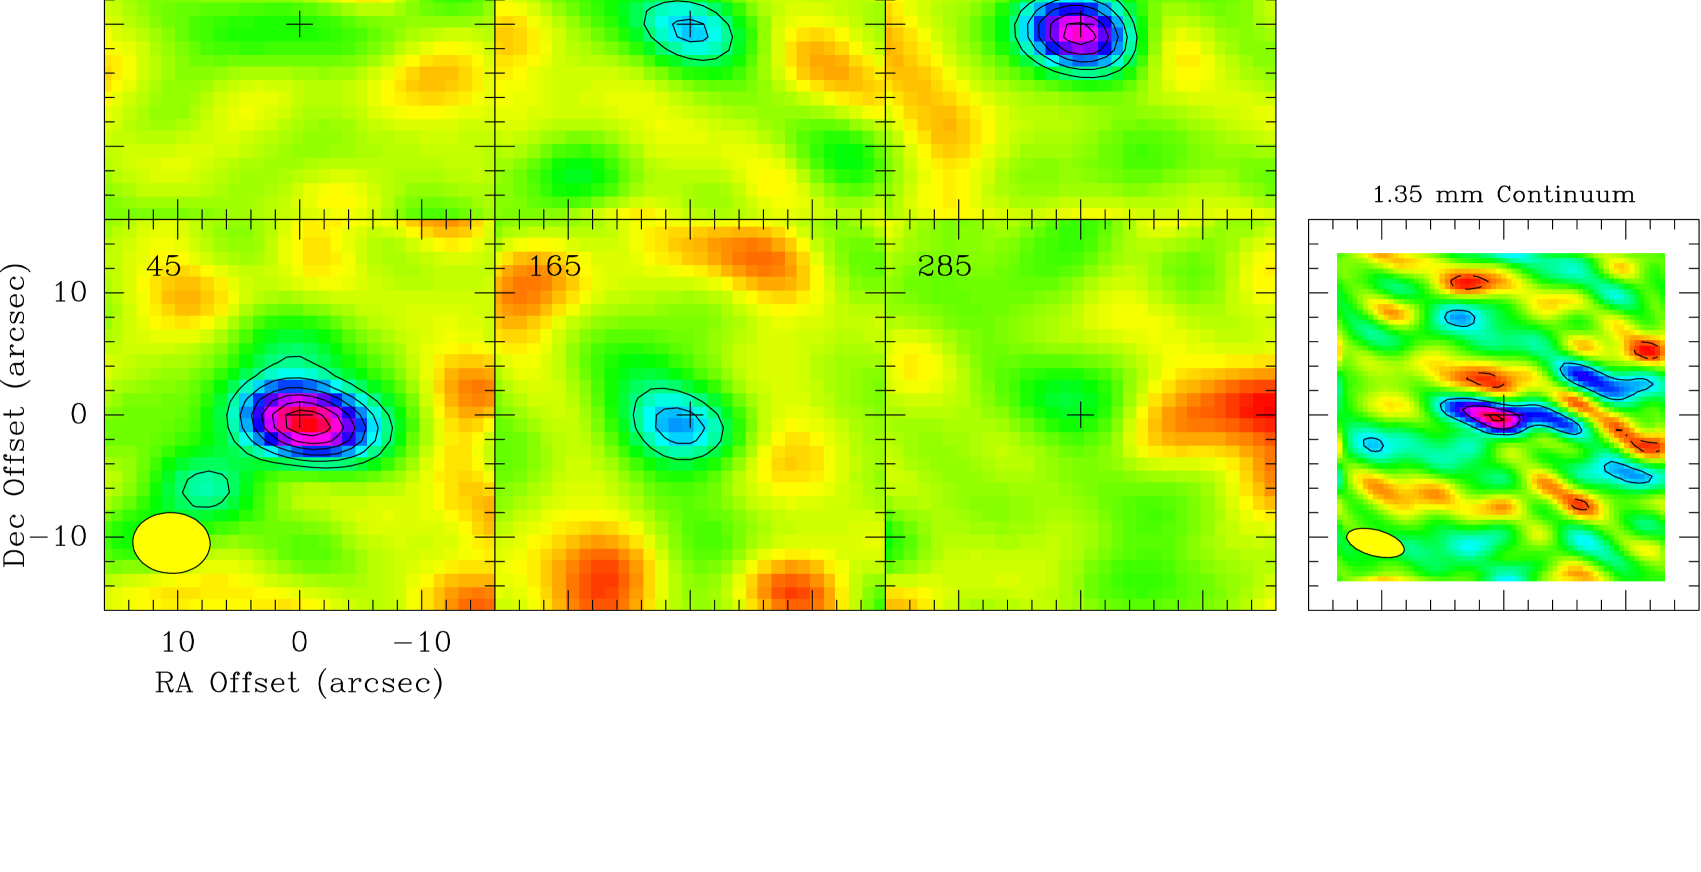
Observations were made with the IRAM Plateau de Bure interferometer during 5 nights in June 2001. We used the standard CD configuration (4 antennas) which results in a beam of at 1.3 mm and at 3.2 mm. Dual frequency receivers were used to search simultaneously for CO J=43 and dust emission at 3 and 1.35 mm, and in a second series of observations for CO J=54 and 109 emission. During the first observations, the receivers were tuned at 90.03 and 90.06 GHz to search for the J=43 emission line. A subsequent series of observations was done with the 3 mm receiver centered at 112.6 GHz (at the position of the redshifted CO J=54) and the 1.3 mm receiver tuned at 225.0 GHz to search for CO J=109. The 3 mm receivers were tuned in single sideband and the 1.3 mm receivers in double sideband. Typical SSB system temperatures were at 3 mm and at 1.3 mm. Amplitude and phase calibration were done using 3C 454.3 (6.1, 5.3 Jy) and 2230+114 (2.1, 1.2 Jy) where the number in round brackets are the flux densities at 3 and 1.3 mm, respectively, at the date of the observations. Phase noise was stable on all baselines both at 3 mm (rms 5o–17o) and at 1.3 mm (rms 13o–45o). During the observations, the water vapour varied between 3 and 6 mm and the seeing conditions varied between and , i.e. much smaller than the synthesized beams at 3 mm and 1 mm. The total integration time was about 18 hours for the CO J=43 line, and 12 hours for the CO J=54, the CO=109 and the 1.35 mm continuum. The data were reduced, calibrated and analyzed using the standard IRAM programs CLIC and MAPPING. The final spectra are shown in Fig. 1 and, for the CO J=43 emission, Fig. 2a also shows the velocity channel maps.
PSS 2322+1944 was detected in the continuum at 1.35 mm with a flux density of 7.51.3 mJy, as derived from the image sideband measurements. This value is consistent with the flux density measured at 1.20 mm with MAMBO at the 30-meter () when the spectral index of dust emission is taken into account. Within the astrometric uncertainties (), the continuum source corresponds is to the optical (and radio) position, RA 23:22:07.25, Dec 19:44:22.08 (J2000.0) from Carilli et al. (2001b). At the angular resolution of our observations, the source is not resolved (Fig. 2b). PSS 2322+1944 is not detected in the continuum at 3 mm with a flux density of as derived from the line-free channels. Using a dust spectral index of 3.5, this is consistent with the 3 mm continuum value of mJy expected from the 1.35 mm flux density (Fig. 3).
PSS 2322+1944 was also observed with the wide-band 450 and 850 filters on SCUBA at the JCMT in December 2001 under good and stable weather conditions with . The observations, calibration and data reduction were done as explained in Isaak et al. (2002). The source was detected in the continuum at 450 (corresponding to a rest wavelength of 88 ) with a flux density of 7519 mJy. At 850 , the flux density of PSS 2322+1944 is 242 mJy, which is entirely consistent with the 22.52.5 mJy value reported in Isaak et al. (2002). Fig. 3 presents the spectral energy distribution of PSS 2322+1944 with all the currently available photometric data.
Both the CO J=43 () and J=54 () are clearly detected toward the position of the continuum emission. The J=43 and 54 lines are found at frequencies of 90.05 and 112.55 GHz (Table 1) corresponding to a redshift of , close to the redshift derived from the optical spectrum (). The difference corresponds to a velocity difference of (Fig. 1). The CO J=109 emission line was not detected with a upper intensity limit of 30 mJy (Table 1). The integrated line fluxes of the CO J=43 and J=54 lines are and , respectively. PSS 2322+1944 is the strongest CO emitter at high , even stronger than the lensed quasar APM 08279+5255 (Downes et al. 1999) – see Table 2. From Gaussian fits, the line widths are found to be (Table 1) which is comparable to the width in the three CO sources detected so far (Table 2).
The channel maps in the CO J=43 emission line (Fig. 2a) (as well as the J=54 channel maps not shown) do not show evidence for extension and/or position shifts with velocity. The 3.2 mm CO data are limited by the angular resolution of the observations () and other array configurations will be needed to probe further whether the emission of PSS 2322+1944 is extended.
| Line | Peak Int. | Continuum | |||||
| [GHz] | [mJy] | [] | [Jy km s-1] | [mJy] | [] | [] | |
| CO(43) | 90.05 | 10.5 | 37541 | 4.210.40 | 0.400.25 | 2.0 | 6.3 |
| CO(54) | 112.55 | 12.0 | 27350 | 3.740.56 | – | 1.1 | 7.0 |
| CO(109) | 225.00 | – | 5.2 |
NOTE. – † Adopting a line width of
| Source | CO(43) | CO(54) | Ref. | |||
|---|---|---|---|---|---|---|
| [Jy km s-1] | [km s-1] | [Jy km s-1] | [km s-1] | |||
| PSS2322+1944 | 4.12 | 4.210.40 | 37541 | 3.740.56 | 27350 | [1] |
| BRI 13350415 | 4.41 | 2.800.30 | 42060 | [2] | ||
| BRI 09520115 | 4.43 | 0.910.11 | 23030 | [3] | ||
| BR 12020725 | 4.69 | 1.500.30 | 28030 | 2.400.30 | 32035 | [4,5] |
| APM 08279+5255 | 3.87 | 3.700.50 | 48035 | [6] | ||
| 4C 60.07 | 3.79 | 2.500.43 | [7] | |||
| 6C 1909+722 | 3.53 | 1.620.30 | 53070 | [7] | ||
NOTE. – [1] This paper [2] Guilloteau et al. (1997) [3] Guilloteau et al. (1999) [4] Ohta et al. 1996 [5] Omont et al. (1996b) [6] Downes et al. (1999) [7] Papadopoulos et al. (2000)
3 Discussion
The observed CO J=43 and 54 line fluxes imply intrinsic CO line luminosities, and , respectively, or expressed in solar luminosities, and (Table 1). is proportional to line brightness (Rayleigh-Jeans) temperature integrated over the area of the source: the ratio of luminosities in two CO transitions originating from the same area is a measure of the line brightness ratio and therefore an indicator of the physical conditions in the molecular gas (see Solomon et al. [1997] for a discussion of and ).
From the we derive brightness (Rayleigh-Jeans) temperature ratios [CO(43)]/[CO(54)] and [CO(109)]/[CO(54)]0.34. The former ratio is comparable to the values of 1.38 derived for the quasar H 1413 (the Cloverleaf) - see Barvainis et al. (1997) - and of 1.02 found for the quasar BR 12020725 (Omont et al. 1996a). These ratios indicate that the molecular gas in PSS 2322+1944 must be warm and dense. Using the results of a Large Velocity Gradient model for high galaxies (Sakamoto 1999), we used the brightness temperature ratios to constrain the molecular gas density in PSS 2322+1944. For a gas kinetic temperature of , in accordance with the temperature derived from the thermal dust emission spectrum (see below), and adopting a value of for the CO abundance per unit velocity gradient of the molecular gas (), the [CO(43)]/[CO(54)] ratio constrains the density of the molecular gas to be of the order of . These values for the gas temperature and density are also consistent with the line brightness ratio [CO(43)]/[CO(10)] derived from the CO(10) line flux measured with the VLA in PSS 2322+1044 (Carilli et al. [in prep.] - a more detailed analysis of the excitation conditions will be given in this paper). The gas density in PSS 2322+1944 is comparable to the high densities () found in the highly excited gas in the nuclear region of the starburst galaxy M 82 (Güsten et al. 1993; Mao et al. 2000) and in nearby ultraluminous infrared galaxies (e.g., Solomon et al. [1992]).
Assuming a standard Galactic value of for the conversion factor of molecular mass to , and using the above line brightness ratio [CO(43)]/[CO(10)], we infer a molecular gas mass of . Based on a study of ultraluminous infrared galaxies (ULIRGs), Solomon et al. (1997) showed that the molecular gas mass to CO luminosity conversion factor is likely to be lower (by a factor ) in the extreme environments of luminous infrared galaxies where the molecular clouds are expected to be hotter and denser than in the Galaxy (see also Combes et al. 1999). In the case of Arp 220, Scoville et al. (1997) derived a conversion factor times the Galactic value. The above gas mass is therefore likely to be overestimated by a factor 2 to 3. In the following we will adopt a conversion factor of (i.e., a factor of 2.5 times smaller than the Galactic conversion factor), which translates into a molecular gas mass of for PSS 2322+1944.
Compared with the dust mass derived from the 1.35 mm continuum flux density (see Omont et al. 2001), the implied gas to dust mass ratio for PSS 2322+1944 is , comparable to the ratios derived in bright nearby galaxies (Dunne et al. 2000), ULIRGs (Solomon et al. 1997), or other high redshift CO sources (Guilloteau et al. 1999). This similarity is also reflected in the ratios of these sources. In the case of PSS 2322+1944, , close to the median value of 160 found for a sample of 37 ULIRGs by Solomon et al. (1997).
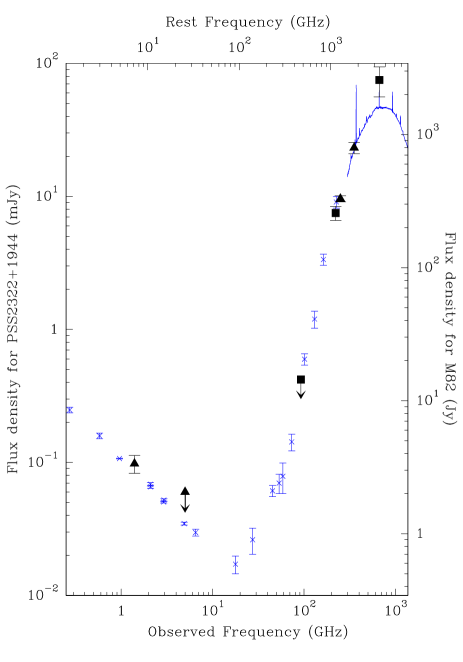
Figure 3 presents the radio to infrared flux densities of PSS 2322+1944 (including the new measurement at 450 and 1.35 mm) compared with the spectral energy distribution of M 82, which we red-shifted to and normalized to the flux density of PSS 2322+1944 at the observed wavelength of 850 . Note that M 82 is about 100 times less luminous than PSS 2322+1944. The two spectral energy distributions are remarkably similar in the far-infrared/radio, although the peak intensity of PSS 2322+1944 is somewhat higher. For a dust emissivity index , the dust emission is well fitted with a temperature of , which is similar to the dust temperature derived in M 82 under the same assumptions, i.e. . This further supports the idea that in PSS 2322+1944 the starburst dominates the dust heating and the radio emission (see also Omont et al. [2001] and Carilli et al. [2001b]). Further confirmation may come from a comparison of their mid- and near-infrared spectra. Similarities with the far-infrared and radio SED of M 82 were also noted for the QSOs BRI 1335–0417 at (Carilli et al. 1999) and BR 1202–0725 at (Kawabe et al. 1999; Yun et al. 2000).
Djorgovski et al. (in prep.) found that the quasar PSS 2322+1944 has a close companion (separated by about ) with the same spectrum within the measurement uncertainties. It is not yet known if this is a case of a gravitational lensing, or a binary quasar. In the former case, the luminosities and dust masses deduced here should be lowered by a factor of a few. In the latter case, we may be seeing an interaction or a merger of two quasar hosts.
4 Conclusions
With an apparent CO luminosity greater than that of the strongly lensed quasar APM 08279+5255, the quasar PSS 2322+1944 is the strongest CO emitter detected to date at redshifts larger than 3.5. Assuming no gravitational magnification, we estimate a molecular gas mass of , and a far-infrared luminosity of . The spectral energy distribution and large luminosity suggest that a massive starburst takes place in PSS 2322+1944, which may be related to the formation of the core of an elliptical galaxy.
The exceptional brightness of PSS 2322+1944 makes it a good target for further observations of other CO transitions, in particular those from lower levels which will constrain the physical conditions of the bulk of the molecular gas. Higher spatial resolution measurements are also needed to see whether the line or continuum emission is extended, as it was seen for the radio and optical emission (Carilli et al. 2001b; Djorgovski et al., in prep.).
The detection of CO in another strong (sub)millimeter continuum high- quasar confirms a frequent correlation between the 3 mm CO peak intensity and the 1.3 mm continuum flux, with a typical ratio of about unity. This relation shows that systematic searches for CO emission in strong thermal dust continuum quasars are promising with current instrumentation, provided that the redshift is known with high enough accuracy. Systematic (sub)millimeter continuum surveys of high redshift, radio-quiet quasars are therefore needed to find strong continuum sources towards which CO emission can be searched. Such studies promise to further our understanding of the physical and chemical properties of the most energetic sources in the early Universe. Interferometric observations, especially with ALMA and EVLA, will eventually be able to show the spatial distribution of the molecular gas and its relation to the stars and ionized gas.
Acknowledgements.
R. Neri and M. Grewing are gratefully acknowledged for their support of this program, and D. Downes for useful discussions. We also thank R. Lucas for help with the data reduction and the referee, A.S. Evans, for comments which improved the contents of this paper. The IRAM Plateau de Bure staff is kindly acknowledged for its efficient assistance. IRAM is supported by INSU/CNRS (France), MPG (Germany), and IGN (Spain). The JCMT is operated by JAC, Hilo, on behalf of the parent organisations of the Particle Physics and Astronomy Research Council in the UK, the National Research Council in Canada and the Scientific Research Organisation of the Netherlands. The National Radio Astronomy Observatory (NRAO) is a facility of the National Science Foundation, operated under cooperative agreement by Associated Universities, Inc. SGD and SMC acknowledge a partial support from the Bressler Foundation.References
- (1) Andreani, P., Cimatti, A., Loinard, L, & Röttgering, H.J.A. 2000, A&A, 354, L1
- (2) Barvainis, R., Maloney, P., Antonucci, R., & Alloin, D. 1997, ApJ, 484, 695
- (3) Barvainis, R., Alloin, D., & Bremer, M. 2002, A&A (letters), in press
- (4) Carilli, C.L., Menten, K.M., & Yun, M.S. 1999, ApJ, 521, L25
- (5) Carilli, C.L., Bertoldi, F., Menten, K.M., et al. 2001a, ApJ, 555, 625
- (6) Carilli, C.L., Bertoldi F., Omont, A. et al. 2001b, AJ, 122, 1679
- (7) Carilli, C.L., Kohno, K., Kawabe, K. et al. 2002, AJ, in press
- (8) Casoli, F., & Loinard, L. 2002, in ASP Conf. Ser. 235, Science with the Atacama Millimeter Array (ALMA), ed. A. Wootten (San Fransisco: ASP), 305
- (9) Colbert, J.W., Malkan, M.A., Clegg, P.E. et al. 1999, ApJ, 511, 721
- (10) Combes, F., Maoli, R., & Omont, A. 1999, A&A, 345, 369
- (11) Downes, D., Neri, R., Wiklind, T., Wilner, D.J., & Shaver, P.A. 1999, ApJ, 513, L1
- (12) Dunne, L., Eales, S., Edmunds, M. et al. 2000, MNRAS, 315, 115
- (13) Evans, A.S., Frayer, D.T., Surace, J.A., & Sanders, D.B. 2001, AJ, 121, 3286
- (14) Guilloteau, S., Omont, A., McMahon, R.G., Cox, P. & Petitjean, P. 1997, A&A, 328, L1
- (15) Guilloteau, S., Omont, A., Cox, P., McMahon, R.G., & Petitjean, P. 1999, A&A, 349, 363
- (16) Guilloteau, S. 2002, in ASP Conf. Ser. 235, Science with the Atacama Millimeter Array (ALMA), ed. A. Wootten (San Fransisco: ASP), 271
- (17) Güsten, R., Serabyn, E., Kaseman, C. et al. 1993, ApJ, 402, 537
- (18) Isaak, K.G., Priddey, R.S., McMahon, R.G. et al. 2002, MNRAS, 329, 149
- (19) Kawabe, R., Kohno, K., Ohta, K., & Carilli, C. 1999, in ASP Conf. Ser. 156, Highly Redshifted Radio Lines, ed. C.L. Carilli, S.J.E. Radford, K.M. Menten, & G.I. Langston (San Fransisco: ASP), 48
- (20) McMahon, R.G., Omont, A., Bergeron, J., Kreysa, E. & Haslam, C.G.T 1994, MNRAS, 267, L9
- (21) Ohta, K., Yamada, T., Nakanishi, K. et al. 1996, Nature, 382, 426
- (22) Omont, A., McMahon, R.G, Cox, P., et al. 1996a, A&A, 315, 1
- (23) Omont, A., Petitjean, P., Guilloteau, S. et al. 1996b, Nature, 382, 428
- (24) Omont, A., Cox, P., Bertoldi, F. et al. 2001, A&A, 374, 371
- (25) Mao, R.Q., Henkel, C., Schulz, A. et al. 2000, A&A, 358, 433
- (26) Papadopoulos, P.P., Röttgering, H.J.A., van der Werf, P.P. et al. 2000, ApJ, 528, 626
- (27) Papadopoulos, P.P., Ivison, R., Carilli, C.L., & Lewis, G. 2001, Nature, 409, 58
- (28) Sakamoto, S. 1999, ApJ, 523, 701
- (29) Solomon, P.M., Downes, D., & Radford, S.J.E. 1992, ApJ, 387, L55
- (30) Solomon, P.M., Downes, D., Radford, S.J.E., & Barrett, J.W. 1997, ApJ, 478, 14
- (31) Yun, M.S., Carilli, C.L., Kawabe, R. et al. 2000, ApJ, 528, 171