Design of UHECR telescope
with 1 arcmin resolution
and 50 degree field of view
Abstract
A new telescope design based on Baker-Nunn optics is proposed for observation of ultra high-energy cosmic rays (UHECRs). The optical system has an image resolution of smaller than 0.02∘ within a wide field of view of 50∘ angular diameter. When combined with a high-quality imaging device, the proposed design enables the directions of UHECRs and high-energy neutrinos to be determined with accuracy of better than 1 arcmin. The outstanding resolution of this telescope allows charge-separated cosmic-rays to be resolved and the source to be determined accurately. This marked improvement in angular resolution will allow the multi-wavelength and “multi-particle” observations of astronomical objects through collaboration with established astronomical observations.
keywords:
ultra high-energy cosmic ray; fluorescence detection; the Baker-Nunn optics; 1 arcmin angular resolution, wide field of view, and
1 Introduction
The observation of ultra high-energy cosmic rays (UHECRs) and high-energy neutrinos (HE-’s) with directional accuracy of arcmin (’) is expected to lead to revolutionary progress in particle astrophysics through “multi-particle” observations in cooperation with multi-wavelength astronomical observations. An excellent example is the recent prompt observation of X-rays from a gamma-ray burst (GRB) with directional precision of 1’ by Beppo-SAX, an event that marked the start of multi-wavelength observations using many advanced astronomical telescopes [1, 2, 3]. The directional accuracy of 1’ is several tens times better than that of currently operating, constructing, or planning UHECR detectors [4, 5, 6, 7] aim for.
Upon entering the atmosphere, UHECRs produce an air shower (AS) through interaction with air nuclei. The AS axis coincides with the UHECR incident angle, and the intrinsic angular resolution of the shower is 0.3’ or smaller for a UHECR of 1017 eV. This narrow dispersion results from the high Lorenz factor of secondary particles () in the direction of the parent particle, and the very low transverse momenta of secondary particles (rarely exceeding 1 GeV/c) as reported by the ATLAS group [8]. For UHECRs, more precise reconstruction of the primary direction can be expected due to the higher Lorenz factor.
ASs can be detected via the isotropic fluorescence emission of the air nitrogen that it excites. An optical system with imaging devices can be used to track the longitudinal development of an AS. This technique was first employed in the Fly’s Eye detector [9] and will be part of several future projects on UHECR detection. The key advantage of fluorescence detection is the capacity for achieving fine angular resolution. The signal to noise ratio () for each pixel of the imaging devices is inversely proportional to the square root of the angular diameter of the field of view (FOV). A better will allow the device to trigger charge levels, making it possible to analyze less energetic or more distant events.
Galactic and extragalactic magnetic fields are considered to have intensities on the order of G, nG, and below [10]. Thus, UHECRs are expected to experience only slight deflection due to galactic and extragalactic magnetic fields, and cannot be confined by the galactic magnetic field. The existence of an “ankle” at eV is often interpreted as a crossover from a steeper galactic component to a harder component of extragalactic origin.
As the possible sources of astrophysical accelerators capable of producing UHECRs are very limited, UHECRs that have been deflected only slightly can be traced back to their sources. Thus, high-resolution measurements of the arrival direction will lead to significant progress in cosmic-ray astronomy. The magnetic deflection of UHECRs during propagation induces charge separation. One of the important implications of 1’ angular resolution is that this separation of charge can be resolved, allowing unambiguous particle identification to be performed based on the deflection from sources. Such observations may also allow us to study the structure of extragalactic magnetic fields.
Based on the above considerations, we propose a telescope design that features a FOV of 50 ∘ 50 ∘ and 1’ resolution for the arrival direction. This is realized through a combination of a large-area image intensifier (II) connected to a CCD camera [11] and a customized Baker-Nunn optical system. In this paper, we describe the conceptual design of the modified Baker-Nunn optical system. The expected performance of the telescopes for UHECR detection is also presented assuming that the image resolution of the CCD camera is better than that of the optical system.
2 General Concept of Optical System
Our design requirements can be summarized as follows:
-
1.
a large FOV of 50∘ 50∘ to cover a large solid angle for UHECR detection;
-
2.
an image resolution of 0.02∘ to achieve 1’ resolution for the arrival direction;
-
3.
a large caliber with a diameter of 2000 mm to distinguish faint fluorescence.
In addition, cost performance will be a critical issue with respect to construction of a large-aperture array of telescopes.
Among several approaches to meet our requirements, spherical-mirror optics with an aperture diaphragm on the mirror’s curvature center appears to offer some advantages for the proposed telescope. This simple optics produces homogeneous images within the entire FOV. Typical off-axis aberrations, principally coma aberration, are eliminated, although spherical aberration is a factor. Thus, from a review of the variants of this optics, the Schmidt, Makstov, Baker Super-Schmidt, and Baker-Nunn optics were selected as candidates. The Schmidt optics has a one-element corrector lens at the diaphragm, and provides higher resolution than optics without the corrector lens. However, we found that it was difficult to achieve the required image resolution over the wide FOV. The Makstov and Baker Super-Schmidt optical systems require thick corrector lenses, and as such are not suited to large-scale telescopes.
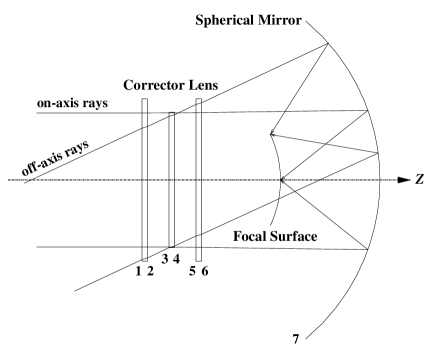
The Baker-Nunn optics has a three-element corrector lens consisting of convex and concave lenses with spherical or aspherical surfaces [12]. The basic premise of this optics is that each element has easy-to-make spherical surfaces, residual spherical aberration after assembly can be canceled by adjusting the spacing between lens elements, and chromatic aberration can be eliminated by selecting appropriate lens materials. Figure 1 shows a schematic of the Baker-Nunn optics. The second lens element is an aperture diaphragm.
Although the advantages of the Baker-Nunn optics are not related directly to the specific area of improvement pursued in the proposed design, the three-element corrector lens in this optics provides a large degree of freedom for optimization. As a result, it is considered the most suitable for our purposes. In our design, the first and third lens elements are 2400 mm in diameter, and the second element is 2000 mm in diameter, and all elements are 10 mm thick. Considering the cost, and complexity of fabrication processes, we designed the corrector lens as an acrylic Fresnel lens as appropriate for a large-aperture telescope. As described in the following section, the surface shape of each lens element was determined through an optimization process.
3 Optimization by Ray Tracing
3.1 Ray Tracing
We developed ray-tracing program written in C++ in order to optimize the optical system and examine its performance. The program models the refraction and reflection of incident rays on each surface, and allows a bundle of on- and off-axis rays to be traced numerically. As is common in designing an optical system, the shape of the front surface of each optical component is expressed as
| (1) |
where , , and represent the surface sag, radial height, and curvature of the surface. is positive in the direction of on-axis incident rays. , , and represent the 4th, 6th, and 8th order aspheric coefficients. The surfaces of each lens element and the mirror are numbered 1 to 7 as shown in Fig. 1.
The focal surface is defined as the surface minimizing the image spot for a bundle of parallel rays. The spot size is defined as the root mean square (RMS) of positions of parallel rays at the focal surface. The fineness of the bundle of rays analyzed is determined according to the purpose of ray tracing: a rather rough interval between rays is selected for optimization, and a fine interval is selected for performance evaluation. The spot size () is a function of the incident angle () and the wavelength () of parallel rays.
3.2 Optimization
We used the modified Powell’s method as the algorithm for optimization based on the following evaluation function:
where varies from 0∘ to 25∘, and varies from 330 to 410 nm, taking into account the air-fluorescence emission spectrum. We adopted the fourth power of spot size as the evaluation function in order to obtain flat resolution over the entire FOV.
In principle, the curvature, aspheric coefficients, thickness, and position of each lens element are free parameters in optimization. In order to reduce the number of free parameters, we imposed the symmetry described in Ref. [12] in which the corrector lens is symmetric with respect to the plane including the center of the second element and which is perpendicular to the axis of the ray. In addition, the thickness and position of each surface were fixed. These constraints allowed much more efficient optimization. The optimized parameters of the optical system are given in Table 1. The axis and origin of the coordinate are coincident with the axis of the rays and the center of the corrector lens. Note that we took the effect of the region obscured by the focal surface into account in the optimization.
| Surface | Z | Parameters | |
| 1: | R: | ||
| 2: | R: | ||
| A: | |||
| B: | |||
| 3: | R: | ||
| A: | |||
| B: | |||
| C: | |||
| 4: | R: | ||
| A: | |||
| B: | |||
| C: | |||
| 5: | R: | ||
| A: | |||
| B: | |||
| 6: | R: | ||
| 7: | R: | ||
| (unit: mm) | |||
Figure 2 shows the surface sag of lenses 2, and 3 as a function of radial height. The surface sag remained well below 0.5 mm when the width of Fresnel grooves was chosen to be 10 mm. Thus, the 10-mm thickness of each lens element is sufficient, although the thickness may be changed according to the support method employed for the corrector lens. We confirmed that the same level of spot-size resolution can be obtained by another optimization using a different lens thickness.

Figure 3 shows the spot diagrams of the optimized optical system. The shape and size of spot diagrams changed with the wavelength and the incident angle of the incoming rays. The four strongest fluorescence peaks, 336, 358, 391, and 425 nm, which dominate the filtered fluorescence spectrum after propagation through air, were selected as wavelengths for the diagrams. The spot diagrams for incident angles of 5∘, 15∘, and 25∘ are shown.

Figure 4 shows the spot size distribution as a function of incident angle, taking the characteristic wavelengths in the fluorescence spectrum into account. Solid and dashed curves represent the spot size optimized to cover a FOV of 25∘ and 20∘, respectively. The lens parameters shown in Table 1 are the result of the former optimization, and give a spot size of smaller than 0.02∘ over a FOV of 25∘. The results were confirmed by cross checks using Mathematica Optica [13] with correction for the refractive index of the atmosphere.

In parallel with the development of this optical system, the present authors have also developed a high-density CCD imaging detector with integrated large-area image intensifier, which has been demonstrated to have a resolution of 0.02∘ [11]. This imaging system is mounted at the focal surface of the optimized optics to give the proposed telescope design.
4 Performance
A solid angle of nearly 2 sr can be observed using an array of 8 telescopes (i.e., a station), with 7 telescopes arranged azimuthally and 1 telescope directed upward. It should be noted that the telescope directed upward is primarily important in HE- detection rather than UHECR detection [14].
A Monte Carlo simulation was performed to examine the resolution obtained for the arrival direction of UHECRs. The event generator calculated the signal strength produced by atmospheric fluorescence emission from ASs with a given geometry, and built simulation events by calculating the number of photoelectrons detected by each pixel of a CCD camera at each mirror. The simulation includes the longitudinal and lateral profiles of the AS, the model of the atmosphere, the air fluorescence yield, and the detector optics. We also took into account fluctuation of the first interaction depth, impact point, and directional angles of shower cores assuming appropriate distributions.
Current and planned fluorescence detectors [5, 7] have a pixel resolution of 1∘. The angular resolution of the reconstructed track was evaluated by analyzing event samples that triggered the current 1∘-pixel detectors. Such signals are triggered by having at least 6 pixels ( resolution) fire at 4 greater than the night sky background, with a corresponding reconstructed track extending more than 5∘ in the FOV [5, 7]. A night sky background level of 100 photoelectrons/s/() was assumed. Figure 5 shows the comparison of event displays between the 0.02∘ and 1∘ systems.
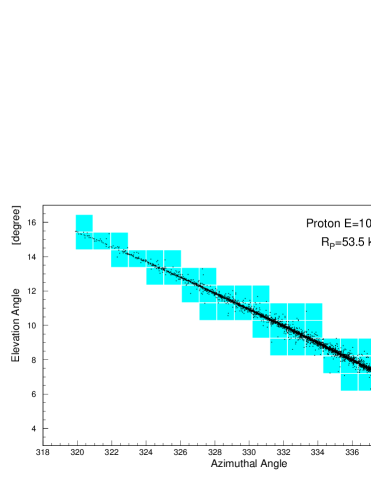
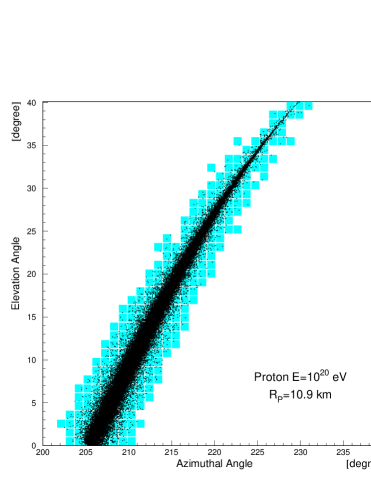
Applying a stereo reconstruction of the AS, the arrival direction is determined by the geometrical intersection of shower-detector planes (SDPs). Since the resolution of the normal vector of a SDP is the primary factor affecting the resolution of arrival direction, we discuss here for simplicity the accuracy of SDP measurement. The angular resolution of SDP is plotted in Fig. 6 for 1019 and 1020 eV protons. The angular resolution is determined from the integral of the distribution encompassing 68 % of events. Figure 7 shows the variation in the angular resolution of the SDP with proton energy. Resolution of 1’ is obtained at above 1018 eV for the SDP. In the case of stereo reconstruction with two or more stations, the pointing resolution is also expected to be 1’ after reconstruction of the geometrical intersection of SDPs.

The of each pixel is proportional to [9], where represents the light collection area, corresponding to the reflection area for simple mirror optics and the area of the aperture diaphragm for the Baker-Nunn optics, and denotes the angular size of each pixel. Note that this proportionality holds only when the effects of lateral distribution are neglected. Assuming the same size of , the value for the 0.02∘-pixel imaging device is expected to be about 7 times higher than that from the 1∘-pixel one. However, this is expected to be affected by the quantized number of photoelectrons at these small dimensions. To examine this, the AS profile was simulated by the Monte Calro method and the quantitative improvement in the was examined for the 0.02∘ pixels. The AS events of protons with energy of 1020 eV were generated isotropically for a given impact parameter (). The maximum value of (obtained event-by-event) was averaged for a given , and the maximum values are shown in Fig. 8. Note that the event selection applied here differs from that applied to compare the angular resolution as it is not necessary to apply the 6 pixel condition to compare the of the - and 0.02∘-pixel detectors for distant ASs. The solid curve shows the expected value for 1∘ pixels calculated from that of 0.02∘ pixels by the theoretical proportionality. The expected and obtained values are in good agreement for the distant events ( 70 km). For the closer events, the lateral distribution of the shower-core image becomes significant compared with that for the 1∘ pixel image (see the bottom panel of Fig. 5). As a result, the expected ratio is appreciably lower than the simulation result.

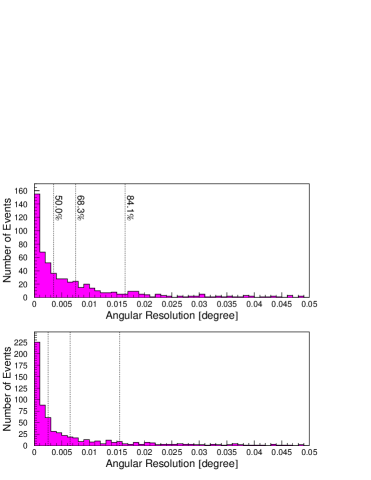
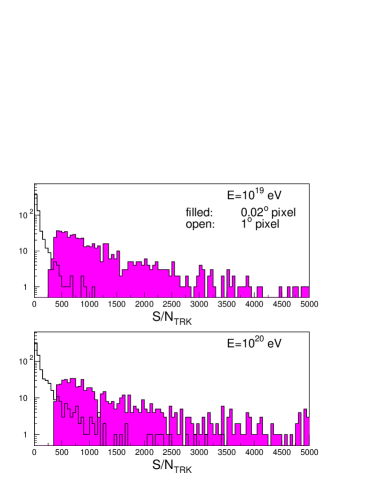
We also define another signal to noise ratio () appropriate for the track captured by the imaging devices. The signal () is the sum of charges detected by all pixels associated with the track. The background () is the sum of background for all pixels associated with the track. Then, is defined as . Figure 9 shows the distributions of for protons of 1019 and 1020 eV. The 0.02∘ device exhibited excellent values. The significant improvement in was obtained because the lateral extent of the AS is smaller than the pixel resolution of 1∘. Thus, we have demonstrated the improved resolution of the arrival direction offered by the proposed system. The detailed performance of the detector, including aperture, energy resolution, and shower-max resolution, will be discussed elsewhere.
5 Conclusion
We have presented the conceptual design of a new type of telescope for UHECR detection based on the Baker-Nunn optical system. The telescope has a spot size resolution of smaller than 0.02∘ within the entire FOV of 50∘, and has been shown to be capable of 1’ angular resolution for the arrival direction of UHECRs. This design has the potential to open new possibilities in the field of UHECR and HE- physics through high-resolution observation.
References
- [1] E. Costa et al., Nature 387, 783 (1997).
- [2] A. Yoshida et al., Publ. Astron. Soc. Jpn. 41, 509 (1989).
- [3] J.v.Paradijs et al., Nature 386, 686 (1997).
- [4] M. Takeda et al., Phys. Rev. Lett. 81, 1163 (1998).
- [5] The High-Resolution Fly’s Eye Experiment: http://hires.physics.utah.edu/; T. Abu-Zayyad et al., Astrophys. J. 557, 686 (2001).
- [6] The Pierre Auger Project: Design Report, 2nd ed. March 1997, http://www.auger.org/.
- [7] The Telescope Array Project: Design Report, July 2000, http://www-ta.icrr.u-tokyo.ac.jp; M. Sasaki, Proc. of the EHECR2001, ICRR-Report-481-2001-11 (2001).
- [8] ATLAS Collaboration, ATLAS TDR 15, CERN/LHCC 99-15 (1999).
- [9] R.M. Baltrusaitis et al., Nucl. Instr. Meth. A 240, 410 (1985).
- [10] P.P. Kronberg, Rep. Prog. Phys., 325 (1994); P.P. Kronberg, Nature 370, 179 (1994).
- [11] M. Sasaki et al., ICRR-Report-485-2002-3 (2002).
- [12] J. Baker, “Correcting Optical System,” U.S. Patent 3,711,184, 1962.
- [13] Mathematica Optica version 1.2.
- [14] M. Sasaki and M. Jobashi, ICRR-Report-484-2002-2 (2002).