Observation of X–ray variability
in the BL Lac object 1ES195965
Abstract
This paper reports X–ray spectral observations of a relatively nearby () BL Lacertae (BL Lac) object 1ES195965, which is a potential TeV emitter. The observations include 31 short pointings made by the Unconventional Stellar Aspect (USA) Experiment on board the Advanced Research and Global Observation Satellite (ARGOS), and 17 pointings by the PCA on board the Rossi X–ray Timing Explorer (RXTE). Most of these observations were spaced by less than 1 day. 1ES195965 was detected by the ARGOS USA detector in the range 1-16 keV, and by the PCA in the 2-16 keV range but at different times. During the closely spaced RXTE observations beginning on 2000 July 28 , an ending of one flare and a start of another are visible, associated with spectral changes, where the photon index ranges between 1.4 and 1.7, and the spectrum is harder when the source is brighter. This implies that 1ES195965 is an XBL-type blazar, with the X–ray emission likely to originate via the synchrotron process. The USA observations reveal another flare that peaked on 2000 November 14 and doubled the flux within a few days, again associated with spectral changes of the same form. The spectral variability correlated with the flux and timing characteristics of this object that are similar to those of other nearby BL Lacs, and suggest relativistic beaming with a Doppler factor and magnetic fields of the order of a few mG. We also suggest that the steady component of the X–ray emission – present in this object as well as in other XBLs – may be due to the large-scale relativistic jet (such as measured by Chandra in many radio-loud AGN), but pointing very closely to our line of sight.
1 Introduction
Over a dozen BL Lacs have been detected at GeV energies (Mukherjee et al., 1997), but only a few nearby BL Lacs have been identified at TeV energies so far. Mkn 421 () (Punch et al., 1992) and Mkn501 () (Quinn et al., 1996) are now strongly confirmed sources, seen by more than one ground-based atmospheric Čerenkov telescope (ACT) at or above the level. Two more, 1ES 2344+514 (z=) (Catanese et al., 1998) and PKS 2155-304 () (Chadwick et al., 1999), have been detected only once and are less conclusive. This strongly suggests that low-redshift X–ray selected BL Lac objects (XBLs) such as these may be the only extragalactic -ray sources observable at TeV energies. This is because on the one hand more distant objects would have their TeV emission strongly absorbed by the extragalactic background light (EBL), and on the other bright X–ray emission, presumably originating from synchrotron radiation and thus revealing the distribution of radiating particles, implies even higher intrinsic GeV-TeV emission (see, e.g. Tavecchio, Maraschi & Ghisellini (1998)).
The BL Lac object 1ES195965 (), is an XBL also present in the third EGRET catalog with an average measured flux of photons for MeV (Hartman et al., 1999). It is thus a natural source for TeV emission, and Stecker, De Jager & Salamon (1996), using simple scaling arguments, have predicted for it the third highest flux above 0.3 and 1 TeV, after Mkn 421 and Mkn 501. More recently, Costamante & Ghisellini (2001) have also pointed it out as a candidate TeV emitter. Quoting Weekes (1999), the Utah Seven Telescope Array has reported the detection of 1ES195965 based on 57 hours of observation in 1998 (Kajino et al., 1999), with an energy threshold of 600 GeV. The flux level was not reported but the total signal was at the 3.9 level. This is not normally considered sufficient to claim the detection of a new source; however, within this database there were two epochs which were selected a posteriori which gave signals above the canonical level. This source has not yet been confirmed by any other group; it was observed by the Whipple group but no flux was detected (Catanese et al., 1997). Of particular interest in this source is also the fact that its distance is of the same order as the two other confirmed TeV sources, making it a good candidate to probe the EBL that can in turn probe cosmological problems such as the formation of galaxies (see e.g. Primack et al. (1999); Guy et al. (2000)). 1ES195965 is also part of a 200 mJy radio-selected sample at 5 GHz (Marcha et al., 1996; Bondi et al., 2001) and it was seen in the Einstein Slew Survey (Perlman et al., 1996). Multiple photometric optical values were found in the literature, showing a great variation of the source brightness in the optical band from to . A complete study of the optical band can be found in Villata et al. (2000) where variability on short timescales (a few days) was reported.
The capabilities of the USA and the PCA instruments to monitor the X–ray emission are particularly well suited for the detailed study of the X–ray energy spectrum of 1ES195965, and its temporal evolution. Here, we present 31 USA and 17 PCA observations of 1ES195965. The PCA data are two sets of intraday observations, obtained from unpublished RXTE archival data, that span a few days in which the end of a flare and beginning of another flare are detected. The USA observations are short daily monitoring observations that span 7 weeks, ending with a strong flare, where the X–ray flux tripled in 7 days (the USA data were taken in the context of a multi-wavelength campaign that was not successful in the TeV range due to bad weather at the ACT site). In Section 2, we report the details of the observations; in Section 3, we report the main features of the data; in Section 4, we discuss the implications of the X–ray spectral variability and the quiescent X–ray emission detected in 1ES195965; we present our conclusions in Section 5.
2 Observations and Data Analysis
2.1 USA Data
The USA Experiment observed 1ES195965 about once per day between 2000 September 21 (MJD 51808) and November 11 (MJD 51859). (For a detailed description of the USA experiment see Ray et al. (1999), Wood et al. (2000) and Shabad (2000).) The USA detector was used in the “ping” mode where within one observation the source is pointed at 2 or 3 times for seconds and then a background is taken for seconds, where typically, = = 60 seconds and an observation lasted for 300 s (for more details on the “ping” observation mode see Giebels et al. (2000)). This type of observation has the advantage of not relying on a background model but rather on a direct measurement of the background, but results in some loss of signal within an observation period. USA data were extracted from FITS formatted files using CFITSIO. Care was taken to use an position as devoid as possible of bright X–ray sources, and at least 2∘ away from the source. Observations were made in low background regions of the orbit, where the counting rate was approximately 30 cts/s or 1% of the Crab level in the same conditions. The segments of the observation where the background is too high, especially at the beginning and the ending of each observation, are rejected. For the present investigation, we use only observations where at least 2 pairs of ON - OFF pointings are available for each observation. Within those restrictions, 31 observations were used from which ks of data were selected.
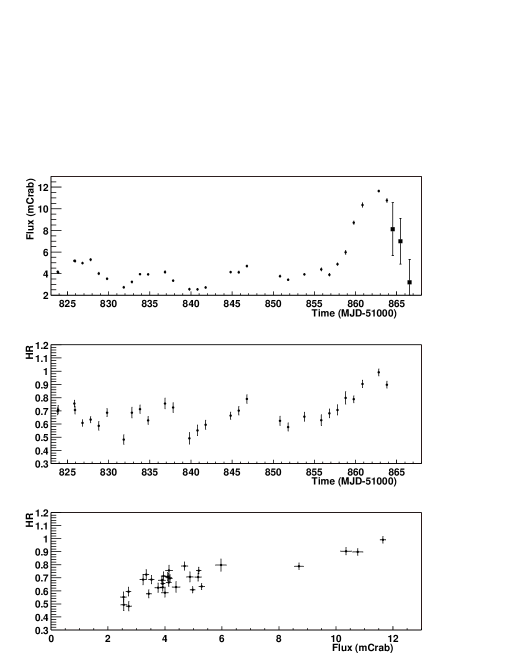
We present the X–ray lightcurve for 1ES195965 in Figure 1; in that Figure, the standard deviation of the average in the background was added in quadrature to the error on the count rate for each observation. The data were then corrected for obscuration by the instrument support structure when necessary, and also for the collimator response. Every point in the lightcurve is a single observation. The lightcurve (normalized to the USA Crab rate in the energy range defined below, or 3500 cts/s) for the total range is shown in the top panel of Figure 1.
The data were taken in the spectral mode, where the instrument integrates a spectrum covering an energy range of approximately 1–17 keV in 48 pulse height analyzer (PHA) channels every 10 ms. In this work, we make no use of the lowest (0) and the highest (47) PHA channels; the PHA channels 1–46 ( keV) are referred to as the total USA range. The spectral characteristics of the time series were studied by dividing the USA data into two energy bands, the PHA channels 1–10 (soft band) and 11–46 (hard band), corresponding to approximately 1–3 keV and 3–16 keV, respectively. A hardness ratio, shown in the second from top panel in Figure 1, is the ratio of the counting rate in the hard band over the soft band. The dates are given in Modified Julian Date (MJD) 51000.
2.2 RXTE/PCA Data
Unpublished PCA data of 1ES195965 were obtained from the RXTE data archive. The RXTE/PCA observed 1ES195965 12 times from 2000 July 28 through August 2, and 5 times between 2000 September 1–6, with exposures of 900 s in the July-August observations and a few ksec each in September. The STANDARD2 data were extracted using the HEASARC ftools and filtered using the RXTE GOF-recommended criteria (layer 1 only, for better signal to noise, PHA channels 0 to 27 (lightcurves only) or approximately 1-10 keV, Earth elevation angle greater than 10 degrees, pointing offset less than 0.02 degrees, time since the peak of the last SAA passage greater than 30 minutes and electron contamination less than 0.1). The lightcurve and spectral data are from unit 2 (PCU 2) only since a faint background model is not yet available for unit 0 during gain epoch 5. The background models of Epoch 4 were used. Lightcurves were extracted using the ftools saextrct (through the rex script) and lcurve. The variable PCA background was modeled with pcabackest, which uses observations of X–ray blank, high latitude areas of the sky (Jahoda et al., 1996). Spectral fits were done using XSPEC v. 11.0.1 and response matrices generated by the ftool pcarmf.
The source was not detected with a better significance than with the RXTE/HEXTE instruments. A likely explanation is the steep spectrum, derived from the PCA data, that falls below the HEXTE sensitivity.
2.3 Archival Data
An observation with the BeppoSAX instrument in 1997 (Beckmann, 2000; Beckmann & Wolter, 2001) resulted in a measured flux of erg cm-2 s-1 in the 2–10 keV band and a spectral index of . This flux is an order of magnitude fainter than the brightest flux measured here by the PCA. However, the results published by (Beckmann, 2000) should be treated with caution, as there is an apparent error in the value of the Galactic column adopted by them (they adopt rather than atoms cm adopted by us on the basis of the COLDEN program available as a part of the Chandra Proposal Planning Toolkit, based on relatively reliable 21 cm data). The analysis of the PSPC All-Sky Survey data by those authors implies that assuming a simple power law, the fitted absorption is atoms cm, somewhat larger than the Galactic value. However, this might be because the intrinsic X-ray spectrum steepens somewhat towards higher energies, as is often the case for other XBL-type blazars, and an assumption that the observed spectrum is a simple absorbed power law overestimates the fitted absorption. Note that the higher column density makes no difference in the results from the USA or RXTE data. The Einstein Slew Survey Sample of BL Lac Objects (Perlman et al., 1996) quotes a flux of 3.65 Jy at 2 keV, which is 40% brighter than the BeppoSAX measurement.
We also extracted the ROSAT HRI archival data for this source, and used the ROSAT all-sky data. ROSAT HRI observed it on 1996 April 1; the observation lasted for a total of half a day, yielding about 2800 sec of good data. The data were reduced in a standard manner, revealing that the net source counting rate was 1.57 ct s-1, with no indication of variability, but this is not too surprising given the short observation length. The conversion of the HRI count rate to flux is dependent on the source spectrum, which has to be assumed as there is essentially no spectral information in the HRI data. Since we do not know the soft X-ray spectrum at the epoch of the HRI observation, we assume the energy index , but two different values of , the Galactic value of cm-2 and the fitted ROSAT value of cm-2. To obtain the conversion from the HRI counting rate to the observed flux, we used the PIMMS tool provided by HEASARC (and checked the results using XSPEC with the HRI effective area curve). Assuming the Galactic column of cm-2, we obtain the 0.1 - 2.4 keV flux of erg cm-2 s-1 and 1 - 2 keV flux of erg cm-2 s-1. Assuming the fitted ROSAT value of cm-2, we infer the 0.1 - 2.4 keV flux of erg cm-2 s-1 and 1 - 2 keV flux of erg cm-2 s-1. In any case, this corresponds to (roughly) 2 mCrab, which is lower than the 13 mCrab level from the Rosat all-sky Survey Bright Source Catalog (1RXS-B). This simply implies that during the ROSAT survey, 1ES195965 was significantly brighter than during the Einstein, ROSAT HRI or BeppoSAX observations, and the episodes of high flux as seen by the USA or RXTE observations described hereafter are not unique.
3 Observational Results
3.1 Flares in the USA and RXTE Data
The USA and RXTE observations of 1ES195965 conducted from July through November 2000 show that the source was bright and variable in the X–ray band, with the X–ray spectrum significantly harder than observed during the periods of lower brightness. Specifically, these data show that during the last quarter of 2000, 1ES195965 underwent an X–ray flare reaching the 12 mCrab level in the 1-16 keV band on November 14 (MJD 51863). Variability of a factor 6 was detected within 20 days, and a factor 3 within 7 days (Figure 1). By comparison, the peak flux detected by USA on Mkn 421 in 2000 reached approximately 40 mCrab at maximum. Visual inspection of the USA (as well as the RXTE) lightcurves, and in particular of the largest flare, indicates that the source does not appear to vary significantly on timescales shorter than a day; thus the variability is not undersampled. These observations show that 1ES195965 was in a variable state for at least 4 months. To complete the coverage of this flare, 3 data points from the RXTE/ASM were normalized to the Crab and added to the lightcurve in Figure 1; this shows the flare continuing to decrease. The varying spectral index and differences in the energy response of both instruments complicate the comparison. Nonetheless, the full-width at half-maximum region of the flare with these additional points spans 5 1 day, and the doubling time is 2.5 days.
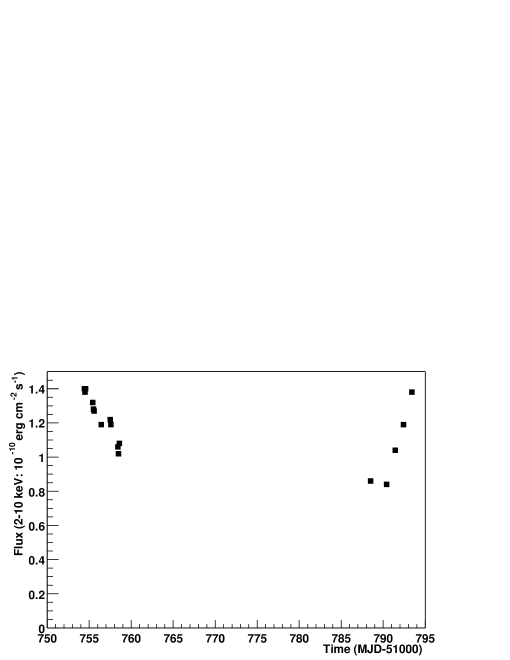
The PCA archival data obtained 2 months prior to the USA observations show 65% flux changes in 3.5 days; the highest observed value was (2-10 keV) = erg cm-2 s-1, but the peak value is unknown, since the observed maxima are at the endpoints of the observed period, when the source was falling or rising as shown in Figure 2. The USA lightcurve shows that the PCA did not cover the typical variation period which appears to be 4 days. The same figure shows a decreasing flux extending over 3.5 days, and after 30 days observations resume for 4 days where a steady increase of flux is seen. The flux did not change more than a few percent on timescales shorter than a day in the PCA data. In the three panels in Figure 3 it is apparent that variations are larger in the harder bands in the decreasing part of the PCA observations.
3.2 Flux-Spectrum Correlations
The PCA data were used to perform spectral fits as a function of the flux in the 2-10 keV energy range. The data were fit to a single power-law function with index , such that the photon flux and the absorbing column =10.27 cm-2.
The absorbed power law model provides an adequate fit for all RXTE PCA pointings. Spectral indices were obtained for every observation, and in some cases, intraday observations where the estimated indices and fluxes were similar were added together to improve the significance on a daily timescale. The spectral fits are shown in Table 2 along with the month, day and fraction of the day of the beginning of each observation.
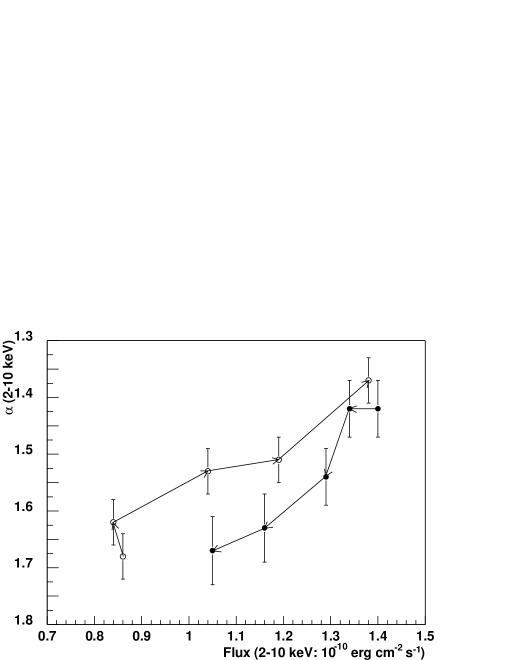
The X–ray spectrum follows a “loop” in the spectral index-flux plane, as seen in Figure 4, and it is not surprising that the X–ray spectrum shows significant evolution during the flare given that there is a more rapid rise and drop in the hard X–ray band (see §4 for discussion). The steepest spectrum in the PCA data was observed at the first observations in the declining phase July 28 (), and the hardest spectrum was seen on 2 dates separated by a month and at a similar flux () which is a hint that the same physical mechanism is generating these flux variations. In the case of the USA observation, poorer photon statistics and an incomplete energy calibration limited the spectral study to a hardness ratio (HR) estimation plotted on the same Figure 1. The USA fluxes and HR are shown in table 1. During the strongest flare, that started around (MJD-51000)=857, a variation in the HR is observed.
4 Discussion
4.1 Doppler Boosting of the Flux of 1ES195965
The electromagnetic emission in blazars is very likely to be Doppler-boosted (or beamed) towards the observer. In the radio regime, the evidence comes from superluminal expansions observed with VLBI. Similar superluminal expansions have now been seen in the optical band with the HST in nearby galaxies such as M87. Relativistic beaming is also required in order to avoid absorption of GeV photons by X–ray photons via the e+/e- pair-production process. It is thus possible to use the X–ray variability data as well as the fact that 1ES195965 is an EGRET-detected BL Lac object, to establish a limit for the Doppler factor , with defined in the standard way as , where is the bulk Lorentz factor of the plasma in the jet, and is the angle to the line of sight.
Assuming that the -rays and X–rays from 1ES195965 are produced in the same region, it is possible to calculate the opacity for pair production from the source sizes inferred from the USA and RXTE/PCA data. The formula given by equation (3) in Mattox et al. (1993) for the optical depth for an outflow which is nonrelativistic in its comoving frame, as corrected by Madejski et al. (1996), is
where is the doubling time in units of s and the reduced Hubble constant in units of 60 km s-1 Mpc-1.
Using the parameters found in 1ES195965 (, , and Jy), the opacity for 1 GeV photons would be , and is required in order to have . The limit on the required Doppler factor is less than that required for Mkn 421 (), which is not surprising since timescales of days and a slightly higher luminosity are involved in that object.
Strictly speaking, the above argument for anisotropy only applies if the -ray emitting zone is the same as the soft X–ray-emitting region and, for now, we have no clear observational indications that this is the case. This is important, since the jets are likely to be inhomogeneous. However, since -ray variability on timescales shorter than a day has been measured – and since there is an obvious correlation between X–rays and -rays that has been seen in objects such as Mkn 421 and Mkn 501 – for such sources a few can be deduced as well. Relativistic source motion, however, does not avoid the problem of the gamma-ray pair production on the external, unbeamed photons likely to be present in the environments currently envisioned for the central engines of such sources.
The X–ray data presented above imply that the X–ray spectrum of 1ES195965 hardens as the source brightens. This is often measured in BL Lac objects; a hardening of the spectrum when flares occur, and a blueward shift of the peak of the synchrotron emission (and presumably higher energy inverse-Compton emission) by factors that can be as large as 100 was measured in the cases of Mkn 501 (Pian et al., 1998), 1ES 1426428 and PKS 0548322 (Costamante et al., 2001). In the case of PKS 2005-489 (Perlman et al., 1999), a more moderate shift of a factor of 3 or less of the synchrotron emission was found.
4.2 Synchrotron Models and Inferred Parameters
The spectral change is best illustrated as a correlation between flux and the photon index. Using PCA data this correlation is illustrated in Figure 4. Even though the two observations were separated by a month and are certainly related to two different flares, it is still interesting to compare this spectral evolution since the time series have similar rise and fall timescales, which are also comparable to what is seen in the USA detector. It is thus likely that the two flares originate from a similar mechanism and that the correlation plot has some validity. The “clockwise motion” (shown with arrows) observed in the data for 1ES195965 has also been seen in flares in Mkn 421 (Takahashi et al., 2000, 1996), in PKS 2155304 (Sembay et al., 1993) and in H0323022 (Kohmura et al., 1994), although in some cases counterclockwise patterns have also been seen (Mkn 501, Catanese & Sambruna (2000)). The spectrum steepens more rapidly than the flux in the declining phase and hardens rapidly in the brightening phase, indicating that the variations of the hard X–rays occur faster than those in the soft X–rays both during the increase and the decrease of the brightness of the source. The spectral index change of seen here is comparable to the seen in Mkn 421. The variation observed in the flux-index plane can provide information about the acceleration process (Kirk & Mastichiadis, 1999). Counter-clockwise patterns are expected when acceleration, variability and cooling timescales are similar in a flare. In this case the acceleration process proceeds from low energy to high energy changing the number of particles and making the softer energies vary first. Clockwise patterns, where the harder energies vary first, can be explained in flares where the variability and acceleration timescales are much less than the cooling timescale.
For a homogeneous emitting region, the radiative lifetime of a relativistic electron emitting synchrotron photons with energy is (in the observer’s frame) s (Rybicki & Lightman, 1979). This should give some estimate of the magnetic field , even though the extent to which the timescale of the flux decrease was due to the propagation of the signal throughout the source and to what extent it was caused by the synchrotron cooling is not known. However, it is possible to measure the relative decrease of the flux in three energy bands in a time using the PCA data as seen in Figure 3. To estimate the timescale for a drop by a factor of two in each energy band, the measured timescale is divided by a factor . The factor is smallest for the lowest energy band (24%) as expected. It is now possible to find 7.7, 4.9 and s, respectively, for 3, 7 and 12 keV photons. According to Takahashi et al. (1996) we write . Comparing the decline of the flux of 3 keV and 12 keV photons yield G, while the decay of the 7 keV and 12 keV photons yield a similar result of G. Using we infer G. It is interesting to note here that this is a similar value to that found by Perlman et al. (1999) (P99 hereafter) in an outburst of PKS 2005489 where variability on timescales of days was observed.
The peak observed frequency of the synchrotron emission of an electron with is given by Hz. Using the magnetic field inferred above, the Lorentz factors of the electrons radiating at energy can be estimated from keV. This implies that of electrons 111Note that refers to the Lorentz factors of individual radiating particles as distinct from the jet bulk Lorentz factor radiating in the X–ray band is .
The value of calculated as above is significantly lower than 0.2 G, and higher than inferred for Mkn 421 by Takahashi et al. (1996), but the values inferred by us are similar to those quoted for PKS 2005489 by P99 where a possible undersampling was invoked to explain the possibility of faster (shorter than 1 day) variability, which in turn would make the inferred value for a lower limit and an upper limit. We believe that in 1ES195965 the flux is sampled relatively densely, and thus the variability is unlikely to be undersampled. This means that the difference in the inferred values of and in 1ES195965 as compared to Mkn 421 is unlikely to be a result of the source being more compact, while this could be the case for the potentially undersampled data for PKS 2005489 (P99). With our inferred source parameters being so close to the values found for PKS 2005489, it is now quite possible that real differences between these two sources and Mkn 421 exist. A conclusive test of the physical parameters in this source would be a clear detection of the TeV -ray emission, and any correlation with the X–ray flux. Also, longer, more sensitive and well-sampled observations in the X–ray band are needed to either confirm or disprove that the variability pattern of 1ES195965 and its spectral properties are as described here. A noticeable difference between PKS 2005489 and 1ES195965 is that whereas in the latter a variation in the spectral index was associated with a flux change of a factor of 30, in the former a produced only a 65% change in the flux. Also note in the USA data, a doubling of the hardness ratio is accompanied by a factor of 6 increase in flux.
4.3 Continuous Emission: Knot Radiation?
The USA lightcurve exhibits a non-zero X–ray flux outside of the flaring events of a few 10-11 erg cm-2 s-1 (or a few mCrab, taking 1 Crab 1.710-8 erg cm-2 s-1 in the 2–10 keV band). The existence of a steady underlying emission in at least one other BL Lac object, Mkn 421, has been invoked in order to obtain meaningful fits with an exponential decay to X–ray flares (Fossati et al., 2000). It is intriguing to investigate if such steady flux could originate in more extended jets such as those recently resolved by the Chandra and XMM telescopes, but aligned more closely to our line of sight and thus brighter. Such knots (or hotspots) in large-scale (hundreds of parsecs or more) jets have indeed been seen from radio to X–ray energies in many non-aligned sources i.e. sources where the jet is sufficiently misaligned to allow us to resolve the structure of the jet; of course such structures must also originate on a relatively large spatial scale as compared to the sub-parsec jets responsible for the rapid, day-scale variability. These knots are persistent structures visible on timescales of years, and individual spectral energy distributions (SEDs) have been established for knots in multiple sources such as M87 (Marshall, Miller et al., 2001) or PKS 0637752 (Chartas et al., 2000). Their fluxes are usually a fraction of the flux arising from the unresolved core, but a closer alignment to our line of sight than for those sources resolved by Chandra and XMM would result in greater Doppler boost and could provide a continuous background seen in BL Lac-type objects, presumably the objects most closely aligned to our line of sight.
To verify if a flux of a few 10-11 erg cm-2 s-1 could originate from aligned X–ray knots, some fluxes are taken from the literature for the cases where the angles to the line of sight ( hereafter) and Lorentz factors are available from radio observations. With this, it is possible to estimate the flux enhancement for and the luminosity at a distance similar to that of 1ES195965. The observed flux would depend on three factors:
-
•
A change in Doppler boost that multiplies the flux by (see Urry & Shafer (1984) for luminosity conversions) where is the Doppler factor for the same source but with an angle . Thus the amplification would be . Knowing the Lorentz factor we can write =
-
•
The distance difference changes the flux by a factor of
-
•
a K-correction has to be applied since the bandwidth is narrowed, changing the flux by a factor of where is the spectral index. This effect is minimal compared to the previous ones since in the X–ray band usually for BL Lac spectra.
The final ratio of the observed fluxes is then the product of these three terms.
4.3.1 Comparison with M87
The most popular scenario for the “parent population” of XBL-type blazars such as 1ES195965 is that these objects are FR-I type radio galaxies with their jets aligned close to our line of sight (see, e.g., Urry, Padovani, & Stickel 1991, UPS91 hereafter). In contrast, PKS 0637-752 is a member of the intrinsically more powerful FR-II class of objects. We thus believe that it is appropriate to compare 1ES195965 with the FR I radio galaxy M87 (), a nearby object that has knots resolved in the X–ray band (Marshall, Miller et al., 2001) as well as in the radio and optical (e.g. Perlman et al. (2001) and references therein). In the most popular models the X–ray radiation is either synchrotron radiation or inverse Compton scattering (see e.g. Wilson & Yang (2002)). From Biretta et al. (1999) (B99 hereafter) we find that a relativistic jet model requires a bulk flow with Lorentz factor and a jet orientation within from the line of sight. We will use two sets of presented in B99 based on this model.
The set is a possible configuration of the jet. These values may offer an explanation for the apparent lack of superluminal motion in M87 on parsec scales, and were assumed in the model of Bicknell & Begelman (1996). From Marshall, Miller et al. (2001) the flux density at 1 keV, summed over all the knots, is approximately 380 nJy and . Using a distance of 16 Mpc for M87, = 60 km s-1 Mpc-1 and =0.1, then would yield 20 10-11 erg cm-2 s-1 (or 8 mCrab) of flux coming from the knots. In this case, using an angle of would reduce the flux ratio by a factor of 8 (from 250) which would still keep the boosted knot radiation in the detectable range. An angle of was used as well in this example since this is the mean value of angle to the line of sight used recently by Costamante & Ghisellini (2001) as an input parameter for the successful synchrotron self-compton (SSC) model those authors have used to predict TeV candidate BL Lac objects.
The set of values also presented in B99 and consistent with their results yield a flux coming from the knots that is 40 times smaller (or 0.2 mCrab). This configuration is thus less likely to result in a flux of the level that is being looked for.
4.3.2 Comparison with 3C66B
3C66B is a low-luminosity FRI radio galaxy (). Its jet has knots resolved in the radio, optical and X–ray band (Hardcastle et al. (2001) and references therein). From Giovannini et al. (2001) we find that seems well constrained (about ) but that is not (between 1 and 7).
The set is a possible configuration of the jet that would come within the right order of magnitude to explain the origin of the X–ray radiation by IC scattering of seed photons from a hidden BL Lac in the nucleus of 3C66B. From Hardcastle et al. (2001) the flux density at 1 keV, for the 2 brightest knots out of 5 (A and B), is approximately 10 nJy. A value of is used, the one found for the jet, though the exact value does not matter much given the comparable redshift of 3C66B to the one of 1ES195965. The inferred value of yields 4 10-9 erg cm-2 s-1 (or 230 mCrab) of flux coming from the knots in the case of an angle at . Using an angle of would reduce the flux ratio by a factor of 2 only and make it still a bright steady source. The level of expected radiation in this case is actually so high that a similar object pointing closer to the line of sight would not be unnoticed in radio emission, thus the set seems quite extreme.
Taking a slower jet () also mentioned in Hardcastle et al. (2001) the flux coming from the knots of 3C66B would be a factor of lower than in the previous case, significantly below the level of a few 10-11 erg cm-2 s-1.
The results from M87 and 3C66B show that it is possible that radiation from knots moving close to the line of sight can generate a significant fraction of the baseline level of X–ray flux invoked in at least two cases, Mkn 421 and 1ES195965 here, assuming they contain knots similar to those observed in M87 or 3C66B. Recent VLBI observations show that the line of sight angle with Mkn 421 is constrained to be in the range (Giovannini et al., 2001), thus a small angle to the line of sight is a possibility for this source. In a more general way, UPS91 predict that FR I radio galaxies should have jets with bulk flow speeds in the range from 5 to 35, with most near 7, and they derive a critical angle for the FR I/BL Lac division. If bright knots are common in BL Lac objects then the amplification factors associated with the large Lorentz factors invoked here could generate a continuous background at the level mentioned above (assuming is of the order of a few degrees only). A more thorough search for evidence of continuous emission in blazars and other signatures of boosted knot radiation is currently under way.
5 Conclusions
This paper reports X–ray data obtained with the USA and RXTE missions, as well as archival observations for the BL Lac object 1ES195965. Variability on the timescale of a few days with a threefold flux increase in the 1–16 keV band was observed with the USA detector; this is consistent with timescales that have been seen in the optical band at other times. The X–ray data also show a clear correlation of the X–ray flux with the spectrum, which becomes harder when the source is brighter. The data presented in this paper represent an important contribution to the study of this object, a potential TeV emitter, as long term monitoring observations of it in the X–ray band were seldom performed in the past.
From the X–ray variability time scales, we estimate the Doppler factor of the jet to be 1.6. The spectral variability data allow an estimate of the magnetic field which is lower ( milliGauss), and Lorentz factor of radiating electrons which is higher () than those derived for the prototype TeV blazar Mkn 421. These parameters are more in line with those inferred for another possible TeV - emitting blazar, PKS 2005489. The data also show the need for X–ray observations of 1ES195965 longer than a few days in order to more accurately characterize the timescale of variability and its relationship with the spectrum. Also, since the source has been seen to be extremely variable in the optical band, future multi-wavelength observations of this object should include simultaneous optical observations.
We attempted to give a plausible scenario explaining the apparent baseline (“quiescent”) emission level seen here in 1ES195965 but also possibly previously observed in Mkn 421. Jets containing bright knots such as those seen by Chandra, but aligned more closely, within a few degrees to the line of sight (and therefore not resolvable as easily as jets with larger angles) and with Lorentz factors of have the required boosted flux to account for the “quiescent” X–ray emission in XBL-type BL Lac objects. Such emission would persist on timescales much longer than the duration of the flares that are much more likely to occur closer to the central object. This scenario can be confirmed by a more systematic study of knot X–ray luminosities in FR I objects, as well as the currently ongoing population study of the steady component of X–ray emission in BL Lac objects.
References
- (1)
- Beckmann (2000) Beckmann, V. 2000, PhD dissertation, Universität Hamburg
- Beckmann & Wolter (2001) Beckmann, V., Wolter, A. et al 2001, accepted in A&A (astro-ph/0112311)
- Bicknell & Begelman (1996) Bicknell, G. V., & Begelman, M. C. 1996, ApJ, 467, 597
- Biretta et al. (1999) Biretta, J. A., Sparks, W. B., and Macchetto, F. 1999, ApJ, 520, 621
- Bondi et al. (2001) Bondi, M., Marcha, M. J. M., Dallacasa, D. and Stanghellini, C. 2001, MNRAS, 325, 1109
- Catanese et al. (1997) Catanese, M. et al. Proceedings of the 25th ICRC (Durban, South Africa), vol. 3, eds. M. S. Potgieter, C. Raubenheimer, and D. J. van der Walt, p. 277. Transvaal, South Africa: Potchefstroom University, 1997
- Catanese et al. (1998) Catanese, M. et al. 1998, ApJ, 501, 616
- Catanese & Sambruna (2000) Catanese, M., & Sambruna, R. M., 2000, ApJ, 534, 39
- Chadwick et al. (1999) Chadwick, P. M. et al. 1999, Astroparticle Physics, 11, 145
- Chartas et al. (2000) Chartas, G., Worrall et al. 2000, ApJ, 542, 655
- Costamante et al. (2001) Costamante, L., Ghisellini, G., Tagliaferri, G. et al. 2001, A&A, 371, 512
- Costamante & Ghisellini (2001) Costamante, L. & Ghisellini, G. 2001 accepted in A&A (astro-ph/0112201)
- Fossati et al. (2000) Fossati, G. et al. 2000, ApJ, 541, 153
- Giebels et al. (2000) Giebels, B. et al. 2000, in AIP Conf. Proc. 558, High Energy Gamma-ray Astronomy, ed. F. A. Aharonian & H. J. Völk (New York: AIP), 668
- Giovannini et al. (2001) Giovannini, G. et al. 2001, ApJ, 552, 508
- Guy et al. (2000) Guy, J., Renault, C., Aharonian, F. A., Rivoal, M. and Tavernet, J.-P. 2000, A&A, 359, 419
- Hartman et al. (1999) Hartman, R. C. et al. 1999, ApJS, 123, 79
- Hardcastle et al. (2001) Hardcastle, M. J., Birkinshaw, M. and Worrall, D. M 2001, MNRAS, 326, 1499
- Jahoda et al. (1996) Jahoda, K., Swank, J. H., Giles, A. B., Stark, M. J., Strohmayer, T., Zhang, W., and Morgan, E. H. 1996, in Proc. SPIE, 2808, 59
- Kajino et al. (1999) Kajino, F. et al. 1999, 26th ICRC (Salt Lake City), OG 2.1.02, 3, 301
- Kirk & Mastichiadis (1999) Kirk, J. G., & Mastichiadis, A. 1999, Astroparticle Physics, 11, 45
- Kohmura et al. (1994) Kohmura, Y., Makishima, K., Tashiro, M., Ohashi, T., and Urry, C. M. 1994, PASJ, 46, 131
- Madejski et al. (1996) Madejski, G., Takahashi, T., Tashiro, M., Kubo, H., Hartman, R., Kallman, T., and Sikora, M, 1996, ApJ, 459, 156
- Marcha et al. (1996) Marcha, M. J. M. et al. 1996, MNRAS, 281, 425
- Marshall, Miller et al. (2001) Marshall, H. L. et al. 2001, accepted in ApJ(astro-ph/0109160)
- Mattox et al. (1993) Mattox, J. R. et al. 1993, ApJ, 410, 609
- Mukherjee et al. (1997) Mukherjee, R. et al. 1997, ApJ, 490, 116
- Perlman et al. (1996) Perlman, E. S. et al. 1996, ApJS, 104, 251
- Perlman et al. (1999) Perlman, E. S., Madejski, G., Stocke, J. T., and Rector, T. A. 1999, ApJ, 523, L11
- Perlman et al. (2001) Perlman, E. S., Biretta, J. A., Sparks, W. B., Duccio Macchetto, F. and Leahy, J. P. 2001, ApJ, 551, 206
- Pian et al. (1998) Pian, E. et al. 1998, ApJ, 492, L17
- Primack et al. (1999) Primack, J. R., Bullock, J. S., Somerville, R. S., and MacMinn, D. 1999, Astroparticle Physics, 11, 93
- Punch et al. (1992) Punch, M. et al. 1992, Nature, 358, 477
- Quinn et al. (1996) Quinn, J., et al. 1996, ApJ, 456, L83
- Ray et al. (1999) Ray, P. S. et al. 1999, in X–ray Astronomy 1999, Bologna, Italy, in press (astro-ph/9911236)
- Rybicki & Lightman (1979) Rybicki, G. B. & Lightman, A. P. 1979, Radiative Processes in Astrophysics (New York: Wiley)
- Sambruna et al. (2001) Sambruna, R. M., Urry, C. M., Tavecchio, F., Maraschi, L., Scarpa, R., Chartas, G., and Muxlow, T. 2001, ApJ,549, L161
- Sembay et al. (1993) Sembay, S. et al. 1993, ApJ, 404, 212
- Shabad (2000) Shabad, G. 2000, Stanford Ph.D. Thesis, SLAC Report No. 562
- Stecker, De Jager & Salamon (1996) Stecker, F. W., De Jager, O. C., and Salamon, M. H., 1996, ApJ, 473, L75
- Takahashi et al. (1996) Takahashi, T. et al. 1996, ApJ, 470, L89
- Takahashi et al. (2000) Takahashi, Kataoka, J., Madejski, G., Mattox, J., Urry, C. M., Wagner, S. et al. 2000, ApJ, 542, 105
- Tavecchio, Maraschi & Ghisellini (1998) Tavecchio, F., Maraschi, L., and Ghisellini, G. 1998, ApJ, 509, 608
- Urry & Shafer (1984) Urry, C. M. & Shafer, R. A. 1984, ApJ, 280, 569
- Urry, Padovani & Stickel (1991) Urry, C. M., Padovani, P., and Stickel, M. 1991, ApJ, 382, 501
- Villata et al. (2000) Villata, M. et al. 2000, ApJS, 144, 481
- Weekes (1999) Weekes, T. C., 1999 in AIP Conf. Proc. 515, Towards a Major Atmospheric Cherenkov Detector VI, ed. B. L. Dingus, M. H. Salamon, D. B. Kieda (New York: AIP), 3
- Wood et al. (2000) Wood, K. et al. 2000, ApJ, 544, 45
- Wilson & Yang (2002) Wilson, A. S. and Yang, Y. 2002, accepted by ApJ.
| Date (2000) | (mCrab) | HR |
|---|---|---|
| Oct 6 | 4.2 | |
| Oct 6 | 4.1 | |
| Oct 8 | 5.2 | |
| Oct 8 | 5.2 | |
| Oct 9 | 5.0 | |
| Oct 10 | 5.3 | |
| Oct 11 | 4.0 | |
| Oct 12 | 3.5 | |
| Oct 14 | 2.7 | |
| Oct 15 | 3.2 | |
| Oct 16 | 3.9 | |
| Oct 17 | 3.9 | |
| Oct 19 | 4.1 | |
| Oct 20 | 3.3 | |
| Oct 22 | 2.6 | |
| Oct 23 | 2.5 | |
| Oct 24 | 2.7 | |
| Oct 27 | 4.1 | |
| Oct 28 | 4.1 | |
| Oct 29 | 4.7 | |
| Nov 2 | 3.7 | |
| Nov 3 | 3.4 | |
| Nov 5 | 3.9 | |
| Nov 7 | 4.4 | |
| Nov 8 | 3.9 | |
| Nov 9 | 4.9 | |
| Nov 10 | 6.0 | |
| Nov 11 | 8.7 | |
| Nov 12 | 10.4 | |
| Nov 14 | 11.6 | |
| Nov 15 | 10.8 |
| Date (2000) | (2-10 keV) | |
|---|---|---|
| Jul 28.9 | 1.40 | |
| Jul 29.0 | 1.38 | |
| Jul 29.1 | 1.40 | |
| Jul 29.9 | 1.32 | |
| Jul 30.0 | 1.28 | |
| Jul 30.1 | 1.27 | |
| Jul 30.9 | 1.19 | |
| Aug 01.0 | 1.22 | |
| Aug 01.1 | 1.19 | |
| Aug 01.9 | 1.06 | |
| Aug 02.0 | 1.02 | |
| Aug 02.1 | 1.08 | |
| Sept 01.0 | 0.86 | |
| Sept 02.9 | 0.84 | |
| Sept 03.9 | 1.04 | |
| Sept 04.9 | 1.19 | |
| Sept 05.9 | 1.38 |