A New Look at the X-ray Properties of Our Galaxy
Abstract
Observational programmes currently underway with both Chandra and XMM-Newton are set to revolutionize our view of our own Galaxy. This is fortunate since the X-ray band can provide crucial diagnostics in the quest to understand the composition and structure of the Galaxy and the high energy processes which influence its evolution. Here we review several areas in which rapid progress is being made. These include investigations into the nature of the Galactic X-ray source population at faint fluxes, the distribution and origin of the X-ray emission emanating from the Galactic Centre Region and the spectral characteristics of the Galactic Soft X-ray Background.
keywords:
Galaxy: center – Galaxy: disk – X-rays: binaries – X-rays: ISM – X-rays: stars1 Introduction
Viewed from outside, say from a distance of a few Mpc, our own Galaxy would appear as a fairly unremarkable, but multi-faceted X-ray source. Table 1 provides a very rough breakdown of the contribution that the various X-ray emitting objects, populations and diffuse components make to the total X-ray luminosity of the Milky Way. The brightest few dozen LMXRB/HMXRB dominate the integrated discrete source signal, with diffuse emission associated with the Galactic Disk, Bulge and Halo providing a roughly matching contribution. At the present, the active galactic nucleus is not a particularly significant source of X-ray emission ([\astronciteBaganoff et al.2001]), although there are some indications of episodes of much more luminous activity in the recent past ([\astronciteKoyama et al.1996]; [\astronciteMurakami et al.2001]; [\astronciteMaeda et al.2002]).
| Type of Emitter | Number in | Summed |
|---|---|---|
| Galaxy | ||
| HMXRB | ||
| LMXRB | ||
| SNR | ||
| CVs | ||
| RSCVn | ||
| Stellar Coronae | ||
| Active Nucleus | 1 | |
| Diffuse Disk | 1 | |
| Diffuse Bulge | 1 | |
| Diffuse Halo | 1 | |
| Total |
The spatial distribution and luminosity function of the brightest discrete sources have recently been investigated by [*]rwarwick-E1:Gri01. These authors also demonstrate that the Galaxy’s X-ray binary population is considerably more luminous than that in M31, but unexceptional against the yardstick of more active spirals and giant elliptical galaxies. Unfortunately the spatial extent and luminosity of the diffuse emission, particularly that associated with the Galactic halo, is much less well defined and we have to look for Milky Way analogues amongst nearby galaxies to gain a more complete perspective (e.g. [\astronciteWang2002a]).
In this paper, we will not be looking at the most X-ray luminous components of our Galaxy but, instead, focusing on three areas of Galactic X-ray Astronomy in which major advances can be expected as a result of on-going XMM-Newton and Chandra programmes. These two missions provide, essentially for the first time, instruments capable of carrying out high sensitivity, coherent surveys of selected regions of our Galaxy. Although, of course, ROSAT has conducted a definitive soft X-ray all-sky survey, for Galactic studies access to the hard 2–10 keV band is paramount in order to overcome the obscuration of the cool interstellar medium. For example, towards the Galactic Centre photoelectric absorption in a hydrogen column density of ([\astronciteBaganoff et al.2001]) gives rise to a sharp cut-off in X-ray spectra below keV.
2 Faint Galactic X-ray Source Populations
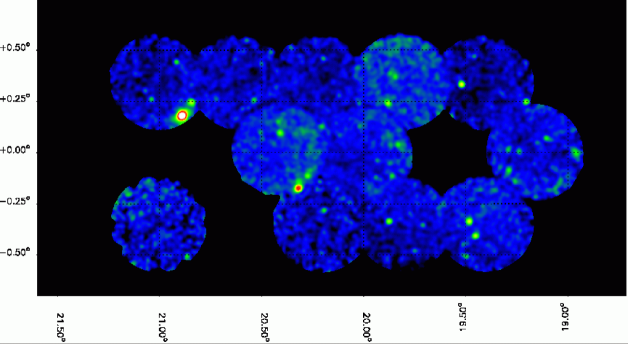
Both XMM-Newton and Chandra are carrying out surveys in the Galactic Plane. One such programme is the XMM-Newton Galactic Plane Survey (hereafter the XGPS survey) which aims to map a narrow 5\degr strip of the plane near longitude 22\degr. A total of 40 short observations amounting to 200 ks exposure time were awarded for this purpose in AO-1. To date about 40% of the XGPS observations have been carried out; Fig. 1 shows a mosaic of 12 of the XGPS fields.
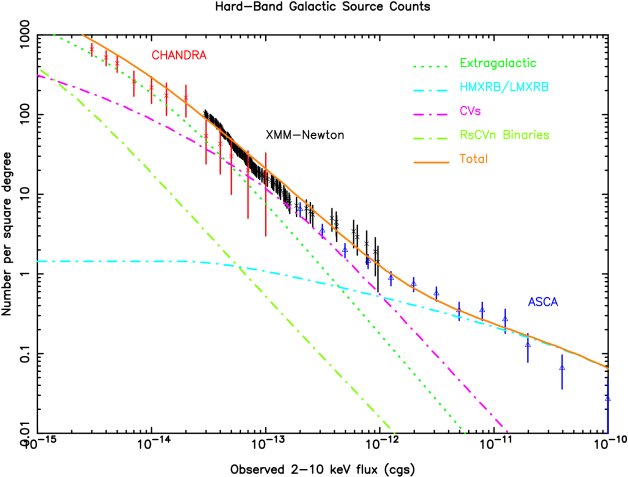
So far a total of 223 discrete sources have been detected in the XGPS survey at a significance greater than 5 in either the EPIC-pn and/or EPIC-MOS cameras (for more details, see [\astronciteHands et al.2002]). We have used the XGPS source catalogue to construct a log N - log S curve for the low Galactic latitude sky. The normalisation and slope of this relation can, in principle, provide important information on the spatial distribution and luminosity function of the various Galactic source populations, albeit bound-up with line-of-sight absorption effects. Fig. 2 shows the derived 2–10 keV log N - log S distribution for the XGPS sources after correcting for sky coverage effects. For comparison the source counts derived from the extensive survey of the Galactic plane carried by ASCA ([\astronciteSugizaki et al.2001]) and from recent deep Chandra ([\astronciteEbisawa et al.2001]) observations are also shown. As can be seen from the figure, the flux range probed by the XGPS survey is intermediate between that sampled by the ASCA and Chandra programmes. The slope of the log N - log S curve is, as expected, flatter than that measured for the extragalactic sky.
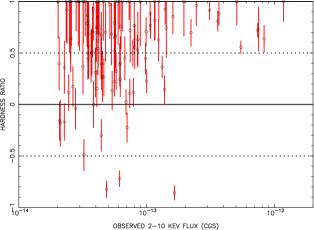
The measured Galactic source counts have been compared with predictions for various source populations based on fairly simple source distribution and luminosity models (Fig. 2). This preliminary analysis suggests that the Galactic population dominates down to a flux of (2–10 keV) below which the contribution of extragalactic sources (seen through the appreciable Galactic column density in this direction) grows rapidly. The hardness ratio distribution of the sources (Fig. 3) exhibits significant scatter but is consistent with the view that a highly absorbed extragalactic population emerges largely at the lower end of flux range sampled in the XGPS survey. This analysis confirms that the strategy of the XGPS survey, namely relatively short (5–10 ks) observations but fairly wide-angle coverage, is well tuned to the objective of studying Galactic X-ray source populations at faint fluxes.
The XGPS survey has so far yielded in excess of 200 point source detections and a realistic target for the full AO1 programme is an X-ray source catalogue with between 500 and 1000 entries. This will provide a valuable resource for studying the Galactic X-ray source population at faint fluxes (i.e. down to ). The challenge is then to conduct an intensive programme of optical identifications so as to confirm the nature of the underlying populations. Work in this area is currently underway (e.g. [\astronciteMotch et al.2002]).
3 X-rays from the Galactic Centre Region
The central parsecs of our Galaxy is a unique region with a very complex structure which, due to the high obscuration in the optical band, has been investigated mainly through radio, infrared and X-ray observations. The central solar mass, black-hole, which is spatially coincident with the compact radio source Sgr at the dynamical centre of the Galaxy, is currently in a relatively quiescent state ([\astronciteBaganoff et al.2001]). Nevertheless the Galactic Centre Region (hereafter GCR) as a whole is X-ray bright due to the presence of large-scale diffuse emission, several very luminous () X-ray binaries and an underlying population of intermediate luminosity discrete sources.
A major survey of the GCR in the hard (2–10 keV) X-ray band has previously been carried out by ASCA ([\astronciteKoyama et al.1996]; [\astronciteSakano et al.2002]) and recently the Chandra X-ray Observatory has also mapped the region on arcsec scales ([\astronciteWang2002a]; [\astronciteWang et al.2002b]). Here we provide a preliminary report of a complementary XMM-Newton programme (PI: Anne Decourchelle) to survey the Galactic Plane within of the Galactic Centre.
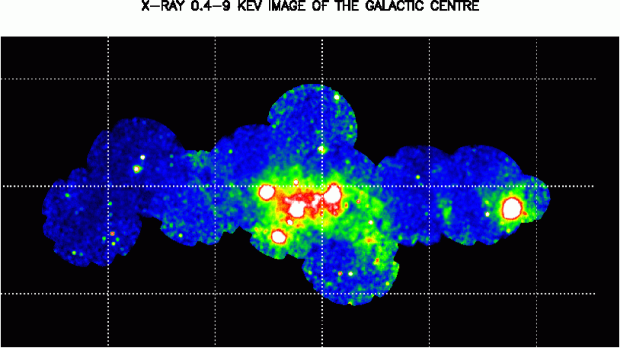
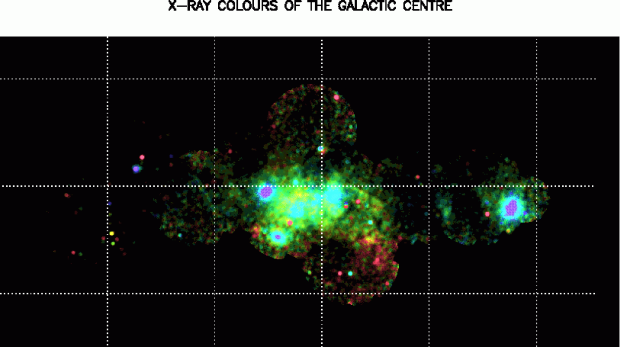
The XMM-Newton programme to map the GCR consists of 10 overlapping pointings (plus one or two additional observations targeted at specific Galactic Centre sources). Fig. 4 shows a preliminary mosaiced image based on the MOS 1+2 datasets covering a broad 0.4–9 keV bandpass. This image has been background-subtracted and corrected for exposure time variations due to the telescope vignetting and the field overlaps. Fig. 4 also shows a false-colour image based on the subdivision of the data into soft (0.4–2 keV), medium (2–5 keV) and hard (5–9 keV) spectral bandpasses. The effects of X-ray absorption vary across the field but will be most acute for the soft X-ray band.
These XMM-Newton images reveal the presence of three very bright discrete sources, namely 1E1743-2843 (at l,b = 0.3,0.0), 1E 1740.7-2942 (at 359.1,-0.1) and SAX J1740.0-2853 (at 0.2,-0.2), together with the bright extended X-ray emission associated with the the non-thermal radio source Sgr A East ([\astronciteMaeda et al.2002]). The large-scale diffuse X-ray emission in the GCR has an asymmetric distribution, with the Radio Arc Region, 10\arcmin to the southeast of the Galactic Centre, exhibiting a particularly high X-ray surface brightness. On the other side of the Galactic Centre the diffuse X-ray emission appears to sweep southward away from the Galactic Plane; the spectral softening of this component towards the edge of the field of view in Fig. 4 may well be due to the reduced obscuration off the Galactic Plane. Closer inspection of these images also reveals X-ray emission associated with the Sgr B2 and Sgr C complexes and several known SNR including G0.9+0.1. An underlying population of faint point sources is also apparent throughout the region.
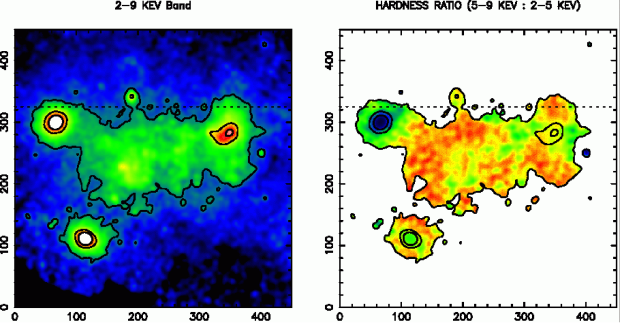
Fig. 5 shows in more detail the distribution of diffuse emission to the east of the Galactic Centre and also the variation in the 5–9 keV : 2–5 keV hardness ratio across the same region. The source 1E1743-2843, and a second source to the west of Sgr , have particularly hard spectra. The diffuse X-ray component exhibits considerable spectral variations on scales down to 1\arcmin consistent with the complex mix of thermal and non-thermal components present in the Radio Arc Region ([\astronciteLaRosa et al.2000]; [\astronciteBamba et al.2002]). The linear structure which crosses Sgr A East in the hardness ratio map maybe indicative of a soft bipolar outflow from this region in a direction roughly perpendicular to the Galactic Plane (see also [\astronciteMaeda et al.2002]). An alternative possibility is that there is excess absorption in a highly flattened distribution lying roughly parallel to the Galactic Plane such as to intercept our line of sight to Sgr A East. This issue which will be clarified by detailed analysis of the available EPIC pn and MOS spectra.
To illustrate the quality of the available EPIC spectral data, we have extracted MOS 1+2 spectra from two circular regions of radius and radius, centred respectively on Sgr A East and the brightest knots of the Radio Arc region. Fig. 6 compares the resulting spectra. For these spectra the instrumental background has been subtracted (see next section) but no correction has been made for energy dependence of the telescope vignetting function. The normalisations have been scaled to align the continua in the 4–6 keV band.
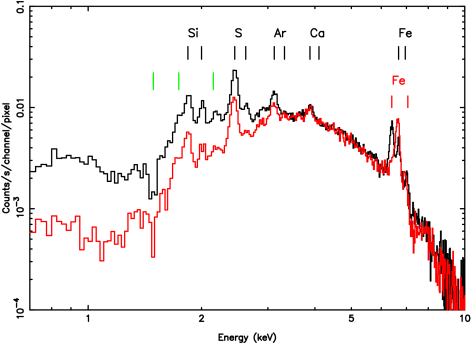
These spectra illustrate many of the well-established properties of the diffuse X-ray emitting components in the GCR, namely bright K lines of the helium-like and hydrogen-like ions of silicon, sulphur, argon, calcium and iron plus a hint of some helium-like K lines. The Radio Arc Region is also characterised by a bright fluorescent K line of neutral iron, a feature which is absent from the Sgr A East spectrum ([\astronciteMaeda et al.2002]). Apart from the neutral iron line and the extra absorption which is evident in the spectrum of Sgr A East the extracted spectra show remarkable similarities particularly in the form of the continuum above keV. Why there should be such a similarity is a puzzle given the identification of Sgr A East with a supernova remnant (SNR 000.0+00.0), whereas the Radio Arc region contains a complex blend of thermal emission structures, non-thermal filaments, SNRs, dense clouds and star clusters. The origin and nature of the diffuse X-ray emission seen in the GCR and in Galactic Plane in the form of the Galactic X-ray Ridge remains a topic of active debate, with many of the observed properties, including the constancy of the spectrum, casting doubt on a purely thermal origin for the emission ([\astronciteValinia et al.2000]; [\astronciteTanaka et al.2000]). In this respect, future detailed characterisation and analysis of the EPIC spectra from the XMM-Newton Galactic Centre programme will be of considerable interest.
4 The Spectrum of the Soft X-ray Background


The diffuse soft X-ray background (SXRB) originates predominately in the thermal emission of hot plasma located in the Galactic Halo, in the Galactic Bulge, in the Galactic Plane (forming the so-called Galactic Ridge) and in large loop and ring structures, such as radio Loop 1, associated with nearby SNRs. The ROSAT all-sky survey has provided excellent maps ([\astronciteSnowden et al.1997]) of the SXRB which delineate the various emission features and also reveal marked spectral variations across the sky. The impact in certain regions, most notably the Galactic Plane, of photoelectric absorption in interstellar clouds is also evident. The complex spatial distribution of the Galactic SXRB suggests immediately that it is truly diffuse emission. This is in accord with the fact that there is no known population of discrete source which could account for the observed X-rays. The emission undoubtedly comes from volumes of hot interstellar gas but the detailed 3-d morphology, the origin of the gas, the heating mechanism and the physical state and composition of the material is very poorly understood.
In order to study the true distribution and state of the hot gas that comprises the SXRB, mapping on an angular scale of in individual spectral lines or blends of lines is required. A limited number of moderate energy resolution measurements indicate a wide range of spectral signatures (e.g. [\astronciteRocchia et al.1984]; [\astronciteGendreau et al.1995]; [\astronciteMendenhall & Burrows2001]). For example, there is clear evidence that the spectrum differs strongly between the North Polar Spur (part of Loop I) and the Galactic Bulge emission. However, many of the available measurements are from sounding rocket observations using large fields of view (100’s of square degrees), which average over very significant spatial structure in order to gather sufficient counts for spectral measurements. In contrast ASCA observations have a small field of view, but in practice must also be averaged over different directions to achieve adequate statistics (as well as having limited usefulness below keV). In summary, our present understanding of the spectral composition of the SXRB is very incomplete.
The EPIC instrument on XMM-Newton is well suited to the detection of extended sources with relatively low X-ray surface brightness. Following recent progress in characterising the instrumental background, it appears that the spectrum of diffuse components, filling the full (30\arcmin) field of view of the EPIC cameras, can also be measured with good precision (see [\astronciteLumb et al.2002]). Here we report recent progress in measuring the spectrum of the SXRB with XMM-Newton.
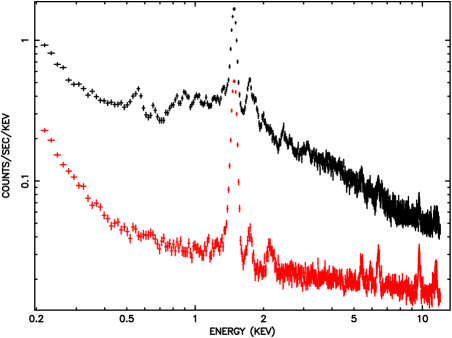
For this study we use the EPIC MOS cameras which have a substantial active CCD area outside the nominal field of view defined by the optical blocking filter. Starting from the calibrated event lists generated by the Science Analysis System (SAS), the full-field MOS light curves are screened for “soft proton flares”, namely a highly variable flux of low energy particles trapped within the magnetosphere which are focused by the mirror systems onto the CCD detectors. In the selected “quiescent background” intervals, the charged particle induced events which are not rejected by the on-board or ground processing give rise to a residual background component that is relatively constant in spectrum and which shows little variation across the detector. The covered edge regions of the MOS CCDs provide a direct measure of this internal instrumental background, which can be used to background-subtract the central field signal (Fig. 7). An extra complication is that the the passage of charged particles through the cameras induces fluorescent X-ray emission in the form of emission lines at energies characteristic of the materials used in the camera construction. Thus, for example, strong K lines at 1.48 keV and 1.74 keV due, respectively, to aluminium in the camera body and silicon in the CCDs are present in the MOS spectra (Fig. 7). Unfortunately, these fluorescent lines are not uniformly distributed across the MOS CCDs ([\astronciteLumb et al.2002]) and it is necessary to exclude regions of the spectrum which, even after background-subtraction, remain contaminated by such features.
Our preliminary measurements of the spectrum of the SXRB are shown in Fig. 8. The four fields sample the Galactic Plane, the inner Galactic Bulge and two locations in the North Polar Spur. Emission lines due to OVII, OVIII, FeXVII, NeIX, NeX and Mg XI are detected in three out of the four fields with only OVII apparent, presumably as a foreground component, in the Galactic Plane. The spectra vary considerable from field to field reflecting changes both in the temperature, composition and possibly the degree of ionization non-equilibrium of the plasma. Also, the Galactic Plane and Bulge regions are characterized by hard components that are significantly more intense than in either of the Loop 1 fields. As a check we have compared the SXRB surface brightness derived from MOS spectra in the 0.5–2.0 keV band with that measured in the diffuse SXRB maps from the RASS. The correlation is very good, verifying that the spectra in Fig. 8 provide good estimates of the true SXRB signal.
To date we have carried out only limited quantitative analysis of these spectra. The evidence for two temperature components is quite strong in all fields (typically with and keV). There is also evidence that the abundances are significantly lower than solar, although this will depend on the temperature structure. It may be that the higher Z material is found preferentially in the cold gaseous phase of the ISM or is locked up in interstellar grains. In the future we will undertake a much more detailed analysis, for example the ratio of the OVIII/OVII measures the ionization conditions and, for isochoric cooling with K, provides a good indicator of the temperature. The Fe line emission at around 0.7 keV is also sensitive to non-equilibrium ionization effects.
5 Conclusions
The XMM-Newton and Chandra missions are proving to be the drivers of a revolution in our knowledge of the high energy properties of our Galaxy. This paper has focussed on the spectral imaging capabilities of XMM-Newton which are very well suited to the study of faint Galactic source populations, active regions of the Galaxy such as the GCR and the low-surface brightness features of the diffuse SXRB.
Acknowledgements.
This paper refers to a number of preliminary results from on-going XMM-Newton programmes. The author would like to thank many colleagues and, in particular, A. Decourchelle, A. Hands, D. Helfand, D. Lumb, M. Sakano, M. Watson and R. Willingale, for allowing unpublished results from collaborative work to be included in this paper.References
- [\astronciteBaganoff et al.2001] Baganoff F. et al., 2001, Nature, 413, 45
- [\astronciteBamba et al.2002] Bamba A. et al., 2002, these proceedings
- [\astronciteEbisawa et al.2001] Ebisawa K., Maeda Y., Kaneda H., Yamauchi S., 2001, Science 293, 1633
- [\astronciteGendreau et al.1995] Gendreau K.C., et al., 1995, PASJ, 47, L5
- [\astronciteGrimm et al.2001] Grimm L-H., Gilfanov M., Sunyaev R., 2001, astro.ph/0109239
- [\astronciteHands et al.2002] Hands A, Warwick R., Watson M., Helfand D., 2002, these proceedings
- [\astronciteKoyama et al.1996] Koyama K., Maeda Y., Sonobe T., Takeshima T., Tanaka Y., Yamauchi S., 1996, PASJ, 48, 249
- [\astronciteLaRosa et al.2000] LaRosa T.N., Kassim N.E., Lazio T.J.W., Hyman S.D., 2000, ApJ, 119, 207
- [\astronciteLumb et al.2002] Lumb D.H., Warwick R.S., Page M., de Luca, A., 2002, A&A, submitted
- [\astronciteMaeda et al.2002] Maeda Y., et al., 2002, ApJ, in press
- [\astronciteMendenhall & Burrows2001] Mendenhall J.A., Burrows D.N. 2001, ApJ, 563, 716
- [\astronciteMotch et al.2002] Motch C., et al., 2002, these proceedings
- [\astronciteMurakami et al.2001] Murakami H., Koyama K., Maeda Y., 2001, ApJ, 558, 687
- [\astronciteRocchia et al.1984] Rocchia R., et al., 1984, A&A, 130, 53
- [\astronciteSakano et al.2002] Sakano M., et al., 2002, ApJS, 138, 19
- [\astronciteSnowden et al.1997] Snowden S.L., et al. 1997, ApJ, 485, 125
- [\astronciteSugizaki et al.2001] Sugizaki M., et al., 2001, ApJS, 134, 77
- [\astronciteTanaka et al.2000] Tanaka Y., et al., 2000, PASJ, 52, L25
- [\astronciteValinia et al.2000] Valinia A., et al., 2000, ApJ, 543, 733
- [\astronciteWang2002a] Wang Q.D., 2002, these proceedings
- [\astronciteWang et al.2002b] Wang Q.D., Gotthelf, E.V., Lang C.C., 2002, Nature, 415, 148