A wall of dust around a proto-Mira
Abstract
We present the discovery of a huge (19 16) dust ring surrounding a bright ( = 10.60) red star. The dust ring has, at pc, a diameter of 4 pc, and a central hole of 1.5 pc across. Part of the shell is also seen as an absorption nebulosity. The star is classified as a M3III AGB star. Among AGB stars its detached shell is of unrivalled size. Detached shells around AGB stars are normally interpreted in terms of thermal pulses. However, in this case a significant fraction of the shell may consist of swept-up ISM; the detached appearance can be explained with wind–ISM interaction. We present a model where the AGB wind has been stopped by the surrounding ISM, and the swept-up shell is now expanding at the sound speed. The model predicts that the ring will disperse over a few times yr, and eventually will leave a large hole in the ISM surrounding the AGB star or its future planetary nebula.
1 AGB Supershells
Mass loss dominates stellar evolution on the Asymptotic Giant Branch (AGB). The mass loss probably begins on the early AGB, or even the first Red Giant Branch (Jura, 1999), but culminates during the last 10% of the AGB, the thermal-pulsing AGB (TP-AGB). Observed mass-loss rates range from for semiregulars and Miras, up to a few times for OH/IR stars and obscured carbon stars. Typically, the Mira phase lasts between and a few times yr (e.g. Wood 1990). The OH/IR star or the obscured carbon star phase may last yr. Because the mass-loss rates increase during the AGB evolution, circumstellar shells may be expected to have a centrally-condensed, compact appearance. But mass-loss fluctuations during the thermal-pulse cycle can lead to detached circumstellar shells (Vassiliadis & Wood, 1993), and observations of detached shells have been interpreted as such (Zijlstra et al., 1992).
Evidence for detached shells came from the IRAS point source data, when Willems & de Jong (1986) found carbon stars with excess flux at 60m. Zijlstra et al. (1992), in the same way, found oxygen-rich stars (M stars) with detached shells; they interpreted these in terms of mass-loss variations during the thermal-pulse cycle. From IRAS spectroscopy Hashimoto et al. (1998) found evidence for a detached shell with a small inner radius around the O-rich star R Hya (see also Zijlstra & Bedding 2002).
Photometric evidence may be affected by cirrus (Iveciz & Elitzur, 1995), and direct imaging can give more stringent evidence for detached shells. Izumiura et al. (1996, 1997) imaged detached shells around the carbon stars Y CVn and U Ant, with U Ant even showing a double detached shell. A spectacular thin CO ring was found around the carbon star TT Cyg (Olofsson et al., 1998, 2000). Lindqvist et al. (1999) found a detached shell around the carbon star U Cam. Speck et al. (2000) reported parsec-sized thin dust shells around two carbon-rich post-AGB stars, AFGL 2688 and AFGL 618, indicating episodic mass-loss variations with timescales of a few times 104 years. A thermal-pulse explanation is likely for all these cases.
Circumstellar shells could grow to very large dimensions during the AGB evolution. In principle, a gradual and gentle slow-down of the earliest ejected shell(s) by the ISM could allow subsequently expelled matter to catch up, and yield very large, detached-appearing shells independent of the thermal-pulse cycle. Young et al. (1993), using IRAS survey data for 512 AGB stars and young PNe (mostly within 1 kpc), found a total of 76 stars with circumstellar shells greater than 2 in the 60m data. Of these, four shells are larger than 4 pc in diameter; all four appear detached, having inner diameters of between 0.5 and 1.4 pc. (The detection of these shells is complicated by the often very bright central sources, requiring deconvolution techniques to separate the shell from the PSF of the stellar source).
Such fossil shells carry the imprint of the mass-loss history and the structure and density of the ISM. They could help to explain the presence of halos around planetary nebulae (but see Corradi et al. 2000) and the interaction of the most evolved of them with interstellar matter. Clearly, a search for extended shells - the larger, the better - is of interest.
Here we report on an extreme dust shell around the source IRAS 02091+6333, with a diameter of 4 pc. We interpret the shell not in terms of mass-loss variations, but as a wall of swept-up ISM. We suggest that rings and walls around evolved stars may not have a single explanation.
2 Observations
2.1 The Dust Shell
The dust ring was discovered by one of us (RW) during a search for extremely extended structures, such as holes and emission regions around planetary nebulae, on the IRAS SkyView maps provided by NASA. It is visible at 60m and - slightly better - at 100m, and attracted our attention because of its well-defined shape and the presence of a stellar, almost centrally located object, prominent at 12m but fainter at 25m and absent at longer wavelengths. The shape of the dust emission suggests that the central source is responsible for the ring, which has the appearance of a detached shell. The shell is brightest at 100m indicative of cold dust. Interestingly, the shell, particularly its brightest part towards the south, is also optically identifiable as an absorbing cloud on the POSS I blue-sensitive (O) plates. The stellar field is very dense (consistent with low foreground extinction for a line of sight near the Galactic plane) and the lack of blue stars in the small patch is highly noticeable. We estimate from the appearance of the patch that mag.
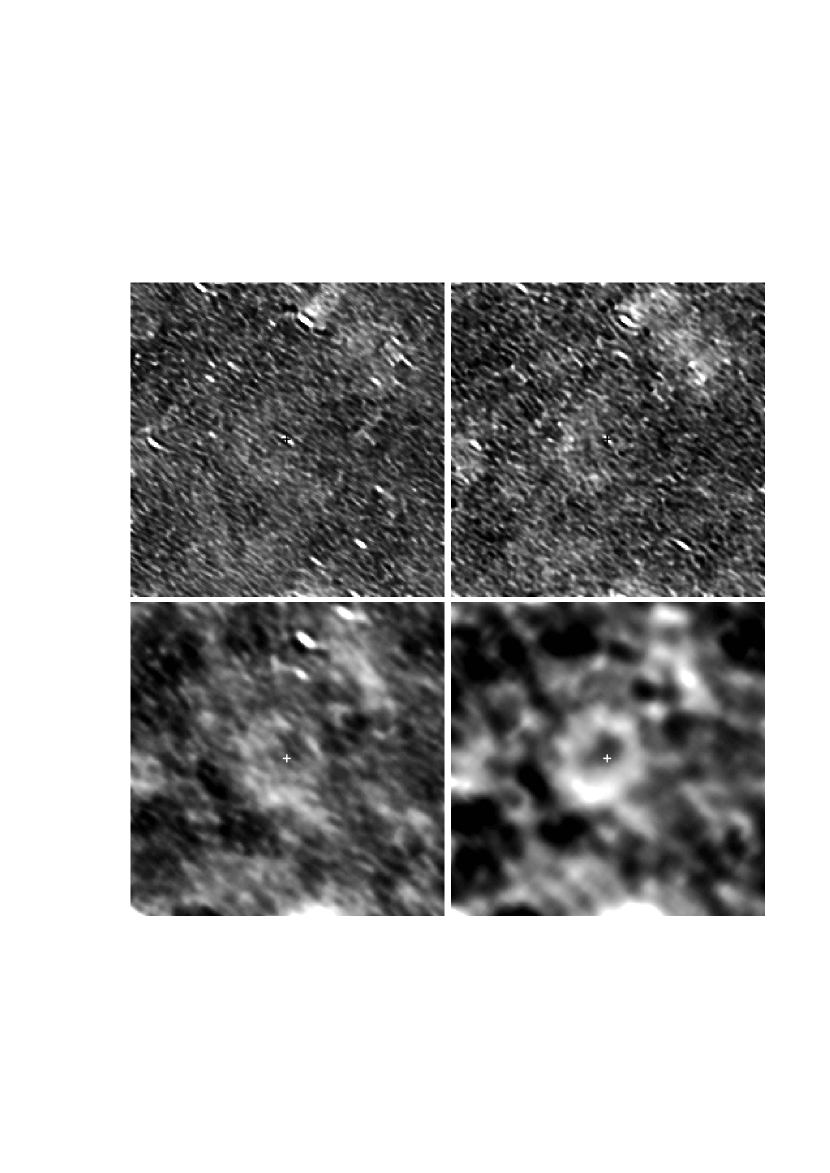
The processed IRAS images, retrieved from the IPAC SkyView images, and also remade from the original (recalibrated) scans using the IRAS Software Telescope (Assendorp et al., 1995), are shown in Fig. 1. The emission at 100m has a slightly elliptical shape, with the long axis in the N-S direction. It consists of a ring of emission which is thicker (and brightest) in the south and least thick in the west. There is a distinct, approximately round, central cavity. The outer dimensions are 19 16, corresponding to 3.9 3.2 pc at pc (see below). The ring has a mean apparent thickness of 1.0 pc, and the cavity is 1.6 pc in diameter. The resolution of IRAS at 100-m is sufficient to resolve the cavity, but the thickness of the ring is likely affected by the IRAS beam. The emission spur towards the south-west is probably unrelated (it has a different colour temperature). The total flux of the ring is about 20 Jy at 60m and 70 Jy at 100m: both values are uncertain due to the need to subtract a sloping background.
The concave thickening of the ring in the south is suggestive of an interaction with the ISM of the Galactic plane which runs approximately E-W, 2.3∘ below the object. But this interaction has had no marked effect on the outer shape of the ring.
A subtraction of the 60-m from the 100-m map, carried out using the unprocessed images, showed that there is no obvious radial dependence within the ring. The black-body dust temperature is about 35 K. The large distance from the central star indicates the shell is heated externally (e.g., Young et al. 1993; Speck et al. 2000). The temperature should be compared to typical values for Galactic cirrus emission of 15–20 K (Boulanger et al., 2001).
2.2 The Central Star
The flux densities of the central source (Table 1) are consistent with photospheric emission. Optical images from the Palomar Sky Surveys show a star coincident with the central source. Although rather bright, very red, and located not far from the Galactic plane () in one of the most studied regions of the Milky Way, SIMBAD does not list individual observers. It is present in the Guide Star Catalog (GSC-id 0404101743), in the AC2000, and was covered by the TYCHO experiment onboard of HIPPARCOS. Data for the star are listed in Table 1.
One long-slit spectrum (300 sec) of the star was taken with the instrument AFOSC attached to the 1.82 m telescope of the Asiago Observatory. It was obtained on Dec 1st 1999, at an air mass of 1.4. The spectral range covered was 3940 – 7860 Å and the dispersion was 4.9 Å/pixel. Another spectrum was kindly provided by Maurice Gavin, taken on Dec 21st, 1999 at the Worcester Park Observatory (UK) at a dispersion of 40 Å/pixel. Both spectra were reduced in the usual way. The spectra show only the star itself, i.e. we found no traces of any nebulosity in its immediate neighborhood. The TiO bands are very well visible and establish the spectral type as M3 or M4. We could however not determine the luminosity class. The discussion below shows that a giant is most probable and we will assume the object to be an M3 III star. Several photometric runs in BVRI were kindly done for us by Roger Pickard, who used his 40 cm Newtonian Reflector. He reported = 2.06.
| Position | |||
|---|---|---|---|
| (J2000) | |||
| proper motion | |||
| Photometry | Tycho | GSC | Pickard |
| B | 12.55/11.7 | ||
| V | 9.96/10.12 | 10.5–10.1 | |
| R | 9.5/9.3 | ||
| I | 7.4/7.3 | ||
| IRAS 12m | 1.28 Jy | MSX 8.28m | 1.77 Jy |
| 25m | 0.36 Jy | 14.65m | 1.24 Jy |
| E(B-V) | 0.42 | ||
| Spectral type | M3III | ||
| distance | 700: pc | ||
The central star appears to have a slight offset of from the center of the shell. However, this apparent offset is in part caused by the difference in brightness between the N and S part of the shell. Compared to the peak brightness positions, the star is very well centred, 7′ from the two components.
2.3 Association or Confusion?
Although the star is close to the centre of the ring, in such a dense stellar field the chance of an accidental superposition of the shell and the central source has to be addressed. The IRAS catalogue lists 49 sources located within radius of the present position. Of these, 36 are detected at 12m and 20 are detected at both 12 and 25m. One of these has the colours of an HII region and can be removed. Of the 36 candidates, 14 appear to be associated with a GSC star of , within 5 arcsec. The V–[12] colours indicate that 6 of these are early-type stars. The remaining 8 stars (including IRAS 02091+6333) have the colours of RGB or AGB stars: the density of such stars in this field is 1 per 1400 square arcminutes (we note that the association of IRAS 02091+6333 is, at 1.6 arcsec, the closest of the 14 sources.)
Using the apparent offset of 1.5′, the chance that the central star and ring are unrelated is 0.5%: the association is significant at the 3 level. Even without the presence of an optical star, the significance of an association between the ring and the central IRAS source would be close to 3. A relation between the ring and its bright central AGB or RGB star is therefore plausible.
One should however also take into account how common such rings are in the IRAS images. This close to the Galactic plane, the background emission is extensive and structured. But within a field of , there is no other ring-like structure: the background emission shows elongated ridge-like structures instead. The difference between these structures and the ring is shown by the fact that most of the IRAS PSC sources in this region correspond to parts of the ridges, tracing brightness fluctuations which are common features of these structures. In contrast, the ring is quite smooth and was not picked up as one or more point sources.
Although confusion can not be fully ruled out, a physical association between star and ring appears plausible.
3 Results
3.1 The Star
For an M4III or M3III star, or respectively (Wainscoat et al., 1992). The observed , gives an extinction or , for an M3III star. The dereddened V colour of 4.9 indicates an M3 rather than M4 star, with (e.g Wainscoat et al. 1992) for which we find a distance of pc. This extinction and distance are not unreasonable if compared to nearby stars of known spectral type, luminosity class and with reliable photometry: within a radius of 40 four such stars were found in SIMBAD: two are about pc distant and have an of 0.15 and 0.30, respectively, and the other two are about 1 kpc away and have values of 0.59 and 0.43, respectively. Some of the extinction towards the central star may be circumstellar. We note that the W3–5 complex, located only 2 degrees away in the Perseus arm, is at a distance of 2.35 kpc (e.g. Heyer & Tereby 1998). If an extinction sheet is associated with this spiral arm, IRAS 02091+6333 is likely located in front of it. The OB association Cam OB1 is found a few degrees away at 900 pc (de Zeeuw et al., 1999).
The likely distance suggests that the M3 star is of luminosity class III rather than I. Furthermore, its circumstellar obscuration cannot be very large. The IRAS PSC flux densities and the V–[12] colour are consistent with photospheric emission from an M3 star: there is no evidence for hot circumstellar dust, and the present mass-loss rate must be small. The MSX flux densities (Table 1) agree with IRAS but the 14 micron point seems a little higher, a difference that may be caused by the larger beam width of MSX, which was a smaller telescope.
Evidence for mass loss (the detached shell), generally indicates a thermal-pulsing, variable AGB star. Jura (1999) shows that some RGB stars also show dust emission, but only close to the star. But there is no strong evidence for variability of the M3III star. The 228 TYCHO measurements include some fainter ones, but the magnitude is close to the limiting magnitude of the instrument and the catalog does not flag the star as variable. A comparison of its brightness in a POSS I overlapping region (plates E/O 597, taken on 1952-09-15/16, and E/O 878, taken on 1953-10-30/31) also does not show any obvious variability. Monitoring by Roger Pickard between January 2000 and January 2001 indicates a possible brightening at V from 10.5 to 10.1, and from 12.5 to 11.7 at B, but this requires further confirmation.
The bolometric magnitude is estimated as , based on the BC(V) of Flower (1996). This is very uncertain as the bolometric correction is a steep function of colour. The corresponding luminosity is, given the uncertainty, consistent with a TP-AGB star (e.g. Weidemann & Schönberner 1990). Low-level variability would be consistent with a pre-Mira evolutionary stage. But the data does not rule out a location near the tip of the RGB; neither can a TP-AGB star during the helium-burning phase of the TP cycle be ruled out, when luminosity and the mass-loss rate are reduced.
3.2 The Shell
The fact that part of the shell is seen in absorption gives an indication of its mass. We use the conversion ratio . The absorption region is roughly . This gives a total mass of for mag. This estimate is by necessity rough, since the extinction is estimated and the size of the region has significant uncertainties.
The IRAS flux (70 Jy at 100 m) gives a second determination of the mass of the shell. Using a black-body dust temperature of 35 K, we derive a total dust mass of , where is the distance in kpc (Tokunaga, 2000). For a distance of pc and a gas-to-dust mass ratio of 200, the total mass in the ring is M⊙. Most of this mass will be in the brighter southern region. The agreement between the two estimates is deceptive, since the uncertainties in these calculates are easily a factor of 2. However, it indicates a relation between the absorption region and the ring.
3.3 Shell Origin
In general, distant shells around AGB stars have been interpreted in terms of episodically enhanced mass loss, related to the thermal-pulse cycle (Zijlstra et al., 1992; Izumiura et al., 1997). Assuming an expansion velocity of 10 km/s, the outermost gas in the shell would have been ejected yr ago, and the gas closest to the star yr ago. The duration of the mass-loss event would not be inconsistent with the duration of the thermal-pulse cycle (Vassiliadis & Wood, 1993). However, this would require an equally long time of quiescence to explain the cavity, whilst the duration of the low-luminosity part of the cycle, during helium burning, is only 10–15 per cent of the cycle.
The relatively large mass of the shell suggests that much of the the gas does not originate from the star. Given the uncertainties in distance, integrated IRAS flux density, and temperature, the mass could be as low as 1 M⊙ in which case a significant contribution from stellar mass loss could not be excluded.
4 The Wall
4.1 AGB–ISM Interaction
In view of these two points, we suggest that the shell reflects ISM sweep-up. In this model, the AGB wind, moving out at into the ISM, is creating a a denser shell consisting of both components. Models for the early phases of such sweep-up have been calculated by Young et al. (1993). The typical cooling time for the post-shock region is , with density increasing to , reducing as the front slows down (Spitzer, 1978). The interaction region can thus be considered momentum-driven, in agreement with Young et al. (1993). The velocity of the interface declines as or , until its velocity drops below the sound speed in the ISM outside the shell. Young et al. (1993) do not consider cases where the amount of matter swept up from the ISM exceeds the mass contributed by the stellar wind. The large mass of the present shell suggests the present shell has evolved past this phase.

Using the measured diameter of the shell, and assuming its mass reflects the ISM, suggests a local ISM density (outside of the shell) of a few particles cm-3. Fig. 2 shows the early development of the wall. In this case, the velocity of the interface (the ’wall’) drops to 1 km s-1 after about . The early phase ends once the thermal pressure of the ambient ISM becomes non-negligible, causing the interface to stall. This happens once
| (1) |
For the ambient pressure, we use a typical value of . Assuming that the interface has stalled at a distance of 2 pc from the star (the present radius of the shell), the equation above yields a mass-loss rate . This value is typical for semi-regular variables, which have not yet evolved into Mira variables, and is sufficiently low that the 12-m emission would still be dominated by the photosphere. Much of the stellar envelope mass on the AGB may be lost in such a moderate wind before the onset of the Mira phase (the narrow relation for short-period Miras (Glass & Lloyd-Evans, 1981; Feast et al., 1989) suggests that their masses are already reduced to close to the final white dwarf mass before the Mira phase begins). IRAS 02091+6333 could have built a hydrogen wall during its pre-Mira evolutionary phase, before reaching the mass-loss rates associated with the tip of the AGB.
However, the resulting shell will not be stable: once the interface becomes trapped, the swept-up shell begins to expand into the ambient ISM at its sound speed. Using a typical value of the sound speed of , the ring reaches a thickness of 1 pc in . As a rough estimate, we may assume that the shell ceases to be observable once its density has dropped to twice that of te surrounding (presumably uniform) medium. For a thin shell:
| (2) |
which gives
| (3) |
The observed thickness of the ring is roughly 1 pc, but this is affected by the IRAS 10-m resolution and the actual thickness is probably rather less. Within the limited accuracy, we find agreement between the possible parameters of such a wall and the observed ring of IRAS 02091+6333.
This suggests that it is possible to create such a wall even before the Mira phase on the AGB, and that the wall could survive for an appreciable fraction of the thermal-pulsing AGB (). At a constant mass-loss rate, the interface will stall in less than after the onset of the mass loss. However, the mass loss likely slowly increases over time, effectively resetting the clock and re-creating the shell. The resulting shell may be seen for up to following an increase in mass-loss rate. The precise value depends on ambient density and mass-loss rate.
The limited life time of the ring indicates it cannot pre-date the present evolutionary phase of the star. We therefore suggest that IRAS 02091+6333 presents a case where an AGB star, having undergone mass loss, perhaps intermittently over some fraction of its AGB life time, has surrounded itself with a swept-up wall of dust and hydrogen more than 1 pc away.
4.2 Morphology
Two aspects of the wall need further consideration: first, it is roughly (but not perfectly) spherical; second, its intensity is strongest towards and away from the Galactic plane.
The morphology, in the model of the previous subsection, will be determined by the intrinsic distribution of the stellar wind and by the structure of the ISM. The ISM shows structure on many size scales, however the shell is small compared to its large-scale structure. If the shell is running into a region of higher density, this is most likely to have occured near its outer edge as this is the region contributing most to the volume. This would affect the intensity distribution, but would be less likely to cause large deviations from spherical symmetry.
Stellar winds on the AGB tend to be symmetric, until the star approaches the tip of the AGB (e.g. Zijlstra et al. 2001). However, the effects of the peculiar motion of the star with respect to the ISM should be considered. The proper motion indicates a velocity of 45 km s-1. About half of this is due to the effect of the solar motion and galactic rotation; the remaining velocity vector has a large uncertainty. The proper motion of the ISM is also not easily measured, but considerable deviations from circular rotation may occur in both the young stellar population and the ISM (e.g. Anantharamaiah et al. 1984; Merchán Benítez & Jurado Vargas 2000). A recent study of proper-motion vectors of stars in the CAM OB1 association (de Zeeuw et al., 1999), at a distance of 900 pc and at , shows a number of distant OB-type stars with similar proper motion vectors to IRAS02091+6333. The relative velocity between star and ISM is therefore not well determined. To first order, the effect of stellar motion is to change the wind velocity with respect to the ISM. The stalling radius depends on the square root of this velocity, and thus the shape of the shell is relative insensitive to small peculiar velocities. But at velocities much larger than 10 km s-1, the effects become large and the star may position itself off-centre over the life time of the shell.
Supernova remnants often show a bilateral structure very similar to that of IRAS 02091+633 and these structures are generally oriented in the same way with respect to the Galactic plane (Gaensler, 1998). The explanation is believed to be shaping by the Galactic magnetic field, which tends to run along the plane. The shaping can either occur directly by the magnetic field, or indirectly if the ISM is stratified by the field. However, for nebulae as small as our ring these effects are expected to be negligible. The similarity is likely accidental. Planetary nebulae do not show a preferential alignement with respect to the Galactic plane (Corradi et al., 1998).
4.3 The Future
Assuming that the wall around IRAS 02091+6333 is due to AGB–ISM interaction, the question arises how this structure will evolve. The interface between the wind and the ISM will have stalled and the inner edge of the wall can be considered stationary. The outer edge is expanding at the velocity of sound, km s-1. The thermal-pulsing AGB lasts several yr, allowing this edge to travel several parsec, beyond the phase of observability. Once the star enters the post-AGB phase, stellar evolution speeds up dramatically and the wall will evolve much slower than the inner nebula and its star.
After the AGB, the circumstellar wind quickly becomes ionized as the star heats up. At the same time a hot, much faster stellar wind sweeps up the inner AGB wind, with the swept-up region forming (part of) a planetary nebula, with a typical radius of 0.1–0.5 pc (Frank & Mellema, 1994). The planetary nebula phase may last yr (Zijlstra & Pottasch, 1991). In our model, this swept-up shell is itself embedded in the much larger wall. Outer rims and haloes are seen in some planetary nebulae but they do not have a unique explanation (Corradi et al., 2000) and their presence cannot be taken as a vindication of this scenario.
In IRAS 02091+6333 the wall is visible as an IRAS shell. Once the expansion dilutes the wall, this shell becomes less and less distinct. However, inside the wall is still a region where the density is much lower, in which the AGB wind keeps the surrounding medium at bay. Thus, instead of a shell, one can expect the appearance of an infrared cavity in which the planetary nebula may be located.
Such a cavity has been found around the old nova CK Vul (Evans et al., 2002). These authors classify CK Vul as a late-thermal-pulse nova, similar to nova Sakurai. In this case, the nova is expected to be located inside an old planetary nebula. (A hydrogen nebulosity has been found around CK Vul but has (sofar) not been indentified as an old planetary nebula). The cavity has a radius of approximately 1 pc. We suggest that this object may be an example of an old wall. The presence of other, very large cavities around planetary nebulae will be the topic of a future paper.
5 Summary
We present the discovery of a large dust shell with a detached appearance, surrounding a previously unknown but bright AGB star. An association between the star and the dust shell is likely, given the statistics of confusion in this region. The spectral type of the star, magnitude and colour, is used to derive the extinction, and a distance of . The gas mass of the shell is estimated as .
The large mass and size of the shell make an origin in a thermal pulse, as normally assumed for detached shells around AGB stars, unlikely. Instead we propose a model in which an AGB wind of low mass-loss rate has swept out a cavity in the ISM; the swept-up material forms the present shell. We show a typical calculation in which the snowplough phase lasts for rm. At the end of this phase, the shell is subsonic, stalls and begins to expand into ISM at its sound speed. In our model, the shell remains visible for a further yr. After this, the shell would be visible as an apparent hole in the ISM surrounding the central AGB star, or the later planetary nebula wich follows the AGB evolutionary phase.
A star with a similar size dust shell is R CrB (Gillet et al., 1986), where a huge nearly symmetrical dust shell has been discovered. This shell may have a similar origin. Hydrogen walls are also known around the Sun and nearby stars, from the interaction between the solar wind and the ISM (e.g. Ben-Jaffel et al. 2000): they are a common feature of star–ISM interactions.
The interaction between an AGB wind and its surrounding ISM has largely been ignored in the analysis of circumstellar environments, with the exception of Young et al. (1993). The shell of IRAS 02091+6333 suggests that the effects of such an interaction should be further explored.
Acknowledgments
We are very grateful to Roger Pickard who provided us with the results of his photometric runs of the central star of the dust shell and to Maurice Gravin for spectroscopy. Special thanks also go to Sonia Temporin, Gernot Grömer, Ernst Dorfi and Stefan Kimeswenger. Fernando Comeron took time to explain to us the various aspects of low-velocity hydrodynamics. This research has made use of the VizieR and SIMBAD databases, maintained by the CDS, of the IPAC on-line IRAS and MSX databases, and of the IRAS Software Telescope system maintained by SRON, Groningen.
References
- Lindqvist et al. (1999) Lindqvist M., Olofsson H., Lucas R., Schöier F. L., Neri R., Bujarrabal V., Kahane C., 1999, A&A, 351, L1
- Anantharamaiah et al. (1984) Anantharamaiah K. R., Radhakrishnan V., Shaver P. A., 1984, A&A, 138, 131
- Assendorp et al. (1995) Assendorp R., Bontekoe T. R., de Jonge A. R. W., Kester D., Roelfsema P. R., Wesselius P. R., 1995, A&AS, 110, 395
- Ben-Jaffel et al. (2000) Ben-Jaffel L., Puyoo O., Ratkiewicz X., 2000, ApJ, 553, 924
- Boulanger et al. (2001) Boulanger F., Bernard J.-P., Lagache G., Stepnik B., 2001, in Hauser M. H. . M., ed., IAU Symposium 204: The extragalctic infrared background and its cosmological implications Studies of Mira and semiregular variables using visual databases. p. 47
- Corradi et al. (1998) Corradi R. L. M., Aznar R., Mampaso A., 1998, MNRAS, 297, 617
- Corradi et al. (2000) Corradi R. L. M., Schönberner D., Steffen M., Perinotto M., 2000, A&A, 354, 1071
- de Zeeuw et al. (1999) de Zeeuw T. P., R. H., de Bruijne J. H., Browne A. G. A., Blaauw A., 1999, AJ, 117, 354
- Evans et al. (2002) Evans A., van Loon J. T., Zijlstra A. A., Pollacco D., Smalley B., Tyne V. H., Eyres S. P. S., 2002, in preparation
- Feast et al. (1989) Feast M. W., Glass I. S., Whitelock P. A., Catchpole R. M., 1989, MNRAS, 241, 375
- Flower (1996) Flower P. J., 1996, ApJ, 469, 365
- Frank & Mellema (1994) Frank A., Mellema G., 1994, ApJ, 430, 800
- Gaensler (1998) Gaensler B. M., 1998, ApJ, 493, 781+
- Gillet et al. (1986) Gillet F. C., Backman D. E., Beichman C., Neugebauer G., 1986, ApJ, 310, 842
- Glass & Lloyd-Evans (1981) Glass I., Lloyd-Evans T., 1981, Nature, 291, 303
- Hashimoto et al. (1998) Hashimoto O., Izumiura H., Kester D. J. M., Bontekoe T. R., 1998, A&A, 329, 213
- Heyer & Tereby (1998) Heyer M. H., Tereby S., 1998, ApJ, 502, 265
- Iveciz & Elitzur (1995) Iveciz Z., Elitzur M., 1995, ApJ, 445, 415
- Izumiura et al. (1997) Izumiura H., Waters L. B. F. M., de Jong T., Loup C., Bontekoe T. R., Kester D., 1997, A&A, 323, 499
- Jura (1999) Jura M., 1999, ApJ, 515, 706
- Merchán Benítez & Jurado Vargas (2000) Merchán Benítez P., Jurado Vargas M., 2000, A&A, 353, 264
- Olofsson et al. (1998) Olofsson H., Bergman P., R. L., Eriksson K., Gustafsson B., Bieging J. H., 1998, A&A, 330, L1
- Olofsson et al. (2000) Olofsson H., Bergman P., R. L., Eriksson K., Gustafsson B., Bieging J. H., 2000, A&A, 353, 583
- Speck et al. (2000) Speck A. K., Meixner M., Knapp G. R., 2000, ApJ, 545, L145
- Spitzer (1978) Spitzer L., 1978, Physical Processes in the Interstellar Medium. Wiley & Sons
- Tokunaga (2000) Tokunaga A. T., 2000, in Astrophysical Quantities . p. 143
- Vassiliadis & Wood (1993) Vassiliadis E., Wood P. R., 1993, ApJ, 413, 641
- Wainscoat et al. (1992) Wainscoat R., Cohen M., Volk K., Walker H. J., Schwartz D., 1992, ApJS, 83, 111
- Weidemann & Schönberner (1990) Weidemann V., Schönberner D., 1990, in From Miras to Planetary Nebulae: Which Path for Stellar Evolution? (Eds. M.O. Mennessier and A. Omont) Editions Frontieres, Gif sur Yvette. p. 3
- Willems & de Jong (1986) Willems F., de Jong T., 1986, ApJ, 309, L39
- Wood (1990) Wood P. R., 1990, in From Miras to Planetary Nebulae: Which Path for Stellar Evolution? (Eds. M.O. Mennessier and A. Omont) Editions Fontieres, Gif sur Yvette. pp 67–84
- Young et al. (1993) Young K., Phillips T. G., Knapp G. R., 1993, ApJ, 409, 725
- Zijlstra & Bedding (2002) Zijlstra A. A., Bedding T. R., 2002, MNRAS, accepted for publication
- Zijlstra et al. (2001) Zijlstra A. A., Chapman J. M., te Lintel Hekkert P., Likkel L., Comeron F., Norris R. P., Molster F. J., Cohen R. J., 2001, MNRAS, 322, 280
- Zijlstra et al. (1992) Zijlstra A. A., Loup C., Waters L. B. F. M., de Jong T., 1992, A&A, 265, L5
- Zijlstra & Pottasch (1991) Zijlstra A. A., Pottasch S. R., 1991, A&A, 243, 478