Spectroscopic detection of quasars in the 2dF Galaxy Redshift Survey
Abstract
The 100,000 spectra from the 2 degree Field Galaxy Redshift Survey (2dFGRS) in the 100k Public Data Release represent the largest single compilation of galaxy spectra available. By virtue of its sheer size and the properties of the photometric catalogue that defines the sample, the 2dFGRS is expected to contain a number of potentially interesting objects other than galaxies. A search of the spectra in the 100k Data Release results in a census of 55 candidate high-redshift () quasars. One additional 2dFGRS spectrum of a low-redshift galaxy shows an apparent anomalous broad emission feature perhaps indicating the presence of a gravitationally lensed quasar. These objects have been identified primarily using two automated routines that we have developed specifically for this task, one of which uses a matched filter and the other a wavelet transform. A number of the quasar images possess complicated morphologies, suggesting the presence of either diffuse foreground objects along the line–of–sight or very nearby point sources. The quasar catalogue will form a target list for future absorption and lensing studies, as well as providing an assessment of the loss of quasars with non-stellar images from the companion 2dF QSO Redshift Survey.
keywords:
methods: data analysis – techniques: spectroscopic – surveys – quasars: emission lines1 Introduction
Very large surveys are playing an increasingly important role in the progress of observational astronomy, with all-sky photometric and spectroscopic data–sets particularly prominent. The most advanced surveys in the latter category are the 2dF Galaxy Redshift Survey (2dFGRS; Colless et al. 2001) and the Sloan Digital Sky Survey (SDSS; York et al. 2000), both of which already include well over spectra. A feature of many of the most ambitious surveys is the incorporation of the rapid release of survey data to the astronomical community, together with user-friendly tools and interfaces that allow exploitation of this resource. Indeed the 2dFGRS’s release of spectra111http://www.mso.anu.edu.au/2dFGRS/ is the largest catalogue of galaxy spectra available.
The 2dFGRS 100k Data Release has already formed the basis for investigations key to the primary goals of the survey, including constraints on the luminosity function of local galaxies (Sadler et al. 2001; Magliocchetti et al. 2002; Madgwick et al. 2002) and their correlation properties (Peacock et al. 2001; Percival et al. 2002; Norberg et al. 2001), as well as studies of the local cluster population (de Propris et al. 2001). Comparable results have also been obtained from the SDSS (e.g. Blanton et al. 2001; Connolly et al. 2002).
An additional benefit of these large databases is the presence of new and unusual objects, albeit in small numbers. The SDSS has already discovered several unusual dwarf stars (Strauss et al. 1999; Harris et al. 2001) and a large proportion of the highest-redshift quasars now known (Fan et al. 2001). The morphological selection involved in the definition of the 2dFGRS targets reduces the heterogeneity of the constituent object populations compared to the SDSS but the 100k Data Release should still include a variety of interesting objects.
In this paper we focus on the population of broad line quasars and active galactic nuclei (AGN) with redshifts essentially beyond the limit of the number–redshift selection function for the normal galaxies that dominate the sample. Such a census of quasars and AGN with redshifts has a number of applications. Firstly, many of the quasars with redshifts in the 2dFGRS will lie close in projection to lower redshift galaxies – the ‘composite’ quasar plus galaxy image having been classified as non-stellar. These quasar–galaxy pairs provide the opportunity to probe the physical conditions in the interstellar medium of the galaxies via absorption line studies of the background quasars. A smaller fraction of quasars, concentrated particularly at lower redshifts, , will show evidence for the presence of host galaxies. The sub-sample of such objects will include quasars with some of the most luminous hosts known. Secondly, a few objects may represent new examples of strong gravitational lensing, adding to the still very small number of multiply imaged quasars known. Finally, as the companion 2dF QSO Redshift Survey (2QZ; e.g. Croom et al. 2001) photometric catalogue deliberately includes only unresolved sources, the frequency and properties of quasars present in the 2dFGRS provides information relating to the completeness of the 2QZ as a function of image morphology and redshift.
Following a brief description of the 2dFGRS data (Section 2) the search methods employed are detailed in Section 3. Issues related to candidate selection are discussed in Section 4 and the resultant object catalogue is presented in Section 5, together with comments on individual objects. The paper concludes with a brief discussion of the potential uses of the quasar sample in Sections 6 and 7.
2 The 2dFGRS
The 2dFGRS is, formally, a spectroscopic survey of apparently non-stellar objects to an isophotal magnitude limit of . Our search for quasars and broad line AGN is confined to the first subset of spectra made publicly available as the 100k Data Release (Colless et al. 2001).
The 2dFGRS spectra are obtained using the 2dF instrument on the Anglo-Australian Telescope (AAT) and represent -minute integrations through fibres with an angular diameter on the sky of arcsec (see Lewis et al., 2002). The wavelength coverage extends from approximately Å to Å. Strong night-sky emission lines, notably O i 5577Å, Na i 5890Å and O i 6300Å, effectively produce Å-wide gaps in the spectra of all except the brightest objects. The nominal signal–to–noise (S/N) ratio for a continuum-dominated object at the survey limit is per 10Å bin, although many of the spectra are of significantly lower quality.
The majority of the targets are local galaxies, with an average redshift of , although there is a per cent ‘contamination’ by Galactic stars. Morphological classification of the photometric input catalogue was taken from the Automatic Plate Measuring (APM) survey (Maddox et al. 1990) of United Kingdom Schmidt Telescope (UKST) photographic plates. The star–galaxy separation algorithm, described in detail by Maddox et al. (1990), is highly effective when applied to isolated images, and able to select galaxies with an efficiency (i.e. the fraction of selected objects which are galaxies) of per cent. Classification of ‘composite’ images, where the isophotal boundaries of two or more images overlap and the APM parameterises the resulting composite image, present a more difficult problem given the limited number of moment-based parameters provided by the APM to describe each image. For objects with magnitudes within the range included in the 2dFGRS essentially all close pairs of objects with angular separations arcsec (depending on the quality of the plate material) are detected as composite images. The majority of such images have been eliminated from the 2dFGRS spectroscopic target catalogue through a selection according to image classification parameter and direct visual inspection (Colless et al. 2001; Section 5.4). However, a small fraction of star–galaxy and even star–star pairs are included in the 2dFGRS target list and such objects are responsible for the bulk of the contamination by Galactic stars.
The population of unresolved quasars and AGN is subject to exactly the same image blending that can occur with Galactic stars, but the surface density on the sky is much smaller and hence the predicted frequency in the 2dFGRS survey correspondingly lower. Nonetheless, adopting a surface density of deg-2 for quasars with magnitudes , simple geometric arguments predict that the 2dFGRS 100k Data Release should contain several tens of quasars.
3 Search Methodologies
Our search strategy involved a combination of visual inspection (Section 3.1), confined to the most extreme objects in the 100k Data Release, and the application of two automated routines (Sections 3.2 and 3.3). The combined results are presented in Section 4.
3.1 Visual inspection
Our starting point involved a simple query of the Data Release, selecting all objects with heliocentric redshifts . All 422 spectra satisfying the constraint were inspected visually to identify objects with evidence of broad emission lines.
3.2 Matched filter-based search
The first of our automated routines adopts a ‘conventional’ approach to filtering the spectra before applying a matched filter detection procedure. A mask was defined to exclude pixels with wavelengths within the intervals –Å, –Å, –Å, –Å, –Å, –Å, –Å and –Å. These regions are dominated by either residual sky-subtraction errors in the vicinity of strong night-sky emission lines, e.g. O i 5577, NaD 5890, or suffer from strong absorption within the atmosphere or the 2dF fibres themselves. Pixels within Å of the nominal start and end wavelengths of the spectra were also excluded to avoid a number of artifacts arising from the data reduction or the instrument.
A median filter with a box-length of 201 pixels (Å) was then applied to the spectra. The resulting ‘continuum’ spectra retain any discontinuities present in the original spectra, e.g. the Å-break in many of the galaxies, but the presence of absorption and emission features with widths Å is greatly reduced. The continuum spectra were then subtracted from the original spectra to produce ‘difference’ spectra. Further discussion and examples of the effect of median filters applied to low-resolution astronomical spectra can be found in Hewett et al. (1985).
The ‘matched filter’ was derived from the Francis et al. (1991) composite quasar spectrum, extended using additional data to Å. A low-order spline fit to the quasar continuum was subtracted from the composite spectrum to leave a residual spectrum dominated by prominent broad emission lines.
For each difference spectrum the template was redshifted and interpolated onto the same wavelength array. The template was then multiplied by an approximation to the wavelength-dependent sensitivity of the 2dFGRS observations. A variance array is provided for each 2dFGRS spectrum in the 100k Data Release and a straightforward cross–correlation between the difference spectrum and template spectrum was then performed to give a signal–to–noise ratio (Hewett et al. 1985; Equation 3). The template was incremented by and the search performed over the redshift range . The associated scale factor for the template spectrum is readily calculated to give the amplitude of the signal (Equation 2 of Hewett et al. 1985). A goodness–of–fit estimate was calculated from the fractional reduction in between the difference spectrum alone and the difference spectrum after the subtraction of the scaled template. Thus, for each spectrum, ‘detections’, above some specified S/N-threshold, together with associated goodness–of–fit measures and redshifts are generated.
3.3 Wavelet search
In addition to the matched filter search we have also conducted an automated search of the spectra using a wavelet transform-based routine.
The distinguishing feature of quasars in spectra of low S/N ratio is the presence of broad emission lines. Wavelet transforms allow the separation of a spectrum into different (Fourier) frequency domains whilst preserving the spatial information (i.e. the emission line positions). This allows us to easily separate out broad from narrow features in each spectrum and hence make the identification of quasar emission signals more straight-forward. The key is the use of a localised filter kernel, the width of which varies according to the resolution being sampled. This contrasts with a conventional Fourier transform where the filter kernel is not localised and the spatial information is obscured during the transformation.
There are a variety of different implementations of the wavelet transform (e.g. Mallat 1998), each of which has its own particular benefits. For the analysis of the 2dFGRS the trous (‘with holes’) algorithm (Starck, Siebenmorgen & Gredel 1997 and references therein) was used because it has a particularly simple inverse, making the transformed spectra easy to interpret.
Using this transformation yields a set of different resolution domains for any given spectrum. An example of this is shown for a 2dF spectrum in Fig. 1. The kernel we have employed is a normalised Gaussian sampled at five equally spaced points. This process can be carried on for any number of steps . In the case of the 2dFGRS galaxy spectra we find that there is no additional emission information left after about 7 or 8 steps.

3.3.1 Detection
As illustrated in Fig. 1, the effect of the wavelet transform is to localise the broad emission line signature of any quasar in the low-resolution domains, which are free from most of the pixel–to–pixel noise and any spurious high frequency features that may be present.
Quasars can now be identified by cross-correlating these low-frequency resolution domains with the corresponding domains of the transformed quasar template. This process is carried out in a similar fashion to the matched filter method, but with a few minor modifications.
Empirically, the most effective resolution domains to sample for quasar lines are , and . Because the wavelet transform of the quasar template is performed before redshifting, the width of the quasar features in a given resolution domain will increase with increasing redshift, introducing a bias against detecting the more distant quasars. For this reason two sets of cross-correlations were performed. In the first, domains and of the 2dF spectrum were cross-correlated with and of the quasar template (to detect low- objects). In the second, domains and of the 2dF spectrum were cross-correlated with and of the quasar template (to detect high- objects). The combined cross-correlation is then the sum of the four individual cross-correlations.
The goodness–of–fit for any quasar identifications is then determined as described for the matched–filter search.
4 Identification of high-redshift objects
4.1 Visual inspection
The 2dFGRS redshift-assignment for spectra in the survey has been undertaken using techniques that are highly effective for galaxies with absorption line or emission line spectra produced by stellar photospheres and H ii regions. Unsurprisingly, however, objects whose spectra are dominated by broad emission lines and/or possess redshifts are not well suited to redshift determinations using template spectra of normal galaxies. Only 150 of the 422 spectra with have redshift assignments of high confidence (quality = 4 or 5) and it is apparent that a number of the spectra have incorrect redshift assignments. Objects with erroneous redshifts include some spectra of high S/N ratio and some objects with high confidence redshift assignments. The limitations of the 2dFGRS redshift determination procedure are essentially irrelevant to the primary goals of the survey but care should be exercised when utilising this very small number of extreme objects from the 100k Data Release. The sample identified from the visual inspection consisted of 37 quasars and AGN with redshifts .
4.2 Automated searches
Both the automated routines described in the previous section were highly effective in identifying spectra that show broad emission lines. However, the limiting factor for the automated routines is the large number of false-positive detections that arise due to a wide variety of features and artifacts present in the 2dFGRS spectra.
A full description of the properties of the 2dFGRS spectra is beyond the scope of this paper, and the majority of the phenomena that affect a search for rare objects are described in the 2dF instrument on-line documentation222http://www.aao.gov.au/2df/. However, mention of some of the features in the context of searches for quasars is appropriate.
A variety of instrument-related phenomena can result in spurious detections. Prior to August 1999 the second 2dF spectrograph fed an engineering-grade CCD that possessed a significant number of cosmetic defects. The majority of the artifacts not removed during the data reduction procedure involve relatively narrow features and/or sudden discontinuities. The features themselves do not in general provide good mimics for broad emission lines but their presence can on occasion cause the filtering routines to behave unpredictably, resulting in numerous spurious detections. A number of spectra obtained through fibres 39–50 possess an apparent broad emission feature at a wavelength of Å (Fig. 2a). Examples include objects TGN403Z028, TGN420Z090, TGS181Z082, TGS181Z095 and TGS202Z267.
Contamination from light emitting diodes (LEDs), particularly broad features at Å and Å, creates a number of ‘emission’ features in some spectra acquired before about mid-1999. These features are often, quite correctly, identified as candidate lines by the automated routines. In addition a number of fibres are particularly prone to optical ringing which results in a strong modulation of the object spectrum that frequently results in spurious detections. It is believed that the ringing is due to an interference fringing effect resulting from small cracks at the input ends of the optical fibres (Lewis et al.2002). Examples of both LED contamination and optical ringing are shown in Fig. 2(b) and (c).
At low redshifts the very large number of spectra with narrow emission lines, the majority of which result from processes associated with star-formation, produce a large number of false detections (Fig. 2d). The low S/N of the majority of the spectra means that establishing the presence of broad wings to emission lines is not possible. At higher redshifts the difficulty is reduced dramatically as only a small number of star-forming galaxies are bright enough to be included within the 2dFGRS flux-limited sample. Indeed, we identified only 3 objects with narrow emission line spectra and redshifts .
Bright stars can result in very high S/N spectra (Fig. 2e) and filtering techniques that do not incorporate knowledge of stellar spectral energy distributions almost invariably leave apparent broad emission and absorption signatures in the filtered spectra.

The large number of false-positive detections resulting from the range of phenomena described above mean that the automated techniques are limited more by the swamping of the small number of real quasars than by the question of whether a detection at a given significance is real. Following some experimentation, candidates from the wavelet-based search were selected according to a fractional reduction in the goodness–of–fit of , producing 711 objects. The cut-off values adopted for the matched filter-based search were and producing 1277 candidates.
The candidate spectra were then inspected visually to eliminate the spurious detections that constitute the bulk of the candidates. Encouragingly, the automated techniques independently recover the majority of objects identified from the visual inspection of the sample and the majority of candidate quasars are common to all three lists. The combined sample of candidate quasars consists of 55 objects, of which 37, 49 and 47 were identified in the visual, matched filter and wavelet searches respectively.
4.3 Observer Comments
To verify that the combination of visual inspection and the automated search was effective in identifying candidate quasars the ‘observer comments’ (Z_COMM, Colless et al. 2001) were searched for references to possible quasar lines or otherwise unusual spectra. Of 124 such references, 29 were included in our candidate list and visual inspection of the remainder revealed no additional candidates.
5 High-redshift objects in the 100k Data Release
5.1 The Object catalogue
A total of 55 candidate quasars with redshifts were identified using one or more of the three methods described in Section 4. Table 1 provides summary information for these objects. The 2dFGRS name, celestial coordinates and magnitudes are all taken directly from the 100k Data Release. The quasar redshifts, , are derived via cross-correlation of the quasar template (Section 3) with the individual spectra. The probability a candidate represents a quasar is quantified via a simple integer quality flag, :
-
1.
, Possible quasar – spectrum contains only one broad emission feature detected at low S/N (5 objects);
-
2.
, Probable quasar – spectrum contains only one broad emission feature detected at moderate S/N, or spectrum contains two or more broad emission features detected at low S/N (9 objects);
-
3.
, Definite quasar – spectrum contains two or more broad emission features detected at moderate or high S/N (41 objects).
A high degree of confidence can be placed in the candidates with , while candidates with certainly require further spectroscopic observations to clarify the reality of the putatitive broad emission features.
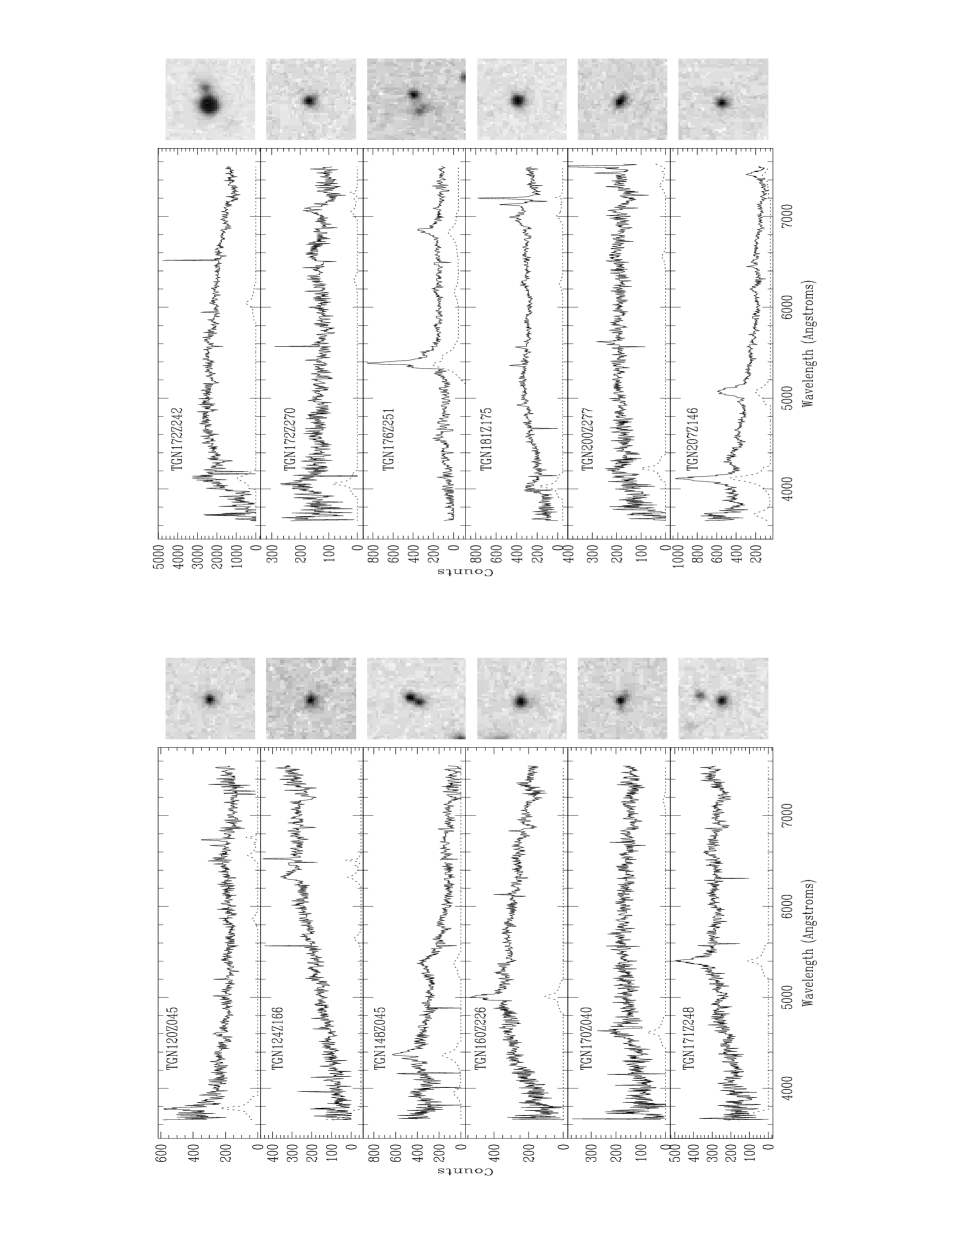
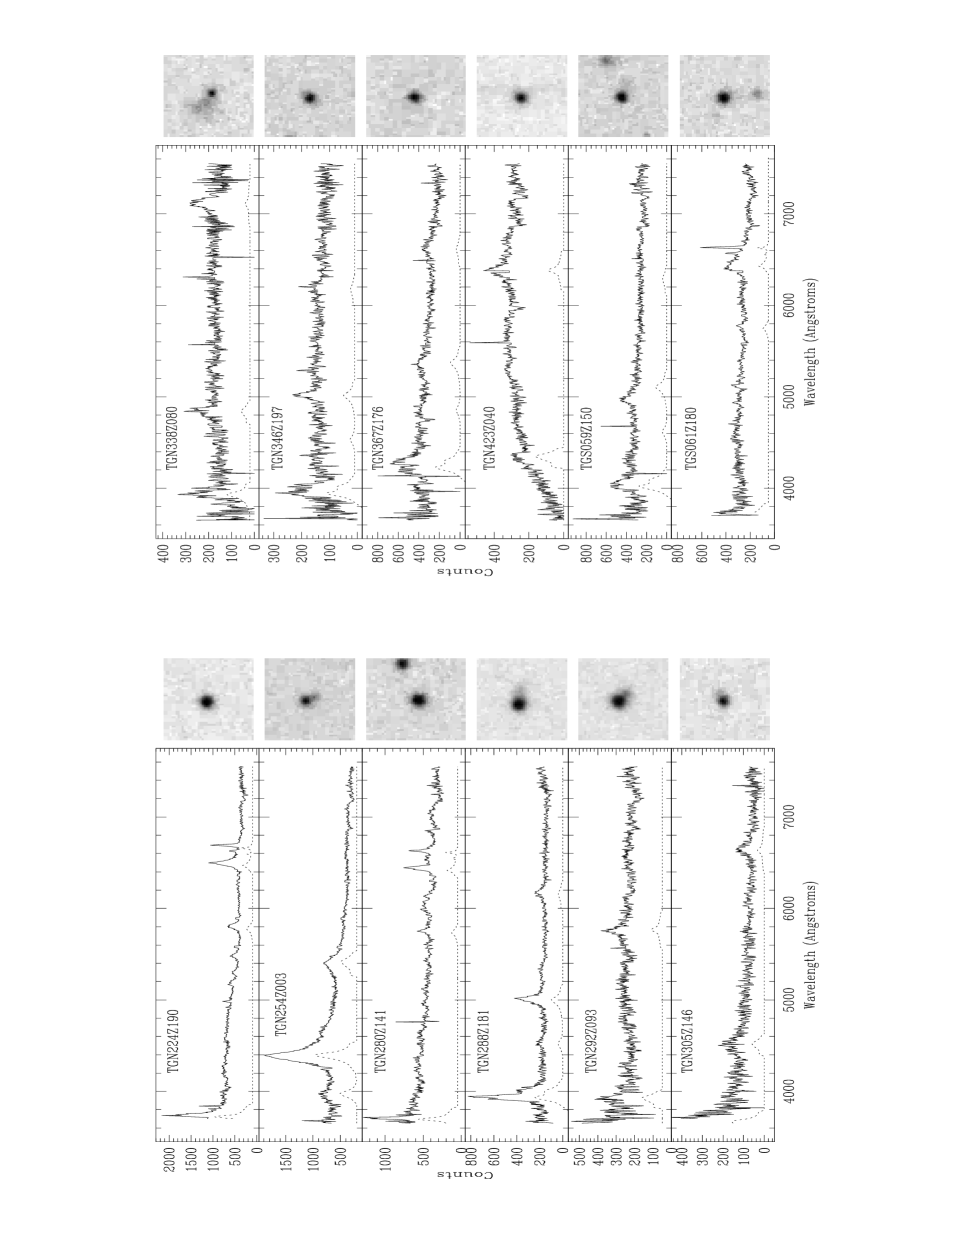
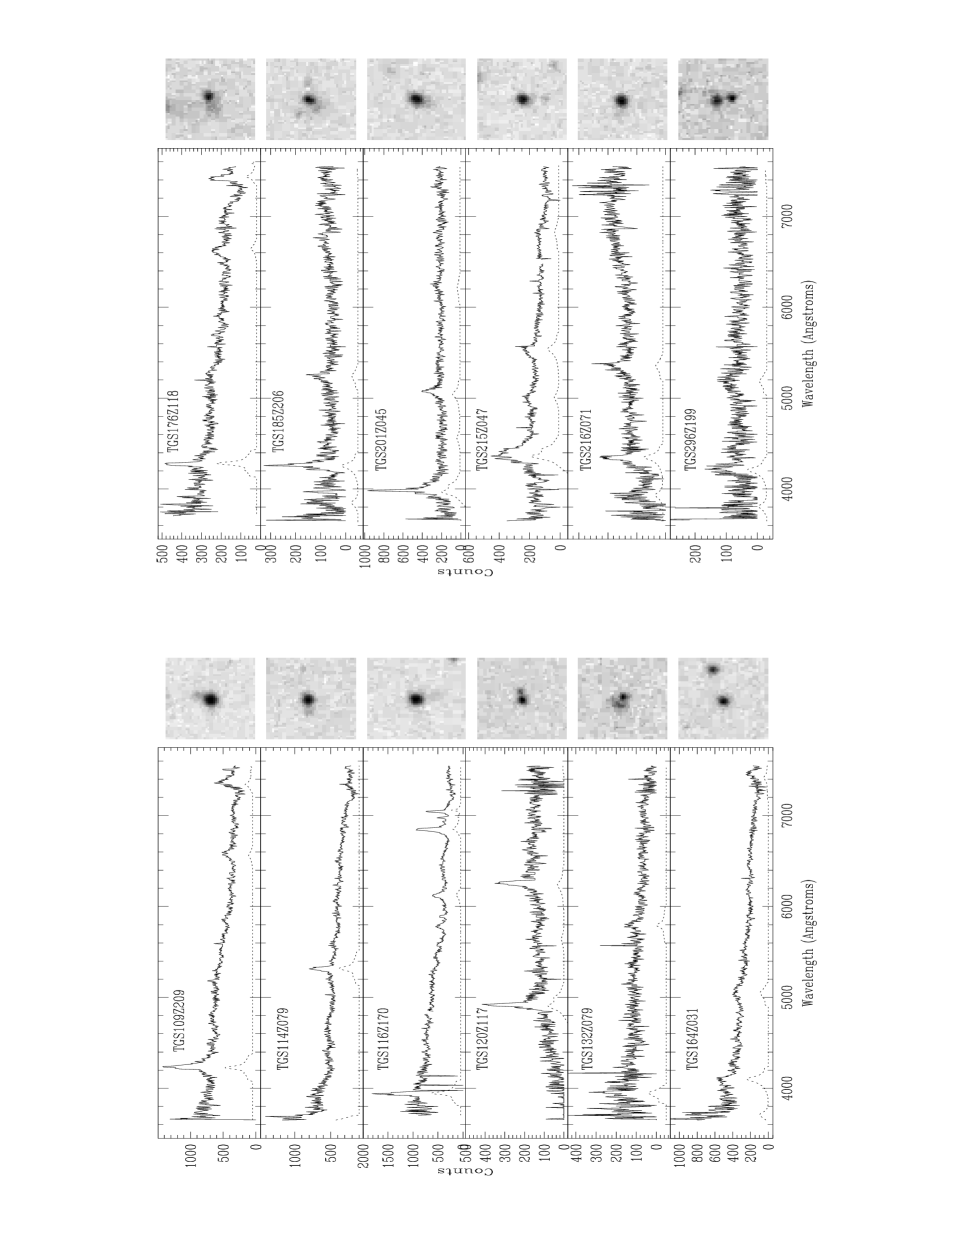
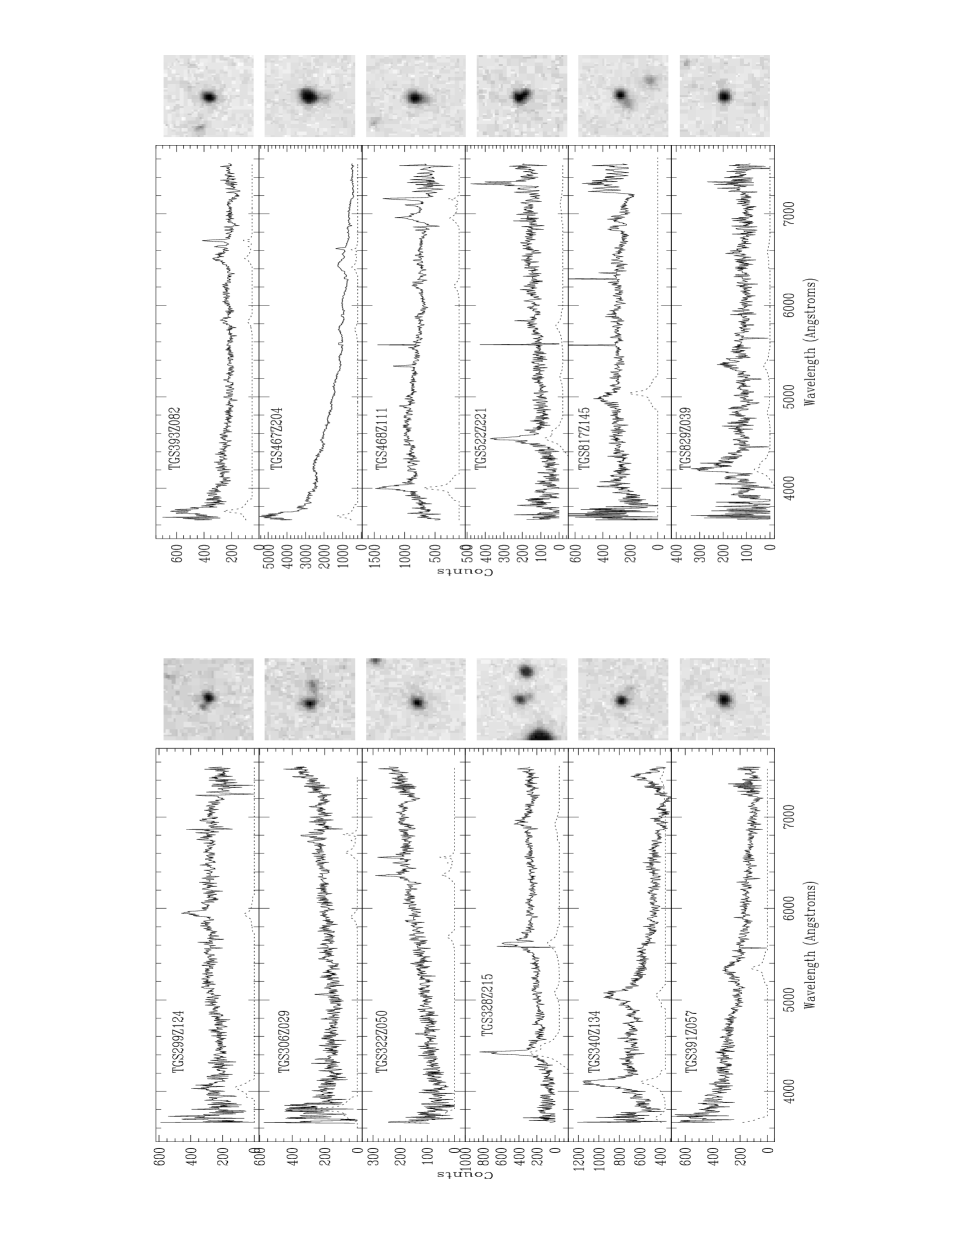
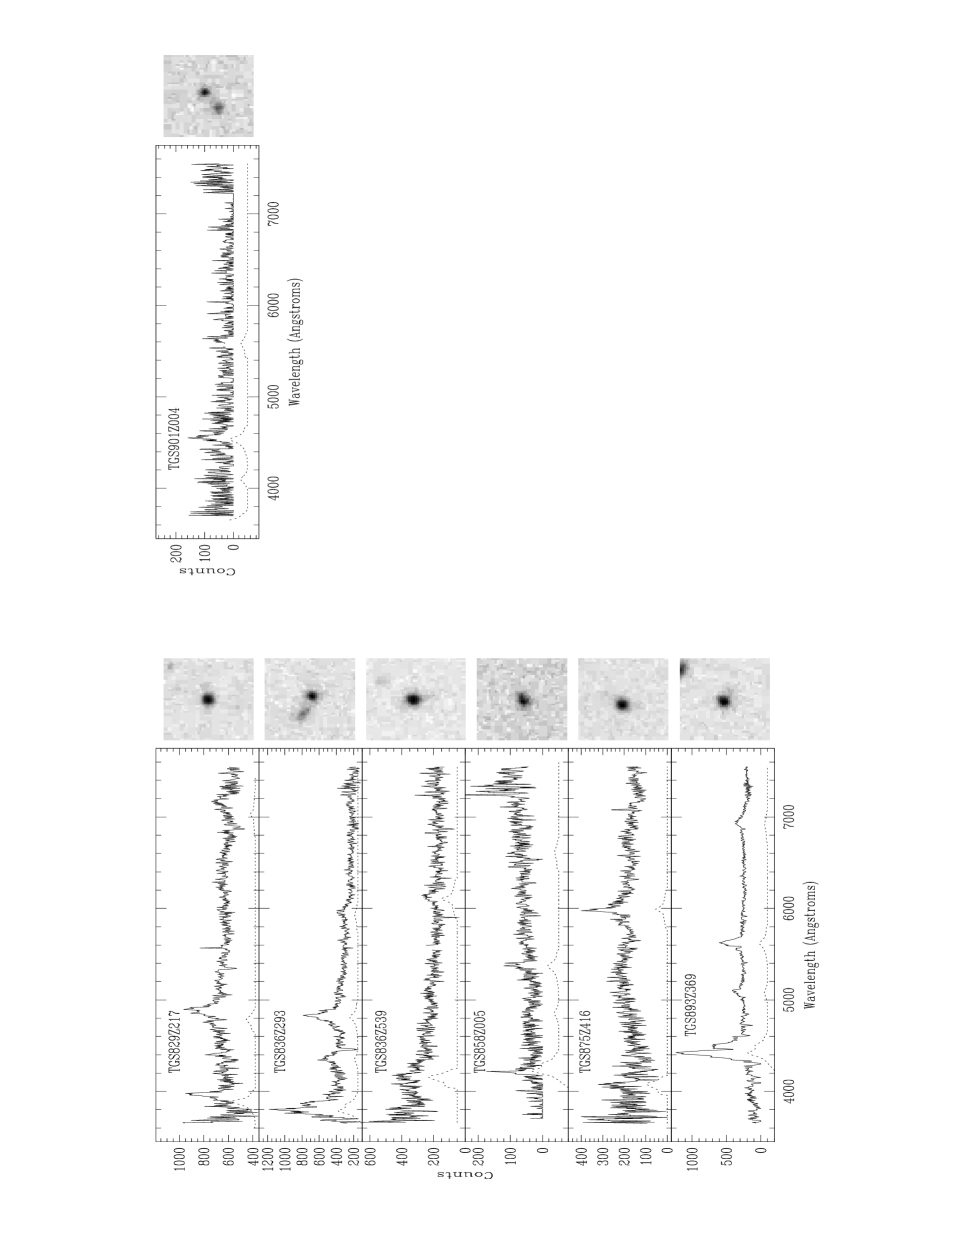
Figure 3 shows the 2dFGRS spectra together with the redshifted quasar template used to make the identification. Interpolation has been performed over strong sky emission lines and a few spurious features masked out. Also shown are arcsec postage stamp images, in conventional astronomical orientation, taken from the SuperCOSMOS Sky Survey (SSS; Hambly et al. 2001) scans of the UKST survey plates. The scale of these postage stamp images is per pixel.
5.2 Corrected magnitudes
The 2dFGRS magnitudes are calculated assuming that the images do not contain unresolved point sources. However, the catalogue of candidate quasars includes objects that are only marginally resolved as well as objects that consist of two or more distinct components, at least one of which is unresolved. An automated scan of a UKST photographic plate shows a tight relation between the integrated brightness and the peak brightness of unresolved images. The relation arises because of the very similar profiles of the unresolved sources and the peak brightness of unresolved images with exceeds that of the majority of galaxies in the 2dFGRS. As a consequence, the peak brightness of marginally resolved or composite images, such as those of the candidate quasars, can be used to estimate the brightness of any unresolved component. The SSS has been used to provide magnitude estimates for the unresolved components present in each of the candidate quasar images. The SSS catalogues were integrated to provide the SuperCOSMOS magnitudes and peak intensities () for all images classified as ‘stellar’ within a arcmin radius of each candidate quasar. A low-order fit to the well-defined vs relation was performed for objects surrounding each candidate and for the candidate quasar, based on the value of , calculated. The resulting values are given in column 5 of Table 1. Seven candidate quasars do not appear in the SSS scans and one object has an value such that saturation effects preclude the calculation of a sensible magnitude.
5.3 Notes on individual objects
-
1.
TGN172Z242: identification based on detection of a broad emission feature at Å which may well be spurious.
-
2.
TGN200Z277: identification based on identification of Å feature as Mg ii 2798. Any H emission would be difficult to detect because of a fibre absorption band affecting wavelengths –Å.
-
3.
TGS306Z029: redshift, based on [O iii] emission lines at Å is secure. Tentative quasar classification relies on detection of broad Mg ii 2798 emission at Å but there is no evidence for the presence of broad H.
-
4.
TGS522Z221: unexplained emission feature exists in the spectrum at 7340Å. A higher signal–to–noise ratio spectrum is desirable in order to confirm the redshift identification.
-
5.
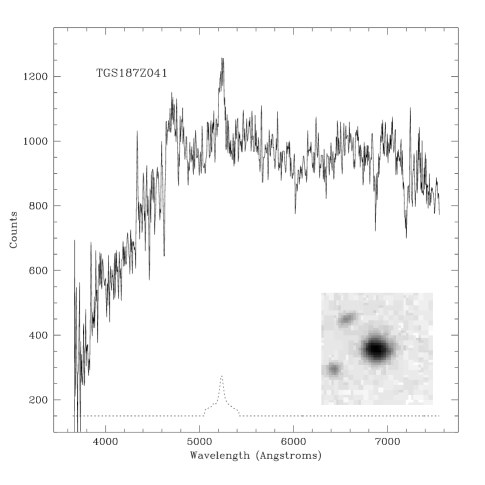
TGS187Z041 a spectrum showing evidence for a low-redshift galaxy and a quasar at much higher redshift (see Table. 2 and Fig. 8). The quasar identification relies on the presence of a single emission line at Å and the redshift of is derived assuming the feature is Mg ii 2798. Note that this spectrum was observed using the science-grade CCD1, whereas it was the engineering-grade CCD2 that produced spurious features at Å. None the less, confirmation of the spectrum is required to establish TGS187Z041 as a strong lens candidate, particularly since ESO NTT -band imaging obtained on February 2 2002, using the SUSI instrument in conditions with arcsec seeing, showed no evidence of a morphology indicating the system is a gravitational lens.
| 2dF Name | RA (J2000) | Dec (J2000) | ||||
|---|---|---|---|---|---|---|
| TGN120Z045 | 12 07 47.71 | 03 51 27.4 | 19.34 | 19.26 | 0.35 | 2 |
| TGN124Z166 | 12 26 47.75 | 03 25 22.6 | 19.17 | 19.35 | 0.30 | 1 |
| TGN148Z045 | 14 38 59.94 | 04 38 35.0 | 18.66 | 19.01 | 1.82 | 3 |
| TGN160Z226 | 10 39 24.66 | 03 48 31.6 | 18.37 | 18.70 | 0.79 | 2 |
| TGN170Z040 | 11 30 45.88 | 03 46 30.3 | 19.25 | 19.27 | 0.65 | 2 |
| TGN171Z248 | 11 34 09.16 | 04 26 53.4 | 19.27 | 19.08 | 0.93 | 2 |
| TGN172Z242 | 11 35 34.97 | 03 44 01.3 | 17.36 | - | 1.16 | 1 |
| TGN172Z270 | 11 34 33.45 | 03 06 55.5 | 19.15 | 19.18 | 0.45 | 3 |
| TGN176Z251 | 11 53 38.86 | 04 19 54.0 | 19.08 | 19.70 | 3.41 | 3 |
| TGN181Z175 | 12 20 18.37 | 02 41 01.9 | 18.93 | 18.42 | 0.44 | 3 |
| TGN200Z277 | 13 37 21.90 | 02 25 12.1 | 19.02 | 19.16 | 0.51 | 2 |
| TGN207Z146 | 14 16 37.88 | 03 01 32.1 | 19.37 | 19.36 | 1.66 | 3 |
| TGN224Z190 | 10 37 02.33 | 01 49 53.2 | 18.42 | 17.89 | 0.33 | 3 |
| TGN254Z003 | 12 52 20.45 | 00 39 49.9 | 19.44 | 19.31 | 1.84 | 3 |
| TGN280Z141 | 14 36 24.82 | 00 29 05.0 | 18.82 | 17.88 | 0.32 | 3 |
| TGN288Z181 | 10 14 14.10 | 01 59 18.1 | 18.71 | 18.38 | 2.23 | 3 |
| TGN292Z093 | 10 29 35.17 | 01 21 39.8 | 18.52 | 17.84 | 1.06 | 3 |
| TGN305Z146 | 11 25 28.45 | 01 51 29.8 | 18.97 | 18.63 | 1.37 | 3 |
| TGN338Z080 | 13 57 00.49 | 00 26 28.5 | 18.69 | 20.10 | 1.54 | 3 |
| TGN346Z197 | 14 34 52.70 | 00 28 28.1 | 19.35 | 18.70 | 2.24 | 3 |
| TGN367Z176 | 11 01 05.44 | 00 01 55.9 | 19.20 | - | 2.47 | 3 |
| TGN423Z040 | 10 19 12.96 | 01 29 36.7 | 19.33 | - | 1.28 | 3 |
| TGS059Z150 | 21 59 55.98 | 24 16 36.0 | 19.36 | 18.72 | 2.30 | 3 |
| TGS061Z180 | 22 09 19.07 | 24 07 13.2 | 19.29 | 18.59 | 0.32 | 3 |
| TGS109Z209 | 03 05 24.31 | 24 42 05.5 | 18.77 | 17.71 | 0.51 | 3 |
| TGS114Z079 | 22 00 28.13 | 25 19 39.7 | 19.36 | 18.90 | 0.90 | 2 |
| TGS116Z170 | 22 10 44.87 | 26 06 25.0 | 19.23 | 18.64 | 0.41 | 3 |
| TGS120Z117 | 22 33 57.46 | 25 40 47.0 | 19.39 | 19.58 | 3.03 | 3 |
| TGS132Z079 | 23 53 34.35 | 25 52 15.7 | 19.20 | 20.49 | 1.07 | 2 |
| TGS164Z031 | 03 07 43.75 | 25 49 03.9 | 19.35 | 19.48 | 1.65 | 3 |
| TGS176Z118 | 22 12 18.36 | 27 42 12.2 | 19.19 | 19.27 | 0.53 | 3 |
| TGS185Z206 | 23 00 37.69 | 26 44 36.1 | 19.20 | 19.39 | 1.75 | 3 |
| TGS201Z045 | 00 11 28.67 | 28 11 23.2 | 19.42 | - | 2.27 | 3 |
| TGS215Z047 | 01 20 17.37 | 27 45 10.8 | 19.20 | 18.69 | 2.57 | 3 |
| TGS216Z071 | 01 18 56.85 | 27 26 33.4 | 19.05 | 18.44 | 1.80 | 3 |
| TGS296Z199 | 01 18 09.10 | 29 01 54.1 | 19.30 | 20.33 | 1.73 | 3 |
| TGS299Z124 | 01 31 32.12 | 28 33 09.9 | 19.32 | - | 1.12 | 3 |
| TGS306Z029 | 02 08 14.01 | 28 28 10.6 | 19.12 | 20.22 | 0.36 | 1 |
| TGS322Z050 | 03 31 51.85 | 29 00 17.3 | 19.16 | - | 0.31 | 1 |
| TGS328Z215 | 21 46 45.76 | 30 43 39.6 | 19.33 | 18.78 | 2.63 | 3 |
| TGS340Z134 | 22 38 41.00 | 30 51 29.5 | 19.34 | 19.09 | 1.65 | 3 |
| TGS391Z057 | 02 28 12.58 | 30 47 49.9 | 19.28 | 18.20 | 0.91 | 2 |
| TGS393Z082 | 02 45 00.78 | 30 07 23.0 | 19.34 | 18.28 | 0.34 | 3 |
| TGS467Z204 | 02 48 24.66 | 31 33 48.9 | 18.50 | 17.19 | 0.32 | 3 |
| TGS468Z111 | 02 59 10.91 | 31 40 08.4 | 19.25 | 18.79 | 0.43 | 3 |
| TGS522Z221 | 02 55 22.78 | 32 45 55.4 | 18.92 | 19.58 | 2.73 | 3 |
| TGS817Z145 | 03 57 03.57 | 49 25 40.9 | 19.44 | 19.25 | 0.78 | 2 |
| TGS829Z039 | 01 30 11.32 | 47 59 55.9 | 19.43 | 20.03 | 2.45 | 3 |
| TGS829Z217 | 01 24 27.01 | 47 31 30.5 | 19.25 | 18.61 | 1.56 | 3 |
| TGS836Z293 | 01 17 29.50 | 39 14 19.3 | 19.09 | 19.64 | 2.11 | 3 |
| TGS836Z539 | 01 20 00.31 | 40 56 59.3 | 19.11 | 18.43 | 1.18 | 3 |
| TGS858Z005 | 00 24 35.98 | 12 32 03.4 | 19.41 | 19.80 | 2.47 | 3 |
| TGS875Z416 | 02 38 58.98 | 46 06 01.6 | 19.27 | 18.67 | 1.14 | 3 |
| TGS893Z369 | 00 23 20.07 | 40 34 18.5 | 19.38 | 18.71 | 2.63 | 3 |
| TGS901Z004 | 01 22 29.47 | 08 30 11.8 | 19.03 | - | 1.93 | 1 |
| 2dF Name | RA (J2000) | Dec (J2000) | ||||
|---|---|---|---|---|---|---|
| TGS187Z041 | 23 11 40.62 | 27 47 44.6 | 17.94 | 16.83 | 0.1643 | 0.87 |
6 Discussion
The sample of high-redshift quasars described in Section 5 is unique due to the parent survey’s explicit morphological selection of non-stellar objects. Indeed, most of the images shown in Fig. 3 are either noticeably extended or have distinct companions. From a more physical point of view the quasars fall into three distinct categories: those with visible host galaxies (Section 6.1); possible gravitational lenses (Section 6.2); and those with low-redshift galaxies along the line–of–sight (Section 6.3).
6.1 Quasar host galaxies
A significant proportion of the quasars in the sample (13 out of 55) have redshifts and sufficiently non-stellar appearances to have entered the APM survey without any nearby companions (cf. the compound objects described in Sections 6.2 and 6.3). In several cases there is spectroscopic evidence for the presence of host galaxies in the form of common photospheric absorption lines, implying that it is the quasars’ hosts that are also responsible for the extended morphology. Although the discovery of this kind of low-redshift quasar was not a strong motivation for this search, imaging and spectroscopy of these objects, which would be difficult to find in any other way, could prove valuable in the understanding of the relationship between quasars and their host galaxies.
6.2 Gravitational lenses
One of the objects discovered in this survey, TGS187Z041 (Section 5.3; Fig. 8), is a possible gravitational lens, having the morphology of a low-redshift galaxy, but a spectrum that appears to be a combination of galaxy and quasar. Although higher resolution imaging is required to confirm the lensing hypothesis, such a discovery would not be entirely unexpected, and indeed the initial motivation for this project was to search for spectroscopic lenses (Mortlock, Madgwick & Lahav 2001).
To date Q 2237+0305 (Huchra et al. 1985) is the only quasar lens identified in this fashion333Related surveys for lensed emission line galaxies (Warren et al. 1996; Hewett et al. 2000; Hall et al. 2000) have resulted in a number of candidates, but only the first of these is confirmed at present., but theoretical calculations by Kochanek (1992) and Mortlock & Webster (2001, 2002) implied that lenses could be discovered in the (full) 2dFGRS. Thus would be expected in the 100k sample, which, given that the discovery of these systems is a Poisson process, is marginally consistent with the single (putative) lens identified. However the nature of the other quasars discovered during the search allows the models used in the above calculations to be reassessed.
In particular, the expected number of lenses increases rapidly with , the parameter which specifies how much fainter than the galaxy the quasar images can be whilst still being detectable. Mortlock & Webster (2001) estimated for the 2dFGRS, but the absence of galaxy-dominated spectra from the objects described in Section 6.1, together with Monte Carlo simulations, implies that a value of is more appropriate. It is also clear in some cases that the identification of the quasar emission lines is limited by the photon noise as well as the presence of galactic emission, a factor explicitly accounted for by neither Kochanek (1992) nor Mortlock & Webster (2000, 2001). The estimated SSS magnitudes of the high-redshift objects in Table 1 imply an effective limiting magnitude of for the quasars themselves, which would certainly remove some lenses from the sample if . However the adjustment to also has the effect of excluding noise-limited detections, implying that the above models are adequate provided a value of close to unity is adopted. Overall it seems that the results are consistent with this more conservative model of the 2dFGRS, which then implies a total yield of lenses from the full survey.
6.3 Absorption systems
Most of the redshift quasars in the sample entered the 2dFGRS due to the presence of faint companion images – some classes of ‘star–galaxy’ mergers were selected into the parent APM survey (Maddox et al. 1990). In most cases the companions appear to be faint (–) low-redshift galaxies, although this is in part due to the strong selection effect that the quasars be detectable in the 2dF spectra. (If there is significant angular separation between the quasar its companion this requires that the 2dF fibre was centred close to the quasar; in situations where the two components are coincident the quasar must be approximately as bright as its companion for its emission lines to be detectable; cf. Section 6.2.)
Confirmation imaging and spectroscopy of the quasar candidates with companion images should then provide a well characterised sample of redshift galaxies that possess background probes (the quasars) with impact parameters ranging from to kpc. Such systems will be of value in studies of the interstellar medium of the foreground galaxies and for establishing the properties of inter-galactic absorption at low redshift (e.g. Bowen, Blades & Tytler 1997; Bowen, Blades & Pettini 1995; Chen et al. 1998, 2001).
7 Conclusions
We have conducted a spectroscopic search for quasars in the 2dFGRS 100k catalogue and generated a sample of 55 candidate objects. Two analysis techniques were used – a matched filter-based search and wavelet transforms – and both were successful in finding per cent of the candidates. The low-redshift quasars in the sample are typically extended (probably due to their host galaxies) and many of the high-redshift quasars have fainter companions (likely to be low redshift galaxies along the line–of–sight), including one which is a possible gravitational lens. We are currently in the process of obtaining confirmation spectroscopy of these objects (and imaging of the candidate lens). The next stage of this project will be to obtain high quality spectra of the galaxies with good background probes (i.e. the quasars with low impact parameters) with a view to performing absorption studies of their interstellar medium.
Acknowledgments
The efforts of the 2dFGRS team in compiling the 100k Data Release are greatly appreciated. Terry Bridges, Russell Cannon and Karl Glazebrook provided valuable advice concerning features of the 2dFGRS spectra. In addition Russell Cannon also provided us with many valuable comments on improving the original draft of this paper. Tom Oosterloo and Lister Staveley–Smith contributed significantly to our understanding of wavelets and Mike Read provided invaluable assistance with the use of the SuperCOSMOS Sky Survey. DSM was supported by an Isaac Newton Studentship from Trinity College and the University of Cambridge. DJM was supported by PPARC.
References
- [Blanton et al. 2001] Blanton M., et al., 2001, AJ, 121, 2358
- [Bowen, Blades, Pettini(1995)] Bowen, D. V., Blades, J. C., Pettini, M. 1995, ApJ, 448, 662
- [Bowen, Osmer, Blades, Tytler(1997)] Bowen, D. V., Osmer, S. J., Blades, J. C., Tytler, D. 1997, MNRAS, 284, 599
- [Chen, Lanzetta, Webb, Barcons(1998)] Chen, H., Lanzetta, K. M., Webb, J. K., Barcons, X. 1998, ApJ, 498, 77
- [Chen, Lanzetta, Webb, Barcons(2001)] Chen, H., Lanzetta, K. M., Webb, J. K., Barcons, X. 2001, MNRAS, 559, 654
- [Colless et al. 2001] Colless, M. M., et al., 2001, MNRAS, 328, 1039
- [Connolly et al.2002] Connolly A., et al., 2002, ApJ, submitted (astro-ph/0107417)
- [Croom et al. 2001] Croom S. M., Smith R. J., Boyle B. J., Shanks T., Loaring N. S., Miller L., Lewis I. J., 2001, MNRAS, 322, L29
- [de Propris et al. 2001] de Propris R., et al., 2002, MNRAS, 329, 87
- [Fan et al. 2001] Fan X., et al., 2001, AJ, 121, 31
- [Francis et al. 1991] Francis P. J., Hewett P. C., Foltz C. B., Chaffee F. H., Weymann R. J., Morris S. L., 1991, ApJ, 373, 465
- [Hall et al. 2000] Hall P. B., et al., 2000, AJ, 120, 1660
- [Hambly et al. 2001] Hambly N., et al. 2001, MNRAS, 326, 1279
- [Harris et al. 2001] Harris H., et al., 2001, ApJ, 549, L109
- [Hewett et al. 1985] Hewett P. C., Irwin M. J., Bunclark P. S., Bridgeland M. T., Kibblewhite E. J., He X. T., Smith M. G., 1985, MNRAS, 213, 971
- [Hewett et al. 2000] Hewett P. C., Warren S. J., Willis J. P., Bland–Hawthorn J., Lewis G. F., 2000, in van Breugel W., Bland–Hawthorn J., eds., Imaging the Universe in Three Dimensions. ASP, San Francisco, p. 94
- [Huchra et al. 1985] Huchra J. P., Gorenstein M., Kent S., Shapiro I., Smith G., Horine E., Perley R., 1985, AJ, 90, 691
- [Kochanek 1992] Kochanek C. S., 1992, ApJ, 397, 381
- [Lewis2002] Lewis I., et al., 2002, MNRAS, in press (astro-ph/0202175)
- [Maddox et al. 1990] Maddox S. J., Efstathiou G., Sutherland W. J., Loveday J., 1990, MNRAS, 243, 692
- [Mallat1998] Mallat S., 1998, A Wavelet Tour of Signal Processing, Academic Press, London
- [Madgwick et al. 2002] Madgwick D. S., et al., 2002, MNRAS, 333, 133
- [Magliocchetti et al. 2002] Magliocchetti M., et al., 2002, MNRAS, 333, 100
- [Mortlock & Webster 2000] Mortlock D. J., Webster R. L., 2000, MNRAS, 319, 879
- [Mortlock & Webster 2001] Mortlock D. J., Webster R. L., 2001, MNRAS, 321, 629
- [Mortlock et al. 2001] Mortlock D. J., Madgwick D. S., Lahav O., 2001, PASA, 18, 192
- [Norberg et al. 2001] Norberg P., et al., 2001, MNRAS, 328, 64
- [Peacock et al. 2001] Peacock J. A., et al., 2001, Nature, 410, 169
- [Percival et al. 2002] Percival W. J. et al., 2002, MNRAS, 327, 1297
- [Sadler et al. 2001] Sadler E. M., et al., 2002, MNRAS, 329, 227
- [Starck, Siebenmorgen & Gredel1997] Starck J., Siebenmorgen R., Gredel R., 1997, ApJ, 482, 1011
- [Strauss et al. 2001] Strauss M., et al., 1999, ApJ, 522, L61
- [Warren et al. 1996] Warren S. J., Hewett P. C., Møller P., Iovino A., Shaver P., 1996, MNRAS, 278, 139
- [York et al. 2001] York D. G., et al., 2000, AJ, 120, 1579