Cluster formation versus star formation around six regions in the Large Magellanic Cloud
We studied the stellar population and star clusters around six regions in the Large Magellanic Cloud (LMC) in order to understand the correlation between star formation and cluster formation episodes. We used the stellar data base of the OGLE II LMC survey and the star cluster catalogues. The analysis of the colour-magnitude diagrams (CMDs) were used to estimate the ages of the stellar population. It is found that most of the regions have undergone three major star formation episodes. The star formation which began about 4 Gyr ago, continued upto around 1 Gyr, or continued further. The other two events have taken place around 300 Myr, and 100 Myr. A few star clusters were formed during the first of the three star formation events in 5 regions. In all the six regions, a good correlation is seen between the star formation and the cluster formation events which occurred at 300 Myr and 100 Myr. The cluster formation events and the fraction of star clusters formed were found to be very similar for two regions located to the south-east of the Bar, suggesting similar cluster formation triggers at almost similar instances. The two recent star formation events seem to correlate with the interactions of LMC with Small Magellanic Cloud (SMC) and Galaxy. Hence it is quite likely that the young populous star clusters in the LMC are formed as a result of the star formation events started due to galaxy-galaxy interactions and the further propagation of such star formation.
Key Words.:
Large Magellanic Cloud - star clusters - star formation history1 Introduction
The Large Magellanic Cloud is known to have a very different star formation history compared to our Galaxy. It is known to house a different variety of star clusters, which are not found in our Galaxy. Our Galaxy has very old and very dense clusters, called globular clusters and a large number of intermediate to very young clusters with only a few hundred to thousand stars as members, called open star clusters. In the LMC, only a few globular clusters are found and they are referred to as red globulars. There are another set of dense and compact star clusters known as blue globulars, which look like globular clusters, but their age ranges from a few giga years to a few million years. The mechanism responsible for the formation of these dense star clusters in LMC is not known, when our Galaxy seems to be creating clusters which are hardly bound.
In the recent years, the LMC has been very thoroughly studied using various surveys, for example, OGLE II (Udalski et al. u2000 (2000)), Magellanic Clouds Photometric Survey (Zaritsky et al. z97 (1997)). These surveys were used partly or fully to study the star clusters and the stellar population in LMC. However, these two are done separately such that the spatial correlation between the star and cluster formation episodes are not studied. Girardi et al. g95 (1995) used the star cluster catalogue of Bica et al. bea96 (1996) to derive the star cluster properties in LMC. Pietrzynski & Udalski pu00 (2000) used the OGLE II data and studied the age distribution of LMC star clusters. There were also studies on star clusters and stellar population around them, (for example, Olsen et al. o98 (1998) and Olsen o99 (1999)), but these also do not compare the spatial correlation between cluster and star formation episodes. It is concluded that in general, the star clusters in LMC are not good tracers of the stellar population (van den Bergh v99 (1999)). This conclusion has been made from the analysis of the cluster and stellar population in the whole of LMC. In this study, an attempt is made to study the correlation between the star formation and cluster formation episodes around a few regions in LMC.
The recent star forming regions, like the 30 Dor and super giant shells found in LMC indicate that the star formation which began at one point propagates to larger distances in the LMC. The theories put forward to explain these structures include stochastic self-propagating star formation, SSPSF (Feitzinger et al. f81 (1981)) and recently by de Boer et al. b98 (1998), suggesting bow-shock induced star formation. It is quite likely that these type of groups and star formation processes existed in older times as well. If these type of structures existed in LMC, then the cluster population surrounding a region of stellar population should have some correlation in age. Also, nearby regions would then show similar cluster formation episodes and similar number of clusters per episode of cluster formation. We explore this correlation in this study, by looking at star clusters in neighbouring regions in LMC.
2 Data and analysis
2.1 Regions
| Region | RA | Dec | ||||
|---|---|---|---|---|---|---|
| h | m | s | ∘ | ′ | ′′ | |
| Region 1 | 05 | 35 | 29.33 | 21 | 29.39 | |
| Region 2 | 05 | 32 | 09.27 | 22 | 11.70 | |
| Region 3 | 05 | 26 | 50.33 | 01 | 23.08 | |
| Region 4 | 05 | 23 | 50.12 | 00 | 23.50 | |
| Region 5 | 05 | 23 | 21.82 | 29 | 48.48 | |
| Region 6 | 05 | 08 | 01.10 | 37 | 37.67 | |
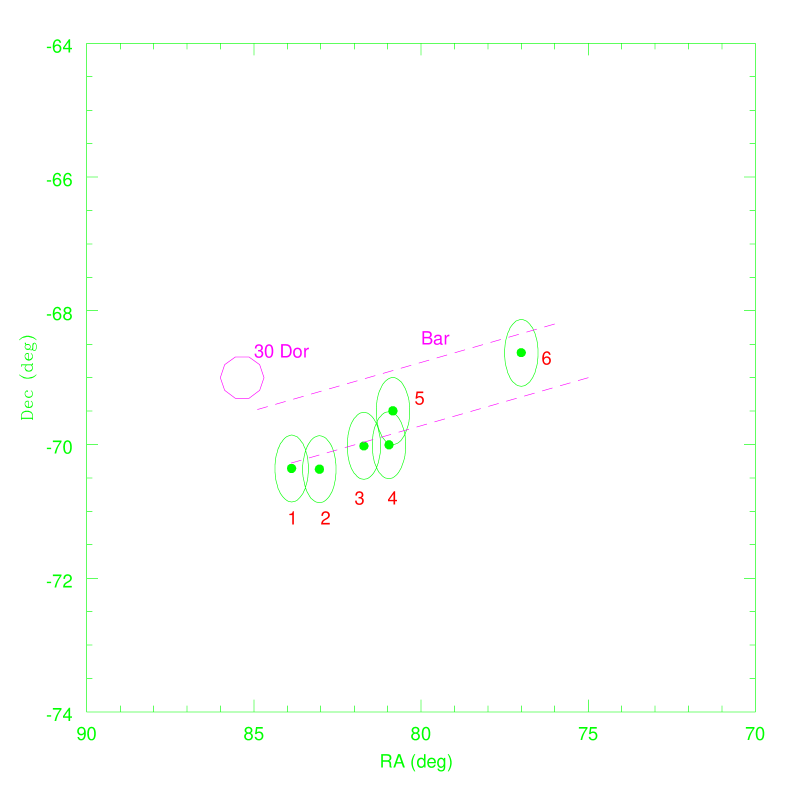
The regions studied here were chosen for a different project, that is, to study the stellar population around novae in LMC (see Subramaniam & Anupama sa02 (2002)). We selected 6 regions for the present analysis. The stellar data within a radius of a few arcmin is used to study the star formation history (SFH) of the region under consideration, whereas the star clusters are identified within 30 arcmin radius to study the cluster formation events. The regions satisfy the following two conditions - a) there are good number of star clusters within 30 arcmin radius and b) ages are known for most of the identified clusters. The location of these regions are given in Table 1. These locations are also plotted in figure 1. The dots show the centers of the regions studied and the big circles around them show the extend of the region scanned for star clusters.
It can be seen from figure 1 that the first and the second regions are located nearby, and similarly the regions third and fourth are located close by. Of these, regions 1, 2, 3 and 4 are located just outside and south of the Bar, whereas, region 5 is located within the Bar. The region 6 is located within the Bar, but towards the north-western side of the Bar.
2.2 Field stars
Field stars within a radius of a few arcmin were identified from the OGLE II survey (Udalski et al. u2000 (2000)). As more observations were found to be available in the I passband, we used the photometric data in the V and I passbands and V vs (VI) colour-magnitude diagrams (CMDs) of the identified field stars were used in further analyses.
The stellar data are corrected for an assumed LMC reddening of mag. Although the reddening in the LMC has been shown to be varying and clumpy (Udalski et al. u99 (1999)), the uniform reddening assumed here was found to be satisfactory while fitting the isochrones to the main-sequence of the CMDs. Assuming the relation and , the value of mag. This value of extinction agrees (within errors) with that estimated by Dolphin d00 (2000). Following Pietrzynski & Udalski pu00 (2000) a distance modulus of 18.24 mag for the LMC is assumed here. For this value of distance modulus, 1 arcmin corresponds to 13.4 pc on LMC.
The different stellar populations are identified by isochrone fits to the CMDs. An isochrone fit to the MS identifies the youngest population while the isochrone fits to the RGB identifies the older population. The slope of the RGB and the brightest point of the RGB are dependant on the age and metallicity of the stellar population. The analysis done in Subramaniam & Anupama sa02 (2002) found that the metallicity of the stellar population agrees well with the Z=0.008 isochrones. Hence we adopt the value Z=0.008 for the metallicity. The isochrones were obtained from Bertelli et al. bea94 (1994).
The limiting magnitude in the OGLE II data is around mag. This implies the stars in the MS are younger than about 1.6 Gyr, while the RGB stars are a mixture of both young and old population. Therefore the present data is not suitable to understand the star formation history older than around 4 Gyr.
2.3 Star clusters
The star clusters in the vicinity of six regions were identified and their properties obtained based on the following catalogues: Pietrzynski et al. pea99 (1999) (P99), Bica et al. bea99 (1999) (B99), Bica et al. bea96 (1996) (B96), Pietrzynski and Udalski pu00 (2000) (PU2000). B96 presented integrated UBV photometry of 624 star clusters and associations in the LMC. They estimated the ages of the clusters based on their integrated colours and hence classified the clusters into SWB types (Searle, Wilkinson & Bagnoulo swb80 (1980)), which is basically an age sequence. This classification can be used to obtain the approximate age of the clusters. B99 is a revised version of the above catalogue and contains about 1808 star clusters for which the positions and extents are tabulated. Pietrzynski et al. pea99 (1999) presented photometric data of 745 star clusters and their nearby field, of which 126 are new findings. Pietrzynski and Udalski pu00 (2000) estimated the ages for 600 star clusters presented in the P99 catalogue. The catalogues in B99 and P99 were used to identify the clusters, while B96 and PU2000 were used to estimate the ages of the identified star clusters.
Clusters have been identified within 30 arcmin radius around 6 regions using B99 around the regions tabulated in table 1. 109 clusters have been identified near 6 regions. Of these, age estimates for 89 clusters could be obtained from PU2000 and B96. The B96 gives the age of the cluster in terms of groups. As the interest is in the overall age of the cluster population rather than the ages of the individual clusters, age groups give a better insight. Therefore, even those clusters whose exact age is known are also grouped. The number of clusters detected near each region, the number for which the age is known and the number of clusters in various age groups are tabulated in Table 2. The clusters are grouped into the following five age groups:
-
(a) clusters with ages , indicating clusters of very young age
-
(b) clusters with ages , indicating clusters which are relatively young.
-
(c) clusters with ages , equal to 8.0 and less than 8.5, indicating a group of moderately young clusters.
-
(d) clusters with ages ,
-
(e) clusters with ages , indicative of intermediate to old population.
Field stars within a radius of a few arcmin are analysed to study the star formation history, while clusters within 30 arcmin ( 400 pc) radius are considered to identify the cluster formation episodes. The choice of larger radius for the clusters is justified as they are being used to study the events which took place on relatively larger scales. It is found that the supergiant shell LMC 4 is about 1 Kpc in diameter. Therefore, we have chosen very similar length scale for identifying the star clusters.
| Region | No. of clusters | No. of clusters | Age groups | ||||
| within 30 arcmin | with age known | 7.5 | 7.5 – 8.0 | 8.0 – 8.5 | 8.5 – 9.0 | 9.0 | |
| Region 1 | 17 | 15 | 1 | 1 | 6 | 5 | 2 |
| Region 2 | 15 | 12 | 1 | - | 7 | 3 | 1 |
| Region 3 | 27 | 22 | - | 4 | 11 | 7 | - |
| Region 4 | 24 | 19 | - | 2 | 11 | 4 | 2 |
| Region 5 | 17 | 13 | - | 3 | 3 | 3 | 4 |
| Region 6 | 9 | 8 | - | 4 | 1 | 2 | 1 |
3 Results
3.1 Region 1
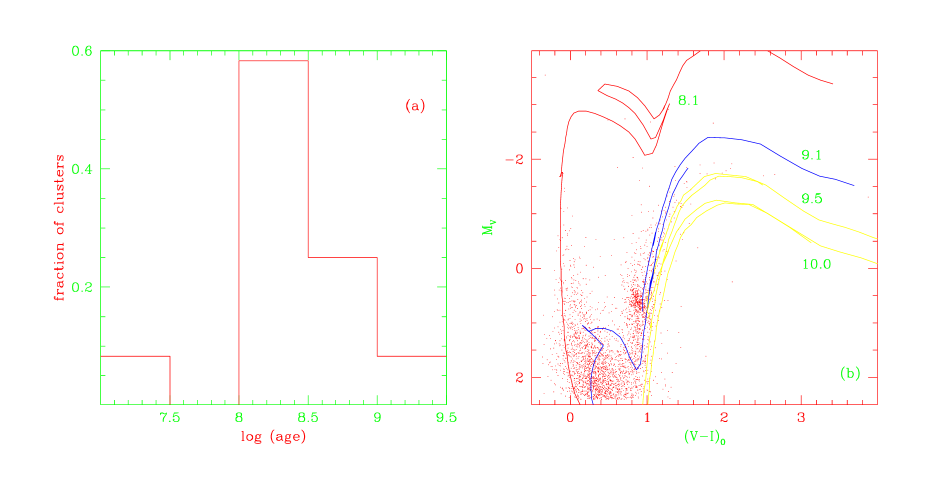
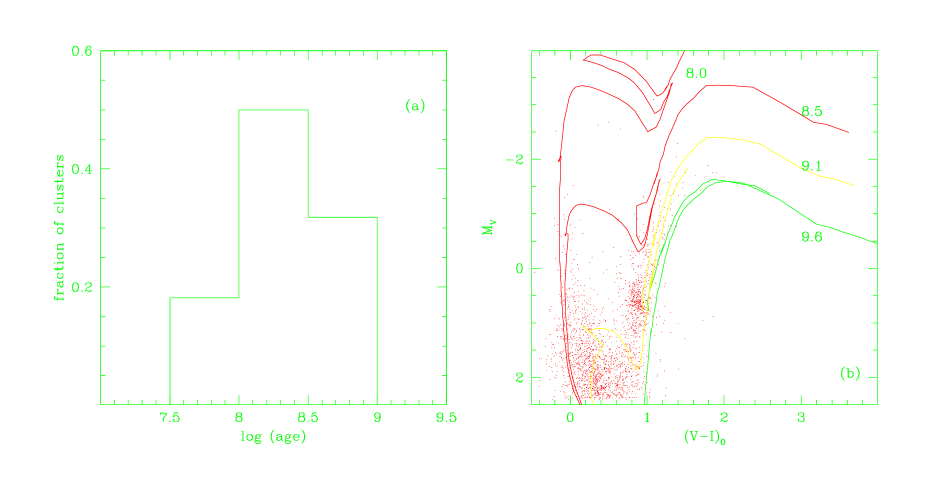
Within a radius of 400 pc, we identified 17 star clusters around this region and ages are known for 15 of them. We find that, forty percent of the clusters have ages in the range 100 – 300 Myr, 33.3% of clusters have ages in the range 300 – 1 Gyr and 13.3% clusters are older then 1 Gyr. Hence, this region experienced a 2.5 times enhancement in the formation of clusters, between 300 – 1 Gyr, and increased a little more around 300 Myr and continued till 100 Myr. In the last 100 Myr, this region has formed 1 cluster older than 30 Myr and one cluster younger than 30 Myr. Hence there has been a constant formation of clusters with varying rates. Figure 2 shows the histogram of the normalised fraction of clusters with respect to age.
The CMD and LF of 4238 field stars within a radius of 2 arcmin is shown in figure 2. A broad RGB, a prominent clump and a few bright giants are seen in the evolved part of the CMD. The broad RGB is indicative of stars with a range in ages. The isochrone fit to the right most end of the RGB indicates that the reddest stars are 2.5 Gyr old. Stars belonging to a population older than 2.5 Gyr is not found. It is also seen that at the fainter end of the CMD, the MS and the RGB are not well separated, but joined together due to the presence of sub giants and the isochrone fits show that the stellar population are of ages 1.3 Gyr and 1 Gyr. The MS is wide upto mag and the width decreases at brighter magnitudes. This probably indicates a decrease in star formation. The isochrone of age 300 Myr shows that the star formation probably continued till then. The vertical extension of the RGC, as seen in the CMD also indicates that stars younger than 1 Gyr, in the range 300 – 1 Gyr, are present. The well populated MS also indicates the same. The brightest part of the CMD is found to be 100 Myr old. There is no indication of the presence of stars younger than 100 Myr.
It is seen that the star formation event between 1.0 and 2.5 Gyr resulted in the formation of two star clusters. The star formation which continued to younger ages, resulted in the formation of 5 star clusters, which fall in the age range 300 – 1 Gyr. This event probably ended around 300 Myr with the creation of another 6 star clusters. The above two are seen as enhancements in the cluster formation between 300 Myr – 1 Gyr and 100 Myr – 300 yr. The latest star formation event at 100 Myr resulted in one cluster formation. We do not see stars less than 100 Myr old, though one cluster is found which is aged less than 30 Myr. The cluster and star formation events are correlated, except for the youngest population of clusters.
3.2 Region 2
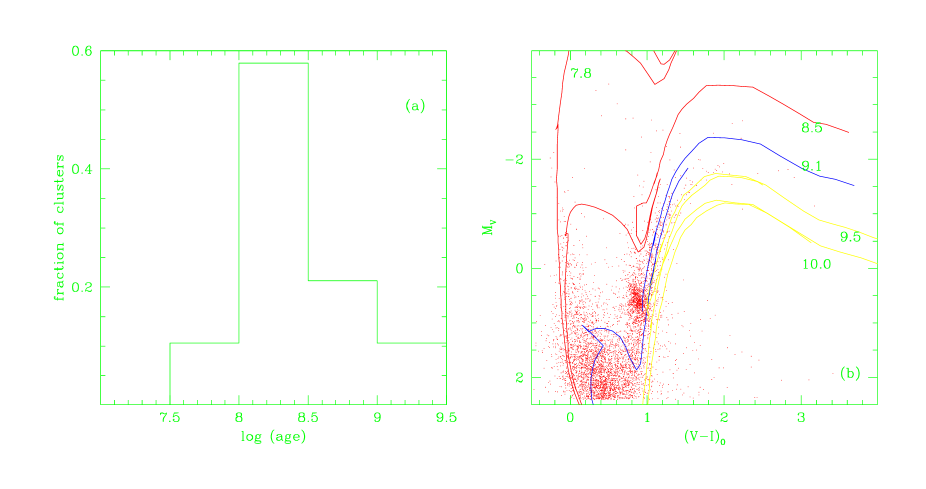
15 star clusters were identified within a radius of 30 arcmin ( 400 pc), of which the ages are known for 12. 58% of the clusters in this region have ages between 100 – 300 Myr, 25% between 300 Myr and 1 Gyr. Only 8% of clusters are either younger than 30 Myr or older than 1 Gyr. Hence the bulk of cluster formation has occurred in the 100-300 Myr range with a tapering towards 1 Gyr. A histogram of the normalised cluster fraction against age is shown in Figure 3.
The field star population within 3 arcmin (40 pc) radius is studied based on a CMD of 3018 stars. The CMD is shown in figure 3. Isochrones corresponding to 10 Gyr, 3.2 Gyr, 1.3 Gyr and 125 Myr are used to fit the CMD and estimate the ages of the stellar population. A few stars belonging to the 10 Gyr population are seen in the RGB, as indicated by the 10 Gyr isochrone. There seems to be no stellar population between 10 Gyr and 3.2 Gyr. Isochrones of ages 3.2 Gyr and 1.3 Gyr fit the RGB and the RGC as well as the sub giant branch stars which connect the MS and the RGB at the fainter end of the CMD. This implies that a bulk of the stars were formed during this time. The stars towards the right side of the 1.3 Gyr isochrone at the RGB belong to a younger population. The MS between 1.0 – 1.0 shows scatter, indicating continued star formation, probably on a reduced scale. The brightest stars in the MS are about 125 Myr old.
A small enhancenment in the star cluster formation occured between 300 Myr – 1 Gyr and a substantial enhancement occured between 100 Myr – 300Myr. When we compare these with the star formation episodes, we find that corresponding to the star formation between 3.2 – 1.3 Gyr, there is one cluster formed in the region. The continued star formation created 3 more clusters. Corresponding to the star formation event at 125 Myr, we see maximum number of star clusters in the range 100 – 300 Myr. There is one cluster which is less than 30 Myr old, but no field population is found younger than 125 Myr. Thus the star formation and the cluster formation are correlated, except for the youngest cluster formation event. This is similar to what is observed in region 1.
3.3 Region 3
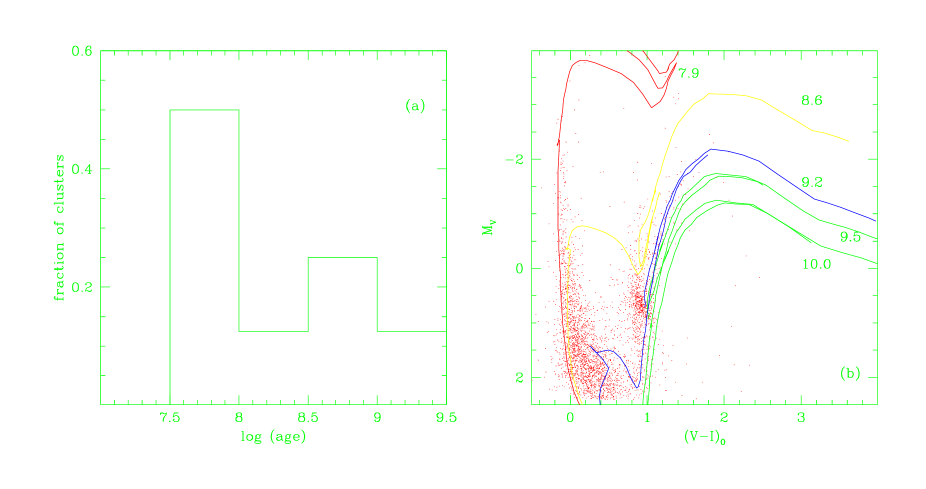
27 star clusters are found within the 30 arcmin radius, of which the ages are known for 22. 18% of the clusters have ages within 30 – 100 Myr, 50% have ages between 100 – 300 Myr and 32% have ages between 300 – 1 Gyr. These indicate that there was a burst of cluster formation some time during 100 – 300 Myr with a tapering star formation before and after this burst. The normalised cluster fraction is shown against age in figure 4.
The CMD of 2152 stars within a radius of 3 arcmin is shown in Figure 4. The CMD shows a scattered RGB and MS, and a RGC. The isochrone fits reveal that the oldest traceable population is about 4.0 Gyr. The star formation then continued to about 1.3 Gyr. This is indicated by the fit of the isochrone to the subgiant branch location and the red giants of the RGB. It is clearly seen that the clump population basically belongs to the 1.3 Gyr population and younger. A few stars can be seen to the left of the 1.3 Gyr isochrone at the RGB, which indicates that the star formation continued for more recent times, probably with less vigour. The broad MS and the subgiant branch located in between the MS and the RGB, support the above fact. There is a clear signature of the 300 Myr old population as indicated by the isochrone. There are only a few stars which are birghter than the turn off of the 300 Myr isochrone in the MS, and these are found to be 100 Myr old.
In this region, we see that the cluster formation experienced an enhancement between 100 Myr – 300 Myr, with a few clusters being formed before and after that. The field star population do not show a strong presence of RGB population, especially when compared to the CMDs of regions 1 and 2. This indicates that the star formation event in the age range 1.3 – 4.0 Gyr was not very strong. This star formation event did not produce any star clusters also. The star formation seems to have continued upto 300 Myr, where we see that most of the star clusters are formed. The star formation which occured at 100 Myr has resulted in the formation of 4 star clusters. The cluster and star formation events are thus correlated in this region also.
3.4 Region 4
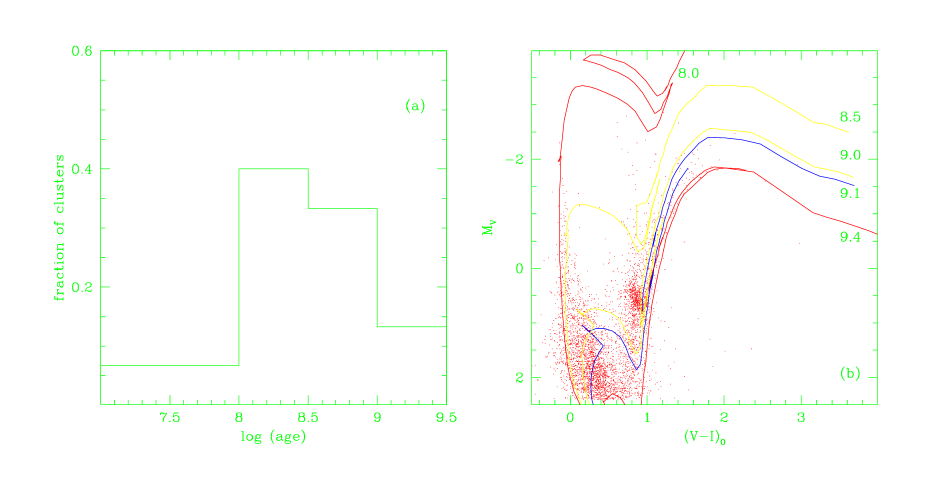
There are 24 star clusters in the vicinity and ages are known for 19 of them. The maximum number of star clusters were formed during the period 100 – 300 Myr, when 58% of the clusters were formed. 21% of clusters were formed during 300 – 1 Gyr period, 10% formed during the 30 – 100Myr period and the rest during the period before 1 Gyr. It appears that this region has been forming clusters from the beginning, with an increase in the rate before 1 Gyr, which increased further between 300 – 100Myr. Subsequently the rate appears to have and then reduced and stopped by 30 Myr. Figure 5 shows the normalised fraction of the clusters.
The CMD of stars within 2 arcmin radius plotted in Figure 5 comprises of 5244 stars. The RGB is well populated with a prominent RGC. The isochrone fit reveals that the the stars in the RGB have ages in the range 1.3 – 3.2 Gyr. Very few stars belonging to the age of 10 Gyr is seen in the CMD. The broad MS below = 0.0 mag indicates a continued star formation from about 1.3 Gyr to lesser ages. This probably continued till 300 Myr, as indicated by the isochrone fit. The brightest part of the MS is found to be 63 Myr old.
The cluster formation episode is seen to be quite strong in the age range 100 Myr – 300 yr, when a substantial increament in the clusters formed in seen. On comparing the star and cluster formation episodes, we find that the star formation event which occured in the age range 3.2 – 1.3 Gyr has managed to form two star clusters. The star formation which continued to younger times resulted in the formation of 4 star clusters. The star formation 300 Myr coincides with the cluster formation around the same time, resulting in the formation on 11 star clusters. The latest star formation event at 63 Myr, resulted in the formation of 2 star clusters. These indicate a good correlation between star and cluster formation events.
3.5 Region 5
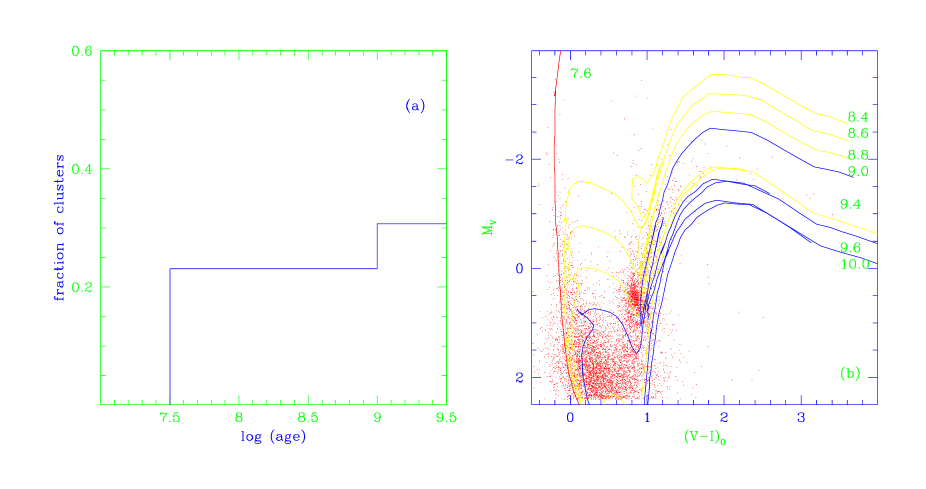
This regions is situated right at the center of the LMC Bar. Seventeen clusters are found in the vicinity, of which the ages are known for 13 clusters. Cluster formation in this regions appears to be at a more or less constant rate until 30 Myr. 31% of clusters are with ages more than 1 Gyr, and 23% of clusters in the lower age ranges. Hence the cluster formation rate was lowered around 1 Gyr, after an initial higher rate. The normalised cluster fraction is plotted against age in figure 6
The CMD of 6503 field stars within a region of 2 arcmin (27 pc) radius is plotted in Figure 6. The RGB, RGC and the MS are well populated. The isochrones corresponding to the ages 10 Gyr, 4 Gyr, 2.5 Gyr, 1 Gyr, 630 Gyr, 400 Gyr, 251 Gyr and 40 Gyr are plotted on the CMD. These isochrones seem to fit most of the stars in the RGB. It can be clearly seen that this region has experienced a more or less continuous star formation from 4 Gyr. We do see some stars belonging to the 10 Gyr population. Most of the RGB stars are located between the isochrones of ages 4 Gyr and 250 Myr. The isochrone fit to the MS of the CMD shows that the brightest MS stars are 40 Myr old.
The field stars convey almost the same information as the star clusters, regarding the star formation history of this region. Both indicate a constant star formation in this region from 4 Gyr till 30-40 Myr ago. The star cluster formation is also seen to be continuous and without much fluctuation over this period. We see that in this region, the star and the cluster formation episodes are very well correlated.
3.6 Region 6
In this region, 9 star clusters have been identified within 30 arcmin radius and the ages of 8 clusters are known. 50% of the clusters have ages in the range 30 – 100 Myr, 12.5% have ages in the range of 100 – 300 Myr, 25% in the range 300 – 1 Gyr and 12.5% have ages beyond 1 Gyr. This shows that there has been a constant cluster formation, with a rate which doubled during the 300 – 1 Gyr period and quadrupled during 30 – 100 Myr period. A histogram of the normalised cluster fraction against age is shown in figure 7.
3302 field stars located within 4 arcmin (54 pc) radius were identified and the CMD of the field stars are plotted in Figure 7. The CMD shows a very well populated MS with a fair number of young stars. The RGB is well populated with a slightly scattered RGC. The isochrones corresponding to the ages 10 Gyr, 3.2 Gyr, 1.6 Gyr, 400 Myr and 79 Myr are shown in the CMD. The 3.2 Gyr and 1.6 Gyr isochrones fit the bulk of the RGB stars. It can be seen that the 1.6 Gyr isochrone fits the subgiant branch as well. A few brighter subgiant branches are seen, indicative of younger stars. The CMD shows a population of stars directly above the RGC, which is like the extension of the RGC. These can be fitted with isochrones of age 400 Myr. This is indicative of a star formation event around 400 Myr. The CMD of this region shows an almost detached MS and the RGB at the magnitude level, mag, and only a few subgiant branches are seen connecting the two at brighter magnitudes. This indicates that the RGB population is relatively older. The brightest stars in the MS of the CMD is fitted very well with the 79 Myr isochrone, indicating that the star formation stopped around 79 Myr ago. This youngest population is also found to have a good number of stars indicating a relatively stronger star formation event.
The star formation event duting the age range 3.2 – 1.6 Gyr has produced one cluster in the vicinity. The star formation which occured at 400 Myr has probably resulted in the creation of two star clusters. This is seen as a small enhancement in the star cluster formation in figure 7. We do not see any significant star formation event between 400 and 79 Myr, though we see one cluster in this age range. The field stars show a strong star formation event at 79 Myr, a corresponding cluster formation event is also seen resulting in the formation of 4 star clusters. This is seen as a substantial enhancement in the cluster formation between 30 – 100 Myr period. Therefore, we see that the star formation and the cluster formation events are more or less correlated.
4 Discussion
4.1 star and cluster formation events
| Region | old | intermediate | moderately | young |
|---|---|---|---|---|
| young | ||||
| (Gyr) | (Gyr) | (Myr) | (Myr) | |
| Region 1 | - | 2.5 – 1.0 | 300 | 100 |
| Region 2 | 10 | 3.2 – 1.3 | - | 125 |
| Region 3 | - | 4.0 – 1.3 | 300 | 100 |
| Region 4 | 10 | 3.2 – 1.3 | 300 | 63 |
| Region 5 | 10 | 4.0 – 250 | 40 | |
| Region 6 | 10 | 3.2 – 1.6 | 400 | 79 |
The results presented in the last section is summarised in table 3. It can be seen from table 3 that the major star formation events which occurred in the regions studied are mostly three or less than that. These events in some regions have continued and hence produced stars for longer duration. We consider the star formation events one by one below.
We do not attempt to study the correlation between the cluster and star formation events before 4-5 Gyr, as the data used here are unsuitable for this purpose. Also, it is well known that LMC does not have star clusters in the age range 3 – 10 Gyr. There are only a few star clusters which are older than 10 Gyr and we do not study the star formation events in this age range. We see from the previous section that, the density of the very old population is very small and in some regions, no trace of this population is found.
The major event of star formation started somewhere around a few Gyr in most regions of the LMC. In the regions studied here, we find that the intermediate age stars are formed from 4 Gyr , where 4 Gyr is the upper age limit. This star formation event has started at three different times, 4 Gyr, 3.2 Gyr and 2.5 Gyr. This event later seems to have ended or decreased in intensity by 1.0 – 1.6 Gyr. The star cluster population in this age range is present in 5 of the 6 regions studied. In the sixth region, we do not find much of the intermediate age stars, which is well correlated with the absence of any clusters. In most of the regions the star formation continued to more recent times, but in a subdued manner. The continued star formation to ages less than 1 Gyr is seen in the CMDs and this corresponds to the continued cluster formation events.
The moderately young population of 250 – 400 Myr is seen in 5 of the 6 regions studied here. In all these regions, an enhancement in the fraction of clusters is also observed. In the case of region 5, the star formation is continued till 250 Myr, which is also reflected in the number of clusters found in this age range. In the case of region 2, the 300 Myr episode is not seen. Stars belonging to 125 Myr old population is seen in the CMD of region 2, and a cluster formation event has occured between 100 and 300 Myr. So we assume that the star and the cluster formation events coincide.
The most recent star formation in the regions studied here is found to be around 100 Myr, except for region 5. Star clusters also show an episode of cluster formation around this time. In the case of region 2, the cluster formation episode has occurred at about 125 Myr, and for region 5, it has occurred at about 40 Myr. In two regions one cluster each have been found, with ages less than 30 Myr, the corresponding star formation event is not seen in the CMDs. This probably would indicate that this latest star formation event, which resulted within the last 30 Myr is probably an isolated event, producing very less number of field stars.
Girardi et al. g95 (1995) estimated the age distribution of star clusters in LMC. They found three periods of enhancement in the formation of star clusters in LMC, namely at 0.1 Gyr, 1–2 Gyr and 12 – 15 Gyr. The cluster formation episodes identified in this study is in good agreement with the above results, but identified yet another episode of enhanced star cluster formation at 300 Myr. Pietrzynski & Udalski pu00 (2000) found peaks in star cluster formation at 7 Myr, 125 Myr and 800 Myr. They also found peaks at 100 Myr and 160 Myr, which they attribute to the last encounter of the Magellanic Clouds.
It is of interest to look for any correlation in star/cluster formation events between the regions studied here, especially when the first four regions are not very far from one another. The regions 1 and 2 are separated by about 200 pc, and we see that the number of clusters around these regions are very similar. The star formation has started a bit early in region 2 and this region did not experience the 300 Myr episode of star formation. Therefore there is only very little similarity between the star formation as well as cluster formation events around the regions 1 and 2, though the number of star clusters found are similar. Again, the number of clusters identified near the regions 3 and 4 are very similar and the separation between these two regions is also about 200 pc. The fraction of clusters formed at each age bin is also similar. The star formation is found to have started a bit early in region 3. Both the two regions have experienced the 300 Myr episode of star formation. Region 3 ended the star formation relatively early. Therefore we see that the star formation and the cluster formation events in these two regions are well correlated. Therefore it is quite likely that the regions three and four underwent very similar cluster and star formation events. The separation between the left and the right extreme points of regions 3 and 4 are about 1 Kpc. We see that the cluster formation events are well corelated within a length scale of 1 Kpc. This is similar to the length-scale found in the super giant shell LMC 4, which is found to have a diameter of 1 Kpc (de Boer et al. b98 (1998)). This might suggest that similar processes or cluster formation events have taken place in the past in LMC.
A look at the cluster fraction with respect to age, in regions 5 and 6 reveal that these two regions have quite different age distribution of clusters. The region 5 is located well within the Bar and the SFH is very different. This region seems to have experienced continuous star formation as well as cluster formation, thoughout from 4 Gyr to 40 Myr. This probably is due to the fact this is the central region, and likely to have had constant supply of molecular clouds. The star formation occurring around this region, could also have kept the star formation going on in this region. Also to be noticed is the high density of stars found in this region, compared to the other regions studied here.
4.2 Star formation events and LMC interactions
We see from this study that three star formation events could be identified from the CMDs of the field stars. And we find that the populous star clusters around the regions also follow these three events. This trend is seen in all the 6 regions studied here. One region (region 5) is found to have experienced continuous star formation. As it is located at the center of the bar, it is likely that the star formation events in this region are unaffected by the factors influencing the rest of the LMC.
The correlated star and cluster formation events which we see can be due to some common triggering. These events could be due to some external factors affecting the LMC. The most quoted and looked into mechanism for this, is the interaction between LMC, SMC and the Galaxy. There are many studies which look for the signatures of possible encounters (Westerlund w97 (1997) and references therein, Maragoudaki m01 (2001)) and also studies which do simulation of the dynamics of the interaction between the three galaxies (Fujimoto & Murai fm84 (1984), Gardiner & Neguchi gn96 (1996), Gardinet et al. g94 (1994)). These have found that the LMC had an interaction with our Galaxy at about 1.5 Gyr ago, with SMC at 0.2 – 0.4 Gyr and LMC had a perigalacticon at 100 Myr. The close encounters between LMC and SMC were expected to have occured at 1.5 Gyr, 3–4 Gyr, 5–6 Gyr, 7–8 Gyr and finally 10 Gyr ago (Vallenari v97 (1997)).
The star formation which started at 4 Gyr in LMC central regions does not seem to have created star clusters. The 4 Gyr population is mainly seen inside the Bar region of LMC and there are indications that the star formation started a little later in the outer regions of LMC, especially in the northern regions (see Subramaniam & Anupama sa02 (2002), Vallenari v97 (1997)). The star formation, even in the outskirts of the Bar is found to have started a little later, like 3.2 Gyr, 2.5 Gyr etc.. Probably the 4 Gyr star formation is mainly associated with the Bar. It will be interesting to find out whether the 4 Gyr star formation episode corresponds to the formation of the Bar in LMC. The populous star clusters are formed somewhere between 1 and 3 Gyr. One does not know whether this cluster formation event has anything to do with the LMC-SMC-Galaxy interaction at about 1.5 Gyr.
The 300 Myr cluster formation episode is seen in the whole of LMC and also in SMC (Maragoudaki et al. m01 (2001)), confirming that the both the galaxies are affected. It is quite clear that the star formation and the cluster formation events in LMC and SMC were started due their interaction. Therefore, it is quite likely that the populous star clusters formed at this time are as a result of star formation mechanisms due to interactions. Some clusters could also have been formed due to the propagating star formation started by the triggers. Similarly, the star and the cluster formation episodes seen around 100 Myr could be due to the perigalacticon passage of LMC. This could have triggered the star formation events, leading to the formation of populous star clusters. Probably this event triggered star formation in SMC as well. To summarise, this study shows that, among the three episodes of correlated star and cluster formation events, two seems to have started due to the interaction of LMC with Galaxy or SMC. A proper understanding of the dynamical history of the LMC, SMC and Galaxy will probably shed some light on the possible reasons for the 4 – 2.5 Gyr star and cluster formation episodes.
5 Conclusions
The present study focussed on the correlaton between star and cluster formation in six regions of the LMC. The results are summarised blow:
-
1.
The star formation around few tens of parsec and cluster formation around 400 pc centered at six regions are studied. It is seen that in all the six regions, the star formation events and the cluster formation events are more or less correlated. Though coresponding to the youngest clusters, aged less than 30 Myr, no stellar population is seen.
-
2.
The cluster formation events and the fraction of star clusters formed at these events were found to be very similar for the two regions located to the south-east of the Bar. This might suggest that these regions experienced similar cluster formation triggers at almost similar instances.
-
3.
The major star formatoin events are found to be three in most of the regions studied here. The star formation which began about 4 Gyr ago, continued upto around 1 Gyr, or continued further. The other two events have taken place around 300 Myr, and at 100 Myr.
-
4.
Two of the above three events seem to correlate with the interactions of LMC with SMC and Galaxy, except the 4 Gyr event. The cluster and the star formation events at 300 Myr and 100 Myr are likely to be triggered by the galaxy interactions. Therefore, the populous star clusters formed at these instances are likely to be the product of star formation mechanisms due to triggers arising from interactions and some from the propagation of these events.
References
- (1) Bertelli,G., Bressan, A., Chiosi, C., Fagotto, F., Nasi, E., 1994, A&AS, 106, 275
- (2) Bica, E., Claria, J.J., Dottori, H., Santos, J.F.C.JR., Piatti, A.E., 1996, ApJ, 102, 57
- (3) Bica, E., Schmitt H.R., Dutra, C.M., Oliveira, H.L., 1999, AJ, 117, 238
- (4) de Boer, K.S., Braun, J.M., Vallenari, A., Mebold, U., 1998, A&A, 329, L49
- (5) Dolphin, A.E., 2000, MNRAS, 313, 281
- (6) Feitzinger, J.V., Glassgold, A.E., Gerola, H., Seiden, P.E., 1981, A&A, 98, 371
- (7) Fujimoto, M., Murai, T., 1984, IAU Symp. 108, p. 115
- (8) Gardiner, L. T., Sawa, T., Fujimoto, M., 1994, MNRAS, 266, 567
- (9) Gardinet L. T., Noguchi, M., 1996, MNRAS, 278, 191
- (10) Girardi, L., Chiosi, C., Bertelli, G., Bressan, A., 1995, A&A, 298, 87
- (11) Maragoudaki, F., Kontizas, M., Morgan, D.H., Kontizas, E., Dapergolas, A., Livanou, E., 2001, A&A, 379, 864
- (12) Olsen, K.A.G., Hodge, P.W., Mateo, M., Olszewsky, E.W., Schommer, R.A., Suntzeff, N.B., Walker, A.R., 1998, MNRAS, 300, 665
- (13) Olsen, K.A.G., 1999, AJ, 117, 2244
- (14) Pietrzynski, G., Udalski, A., Kubiak, M., Szymanski, M., Wozniak, P., Zebrun, K., 1999, Acta Astron., 49, 521
- (15) Pietrzynski, G., Udalski, A., 2000, Acta Astron., 50, 337
- (16) Searle, L., Wilkinson, A., Bagnoulo, W., 1980, ApJ, 239, 803
- (17) Subramaniam, A., Anupama, G.C., 2002 (submitted to A&A)
- (18) Udalski, A., Soszynski, I., Szymanski, M., Kubiak, M., Pietrzynski, G., Wozniak, P., Zebrun, K., 1999, Acta Astron., 49, 223
- (19) Udalski, A., Szymanski, M., Kubiak, M., Pietrzynski, G., Soszynski, I., Wozniak, P., Zebrun, K., 2000, Acta Astron., 50, 307 (OGLE II data)
- (20) Vallenari, A., 1997, ASP. conf. Series. Vol. 112., p. 109
- (21) van den Bergh, S., 1999, IAU Symp., Vol. 190., p. 569
- (22) Westerlund, B. E., 1997, The MAgellanic Clouds (Cambridge: Cambridge Univ. Press)
- (23) Zaritsky, D., Harris, J., Thompson, I., 1997, AJ, 114, 1002