XMM-Newton Reflection Grating Spectrometer Observations of Discrete Soft-X-ray Emission Features from NGC 1068
Abstract
We present the first high-resolution, soft-X-ray spectrum of the prototypical Seyfert 2 galaxy, NGC 1068. This spectrum was obtained with the XMM-Newton Reflection Grating Spectrometer (RGS). Emission lines from H-like and He-like low-Z ions (from C to Si) and Fe L-shell ions dominate the spectrum. Strong, narrow radiative recombination continua (RRC) for several ions are also present, implying that most of the observed soft-X-ray emission arises in low-temperature plasma ( few eV). This plasma is photoionized by the inferred nuclear continuum (obscured along our line of sight), as expected in the unified model of active galactic nuclei (AGN). We find excess emission (compared with pure recombination) in all resonance lines (1snp) up to the photoelectric edge, demonstrating the importance of photoexcitation as well. We introduce a simple model of a cone of plasma irradiated by the nuclear continuum; the line emission we observe along our line of sight perpendicular to the cone is produced through recombination/radiative cascade following photoionization and radiative decay following photoexcitation. A remarkably good fit is obtained to the H-like and He-like ionic line series, with inferred radial ionic column densities consistent with recent observations of warm absorbers in Seyfert 1 galaxies. Previous Chandra imaging revealed a large (extending out to pc) ionization cone containing most of the X-ray flux, implying that the warm absorber in NGC 1068 is a large-scale outflow. To explain the ionic column densities, a broad, flat distribution in the logarithm of the ionization parameter () is necessary, spanning –3. This suggests either radially-stratified ionization zones, the existence of a broad density distribution (spanning a few orders of magnitude) at each radius, or some combination of both.
Subject headings:
galaxies: individual (NGC 1068) — galaxies: Seyfert — line: formation — X-rays: galaxies1. Introduction
In the unified picture of active galactic nuclei (AGN) (Miller & Antonucci 1983; Antonucci & Miller 1985; Antonucci 1993), the soft-X-ray spectra of Seyfert 2 galaxies are expected to be affected by emission and scattering from a medium strongly influenced by the nuclear continuum. However, soft X-rays can also be produced through mechanical heating, as in shocks driven by supernova explosions in nuclear star-forming regions, or shocks created in or by outflowing material. It is quite plausible that both effects are important, i.e., the spectra contain a combination of separate components of warm plasma whose emission is predominantly “radiation-driven” (dominated by photoionization and photoexcitation) and hot plasma whose emission is predominantly “collision-driven” (dominated by electron-impact ionizations and excitations at a temperature consistent with the observed line energies). Since the same ionic transitions are expected in both types of plasma, distinguishing between these different emission mechanisms with the limited CCD-type spectral resolution available on previous observatories has not been possible.
A recent, high-resolution Chandra HETGS spectrum of the Seyfert 2, Markarian 3, showed unambiguously that much of the soft-X-ray emission from that source is produced through radiative recombination in photoionized plasma Sako et al. 2000b . Several resonance transitions (1snp), though, were stronger than expected for pure recombination. An additional, hot, collisionally-ionized component was suggested by this excess. However, the lack of accompanying strong Fe L-shell lines argued against that possibility, and was instead consistent with recombination in a photoionized plasma Kallman et al. (1996). Sako et al. (2000b) pointed out that the same nuclear continuum responsible for photoionizing the plasma may also photoexcite the ionic resonance transitions, producing line emission through radiative decay back to the ground state Krolik & Kriss (1995). Therefore, they asserted that the soft-X-ray emission from Markarian 3 could be explained in its entirety as reemission in warm plasma both photoionized and photoexcited by the inferred nuclear continuum. This model is consistent with reprocessed emission from the warm absorbing medium typically observed in Seyfert 1 galaxies, but now viewed from a different angle.
In this paper, we present the first high-resolution X-ray spectrum of the prototypical Seyfert 2 galaxy NGC 1068. NGC 1068 has a rich observational history, starting with its original, though less commonly used, designation as M77 Messier (1850). Various independent studies in the optical early on confirmed its “nebular”-type emission-line spectrum Fath (1909); Slipher (1917); Hubble (1926). It appeared as the first object in Seyfert’s historic list Seyfert (1943) and, more recently, provided the first convincing evidence for a unified model of AGN Antonucci & Miller (1985). Extensive studies at all wavelengths have upheld this model: broad optical emission lines in polarized light Antonucci & Miller (1985), the existence of highly collimated bipolar radio jets (Wilson & Ulvestad 1982; Wilson & Ulvestad 1983; Pedlar et al. 1989), biconical O III emission regions Ebstein et al. (1989), reflected X-ray emission of an obscured nucleus (Monier & Halpern 1987; Elvis & Lawrence 1988; Koyama et al. 1989), and a soft-X-ray component that lies significantly above the reflected continuum (Marshall et al. 1993; Ueno et al. 1994).
We show below — using a new, simple radiative transfer code — that the soft-X-ray spectrum of NGC 1068, obtained with the XMM-Newton Reflection Grating Spectrometer (RGS), can be explained in its entirety as emission from warm, irradiated plasma (as in Markarian 3), which reprocesses the nuclear continuum incident on it through recombination/radiative cascade following photoionization and radiative decay following photoexcitation.
The format of our paper is as follows. In §2 we begin with a discussion of the observations and data analysis. Detailed spectral analysis is presented in §3, followed by interpretation in terms of possible emission mechanisms in §4. In §5, we discuss a novel method for inferring geometrical/dynamical properties of the ionization cone from the observed relative amount of photoionization versus photoexcitation. We discuss the remarkably consistent fits we obtain using this method in §6. Finally, in §7, we discuss the implications of these fits, including the connection between the observed large-scale ionization cone and generic warm absorbers.
2. Observations and Data Reduction
NGC 1068 was observed with XMM-Newton for 110 ks starting at 5:48:05 UT on 2000 July 29. Data were taken simultaneously for the EPIC detectors MOS and PN, the optical monitor, and the RGS. All data were processed with the XMM-Newton Science Analysis Software, SAS 5.2, with the corresponding calibration files available for that version. We concentrate in this paper mainly on the data from the RGS, which was operated in its normal spectroscopy mode. However, in order to confirm the negligible effect of source size and position on the extracted RGS spectrum, we also present a cursory analysis of the PN image below.
The RGS covers the wavelength range of approximately 6 to 38 Å (– keV) with a resolution of 0.05 Å, and a peak effective area of about 140 cm2 at 15 Å. The SAS filters the observed RGS events in dispersion channel versus CCD-pulse-height space to separate the spectral orders. The background is estimated using events from a region spatially offset from the source. The wavelengths assigned to the dispersion channels are based on the pointing and geometry of the telescope with an overall accuracy of 8 mÅ (1-) across the total wavelength range, which is 120 km s-1 at 20 Å. Similarly, the estimated uncertainty in line broadening is 5 mÅ (1-), which is 75 km s-1 at 20 Å. Based on ground calibration, we expect the 1- uncertainty in the effective area to be less than 10% above 9 Å and at most 20% for shorter wavelengths den Herder et al. (2001, 2002).
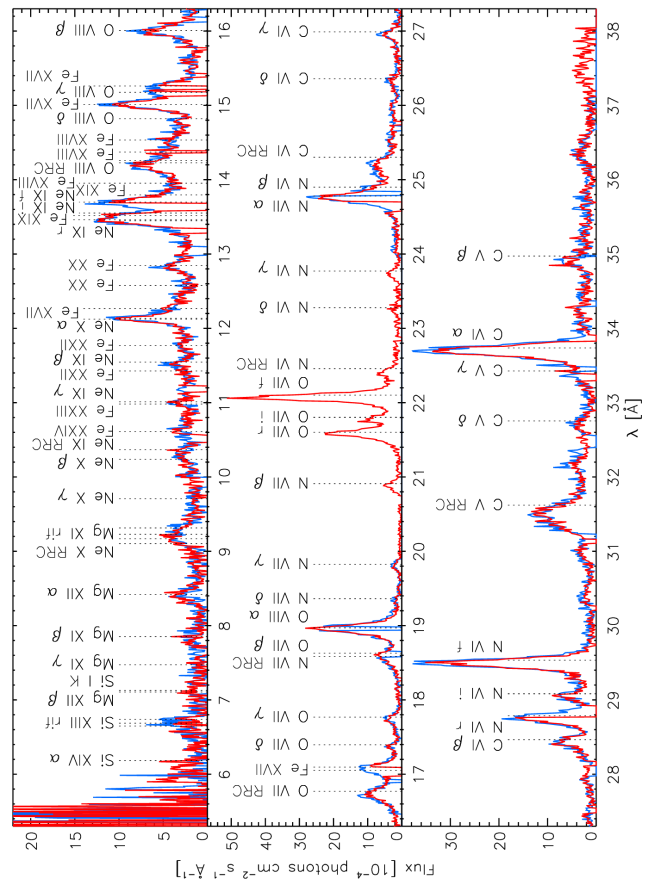
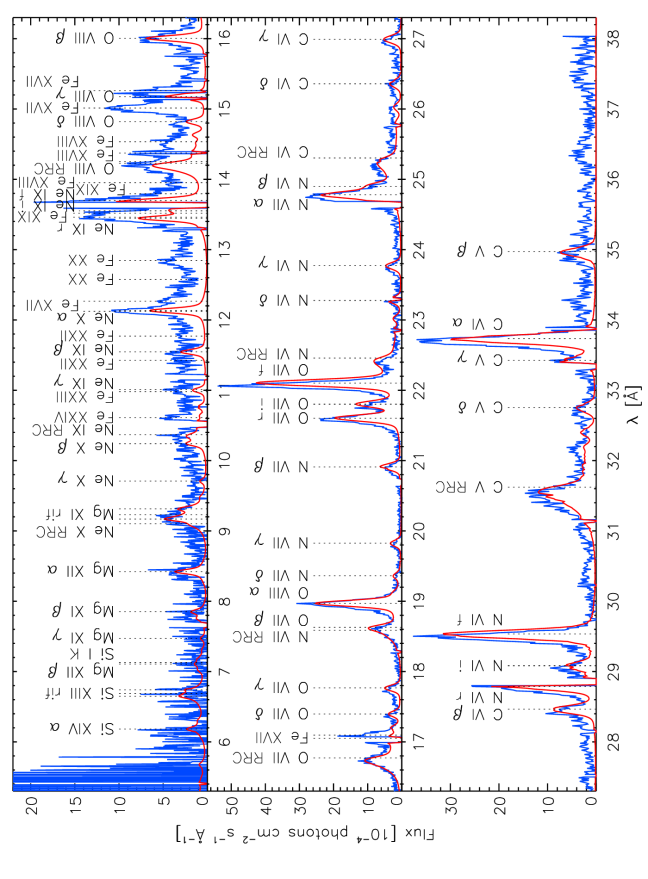
Independent, fluxed spectra from the RGS 1 (red) and RGS 2 (blue) instruments for all 110 ks of data for the order are presented in Fig. 1. The spectral discontinuities are due to chip gaps, bad pixels, and the previous in-flight loss of one CCD for RGS 2 (–24 Å). Overall, the fluxed spectra agree to %.
3. Spectral Analysis
3.1. Line Emission
The soft-X-ray spectrum of NGC 1068 (Fig. 1) is dominated by line emission. Emission lines from H-like and He-like C, N, O, Ne, Mg, and Si are all clearly detected. Numerous Fe L-shell emission lines (Fe XVII to Fe XXIV) are present as well. Many higher-order resonance transitions (1snp) in H-like and He-like ions labelled Ly– and He–, respectively, are prominent, with evidence for strong emission from even higher order transitions as well. Several unidentified features located in the bottom panel of Fig. 1 (e.g., at 27.92, 30.4, 34.0–34.6, and 36.38 Å) are likely due to L-shell emission from mid-Z ions such as Si or S. A bright fluorescent line for Fe K is observed in the MOS/PN CCD-resolution data, but the RGS does not extend in wavelength down to Fe K. We report marginal detection of the fluorescent line of neutral Si in the RGS spectrum; there is no other evidence for any other significant fluorescent line emission. We see no significant continuum emission in the spectrum.
3.2. Line Table
By performing joint fits to the separate and orders within XSPEC Arnaud (1996), we have measured line fluxes, widths, and shifts for all relatively bright lines which have been unambiguously identified (Table XMM-Newton Reflection Grating Spectrometer Observations of Discrete Soft-X-ray Emission Features from NGC 1068). The measured fluxes take into account the Galactic column density of cm-2 Dickey & Lockman (1990) using the neutral absorption model tbabs (Wilms, Allen, & McCray 2000) in XSPEC. Line shifts are measured with respect to the systemic redshift of NGC 1068 of or km s-1 (Huchra, Vogeley, & Geller 1999).
The brightness of NGC 1068 coupled with the duration of the observation, implies that all the listed errors (representing 1-) of the unblended lines are dominated by instrumental uncertainty (see §2) and not by counting statistics. For example, there are approximately 6050 and 1880 total counts in the O VII forbidden line (RGS 1 alone) and the Ne X Ly line (RGS 1 and RGS 2), respectively, implying counting errors of 1.3% and 2.3%; these errors are much less than the effective area uncertainty of 10%.
3.3. Line Shifts and Widths
We find that most emission lines in the RGS spectrum are shifted and appear broader than expected for monochromatic lines (Table XMM-Newton Reflection Grating Spectrometer Observations of Discrete Soft-X-ray Emission Features from NGC 1068).
The line shifts are due to velocity shifts at the source and not, for example, due to an absolute pointing error. The position of the nominal centroid of the X-ray emission in the PN image with a CCD-determined energy cut consistent with the RGS waveband (Fig. 2) has been used to derive the RGS spectrum. Gaussian fits to the PN image using several different CCD-resolution energy cuts yield centroids all within 0″.5 of each other, proving that possible spatial stratification of different emission zones is insignificant. The overall positional uncertainty between the PN and RGS instruments is less than the absolute pointing uncertainty of the telescope of 4″, implying a robust upper limit on the line shift uncertainty of 8 mÅ (120 km s-1 at 20 Å).
Significant velocity blueshifts from roughly to km s-1 have been measured from the RGS spectrum (Table XMM-Newton Reflection Grating Spectrometer Observations of Discrete Soft-X-ray Emission Features from NGC 1068). Line blueshifts of each ionic line series are fairly consistent. Longer wavelength lines appear to have higher blueshifts. Overall, the observed blueshifts are comparable to blueshifts of optical/UV emission lines (Grimes, Kriss, & Espey 1999; Kraemer & Crenshaw 2000), though, in contrast to these observations, we find no evidence for any significant redshifts.
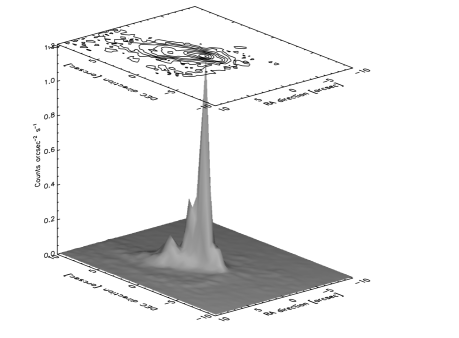
The widths we measure are similarly due to intrinsic velocity distributions at the source. A Chandra image of NGC 1068 (Young, Wilson, & Shopbell 2001) shows evidence for weak extended emission on scales of tens of arcseconds (Fig. 3). The effect of spatial broadening in the RGS spectrum for this source, characterized by a strongly peaked central component and weak extended emission, is negligible (A. Rasmussen, private comm.). Therefore, any excess broadening of particular lines can only be due to velocity distributions at the source. Measured velocity widths are also presented in Table XMM-Newton Reflection Grating Spectrometer Observations of Discrete Soft-X-ray Emission Features from NGC 1068. All widths lie in the range – km s-1, which is consistent with the linewidths associated with the narrow-line-emitting regions observed in the UV (Grimes, Kriss, & Espey 1999).
3.4. Radiative Recombination Continua
The spectrum also includes very distinctive radiative recombination continua (RRC) for H-like and He-like C, N, and O, which are produced when electrons recombine directly to the ground state of these highly-ionized species. RRC are broad features for hot, collisionally-ionized plasma, but are narrow, prominent features for cooler photoionized plasma. The narrow width of these RRC provide a direct measure of the recombining electron temperature Liedahl & Paerels (1996); Liedahl (1999).
For those RRC which are clearly detected (C V, C VI, N VI, N VII, O VII, and O VIII), we were able to determine accurate temperatures from the RRC profile itself (Table XMM-Newton Reflection Grating Spectrometer Observations of Discrete Soft-X-ray Emission Features from NGC 1068). The unblended RRC (on the short wavelength side) of C V and O VII provide the best temperature determinations. For the other RRC, the dominant source of uncertainty comes from blending with other nearby lines. All temperatures are consistent with the conservative range of few eV. These temperatures imply velocity broadening of all features by km s-1. This broadening is much lower than the observed broadening of km s-1, implying the importance of bulk and/or turbulent cloud velocities.
Higher temperatures of –30 eV were inferred from the broad, polarized, electron-scattered optical lines (Miller, Goodrich, & Mathews 1991). But these temperatures are really only upper limits, since nonthermal broadening due to bulk and/or turbulent cloud velocities, as observed in the X-ray, could also be present.
Weak features at the positions of the RRC from Ne IX and Ne X are also detected, though severe blending makes a temperature determination difficult in these cases. Their inferred temperatures are not necessarily discrepant with the range given for the other ions, though significantly hotter temperatures cannot be excluded.
3.5. Higher-order Series Lines
In addition to the prominent transitions in the H-like and He-like ions, the unique combination of high resolution and large effective area characteristic of the RGS allows for the detection and flux measurement of several discrete higher-order resonance transitions (np1s), as well as blended higher-order transitions leading up to the RRC edge. For the H-like ions, we list the observed ratios of these transitions to the Ly line in Table XMM-Newton Reflection Grating Spectrometer Observations of Discrete Soft-X-ray Emission Features from NGC 1068, where we also give the ratios expected for recombination in a warm, photoionized plasma and for hotter plasma in collisional equilibrium. For the He-like ions, we list the observed ratios of these transitions to the forbidden line in Table XMM-Newton Reflection Grating Spectrometer Observations of Discrete Soft-X-ray Emission Features from NGC 1068, together with the ratios expected for recombination. Here, we do not provide the ratios expected for a hotter plasma in collisional equilibrium, because the strong dependence of the relative strength of the forbidden line on temperature would make that comparison meaningless.
3.6. He-like Triplet Ratios
For He-like N and O, we present measurements of the standard plasma diagnostic ratios and Gabriel & Jordan (1969) in Table XMM-Newton Reflection Grating Spectrometer Observations of Discrete Soft-X-ray Emission Features from NGC 1068, where , , and are the resonance, intercombination, and forbidden line fluxes. Also listed are the ratios expected for recombination in a warm, photoionized plasma and for hotter plasma in collisional equilibrium.
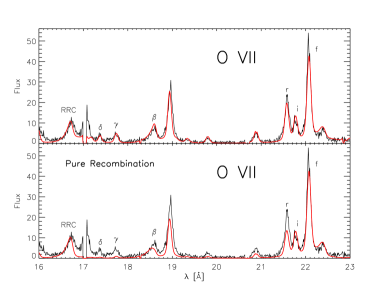
4. Interpretation of the Observed Spectral Features
Unambiguous evidence for the predominance of emission in a photoionized plasma comes primarily from the observed bright RRC, which indicate recombination at a temperature around a few eV. In addition, as we explain in detail below, the ratios of the intercombination and forbidden lines to the RRC are very close to the values expected for pure recombination (see §6.2 and bottom panel of Fig. 10). The ratio for N VI (Table XMM-Newton Reflection Grating Spectrometer Observations of Discrete Soft-X-ray Emission Features from NGC 1068) also appears to favor pure recombination, though the ratio for O VII is somewhat ambiguous (see §6.2).
The anomalous He-like -ratios (Table XMM-Newton Reflection Grating Spectrometer Observations of Discrete Soft-X-ray Emission Features from NGC 1068), however, are grossly inconsistent with pure recombination, suggesting an additional component and/or mechanism. An additional, weak collisionally-ionized plasma component, whose He-like triplets generically exhibit a higher resonance line intensity compared to the intercombination and forbidden lines, could explain these effects. However, such a component would not only enhance the resonance line, but all lines in the triplet, thereby overpredicting the intercombination and forbidden line fluxes relative to the RRC. This interpretation is marginally ruled out by the triplet to RRC ratio in the RGS data.
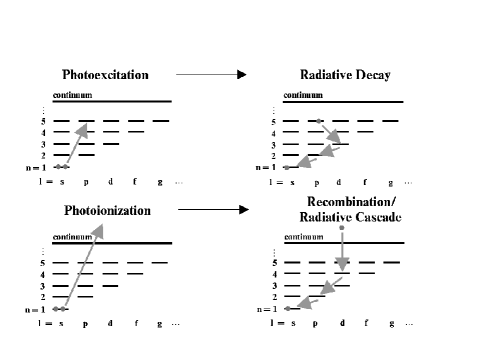
Similarly ambiguous ratios were previously observed in the Chandra HETGS spectrum of the Seyfert 2, Markarian 3. Sako et al. (2000b) argued against the presence of an additional collisionally-ionized plasma component due to the observed weakness of the Fe L shell emission, which was consistent with recombination in a photoionized plasma Kallman et al. (1996). Instead, Sako et al. (2000b) suggested that the enhanced resonance lines were due to photoexcitation (see Fig. 4 for a schematic of the relevant atomic processes). This argument is sensitive to the Fe abundance; however, Sako et al. (2000b) noted that a rather unlikely order-of-magnitude underabundance of Fe would be necessary to be consistent with the presence of additional hot collisionally-ionized plasma.
For NGC 1068, we propose a cleaner test based solely on each particular ionic line series. The key to robustly distinguishing between photoexcitation and additional collisionally-ionized plasma components lies in the higher-order series line strengths. We illustrate this new method in Fig. 5. Starting with a pure recombination spectrum, we add in photoexcitation (self-consistently, as presented below in §5) or a separate collisionally-ionized plasma component. The addition of photoexcitation enhances all resonance transitions, whereas the addition of collisionally-ionized plasma primarily enhances only the triplet lines (with more weight on the resonance line of the triplet).
The ratios of higher-order-series lines to Ly for C VI, N VII, and O VIII shown in Table XMM-Newton Reflection Grating Spectrometer Observations of Discrete Soft-X-ray Emission Features from NGC 1068 are significantly higher than those expected for collisional ionization equilibrium (CIE), though they are not entirely consistent with pure recombination (REC) either. Photoexcitation boosts all lines in this series including Ly, but its effect is dependent on the column density and velocity distribution, so it must be modeled carefully.
However, the forbidden line in He-like ions is unaffected by photoexcitation, allowing for a measure of the significance of photoexcitation of higher-order-series transitions with respect to the forbidden line, which is fed through recombination after photoionization. Comparison of the ratios of these higher-order-series lines to the forbidden line (Table XMM-Newton Reflection Grating Spectrometer Observations of Discrete Soft-X-ray Emission Features from NGC 1068) with similar ratios for plasma in collisional equilibrium is not as useful due to the significant temperature sensitivity of . However, ratios for plasma in collisional equilibrium are generally comparable to or lower than ratios for pure recombination (Fig. 5). Therefore, the excess strength of the higher-order lines, especially the He and He, can only be explained by photoexcitation.
5. Novel Diagnostics from Photoionization and Photoexcitation Rates
We now show that the relative amount of photoionization versus photoexcitation inferred from the soft-X-ray spectrum of NGC 1068 provides detailed information about the geometry of absorbing/reemitting material around the central, power-law-continuum source.
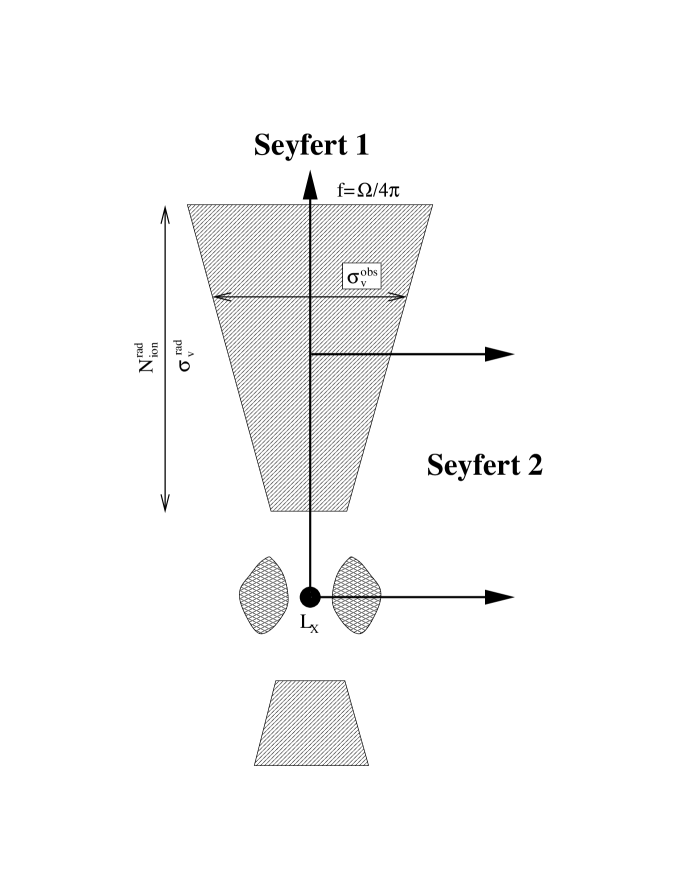
In the unified model of active galaxies, the observable properties of a particular AGN depend primarily on orientation. The soft-X-ray warm absorber observed in Seyfert 1 galaxies, therefore, should show itself in reemission for the roughly perpendicular line of sight to Seyfert 2 galaxies (see Fig. 6). For the Seyfert 1 view, the relative amount of edge absorption versus line absorption depends greatly on the column density through the material. Thus, the Seyfert 2 spectrum should similarly be sensitive to the radial column density, since each photoionization is balanced by recombination/radiative cascade, and each photoexcitation is similarly balanced by radiative decay. Therefore, the shape of the reemitted Seyfert 2 ionic line series can be used to infer the radial (or Seyfert-1-observed) ionic column densities through the warm absorber.
For low radial ionic column density, , all lines and photoelectric edges remain unsaturated. For a H-like or He-like ion, the summed oscillator strength for transitions to discrete levels is roughly comparable to the integrated oscillator strength for transitions to the continuum (e.g., Bethe & Salpeter 1977), implying roughly similar amounts of radiative decay following photoexcitation and recombination/radiative cascade following photoionization (modulated by the shape of the continuum at the relevant photoexcitation/photoionization energies).
For higher , the low-lying, high-oscillator-strength transitions are the first to saturate, leading to a “tilting” of the photoexcitation contribution to the Seyfert 2 spectrum to lower-oscillator-strength, higher-order-series transitions. This can simply be thought of as the standard “curve of growth,” except now observed indirectly through reemission. Due to this gradual line saturation and the fact that the edge always saturates last, it is evident that an increase in implies an increase in the overall relative importance of photoionization compared to photoexcitation.
At very high , all discrete transitions are fully saturated and the reemitted spectrum is that of pure recombination following photoionization. In the following discussions, these qualitative arguments are made more explicit.
5.1. Radial Ionic Column Density
The dependence of our model ionic spectra on radial ionic column density, , is illustrated in Fig. 7. Here we show the effect of varying for He-like O VII.
The Seyfert 1 and Seyfert 2 views are shown in the top three panels on the left and the right of Fig. 7, respectively, for different radial ionic column densities. The total edge absorptions (photoionizations) and line absorptions (photoexcitations) in the Seyfert 1 view yield the expected amounts of recombination/radiative cascade following photoionization and radiative decay following photoexcitation in the Seyfert 2 view. Note the relative strength of the lines to the RRC and the effect of saturation on the high-oscillator-strength, lower-order-series transitions. In particular, note the strong variation in the relative strength of the resonance line in the He-like triplet as a function of optical depth, illustrating that the triplet, by itself, is a poor diagnostic for determining whether or not hotter, collision-driven plasma (which would show a strong resonance line) is present (see Fig. 5).
5.2. Radial Velocity Width
The radial velocity width specified by is a model parameter. There is little a priori reason to believe that should be identical to the observed velocity width of the lines, , viewed perpendicular to the cone (see Fig. 6). For this reason, we keep a free parameter. The effect of varying is illustrated in Fig. 8. Increasing by a certain factor leads to a roughly similar increase (depending on the line saturation or position on the “curve of growth”) in all photoexcited lines. This is in contrast to variations in , which primarily lead to a “tilting” of the photoexcitation contribution, since, one-by-one, each line, in descending order of oscillator strength, is eventually saturated. The velocity width we invoke here may be due to a turbulent velocity in the plasma or simply due to different bulk velocities of multiple absorption systems.
6. Fits using an Irradiated Cone Model
We have constructed a self-consistent model of an irradiated cone of plasma for application to the NGC 1068 soft-X-ray spectrum. This model applies to all significant H-like and He-like ions, employing atomic data obtained from the Flexible Atomic Code (FAC) Gu (2002). (A detailed study of the more complicated Fe L-shell transitions is left for the future.) To simplify fitting, we have incorporated our model into XSPEC Arnaud (1996) as the local model photo111http://xmm.astro.columbia.edu/research.html Kinkhabwala et al. (2002).
In our model, we allow for individual line absorption, but assume that photoelectric absorption is negligible. With this assumption, we can simplify the calculations by irradiating each ionic column density separately with an initially unabsorbed power law (discrete line absorption due to all other ions can safely be neglected, since it removes flux from only a small portion of the total spectrum). Alternatively, using the method employed by our model, we can irradiate all ionic column densities together, assuming all ions have the same radial distribution. We have checked that both methods produce the same reprocessed spectrum as long as all photoelectric edges have low optical depths. (The radial ionic column densities we infer from the spectrum of NGC 1068 are indeed consistent with the assumption of negligible photoelectric absorption, as we argue below.) Furthermore, we assume that the plasma is optically thin to reemitted photons (see §7.3).
Our model consists of three free parameters for each ion, the radial velocity width , the covering factor times nuclear luminosity , and the ionic column density . The covering factor, expressed in terms of the solid angle subtended by the plasma, is , and the total power-law luminosity (where, throughout, we assume reasonable values for the index of and energy range of 13.6 eV–100 keV) is . In order to convert observed flux to luminosity, we take the distance to NGC 1068 to be 14.4 Mpc Bland-Hawthorn et al. (1997).
We assume the following values for the radial velocity width of km s-1 and the overall normalization of ergs s-1 are the same for all the ions (discussed further in 6.3). The individual ionic column densities, , are left free for each ion.
The RRC temperatures are directly observed (Table XMM-Newton Reflection Grating Spectrometer Observations of Discrete Soft-X-ray Emission Features from NGC 1068). Also, the velocity widths of all emission lines transverse to the cone are directly observed (Table XMM-Newton Reflection Grating Spectrometer Observations of Discrete Soft-X-ray Emission Features from NGC 1068). For simplicity, we assume a velocity width of km s-1, which works well for all of the observed lines.
A more complete discussion of the atomic calculations and astrophysical assumptions underlying our model is presented in Kinkhabwala et al. (2002).
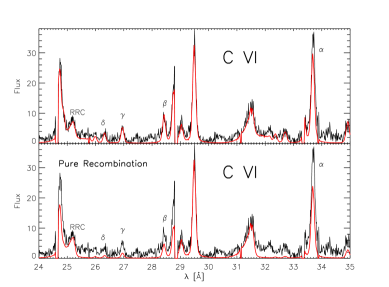
6.1. Fit to H-like C VI
In Fig. 9, we show our fit to the line series corresponding to H-like C VI. In the bottom panel, we show the best fit possible assuming only recombination. Note the gross underprediction of all features relative to the RRC. In the top panel, we self-consistently add in the contribution from photoexcitation assuming the model described above and a column density of C VI of cm-2. The addition of photoexcitation completely explains the excess line strengths.
6.2. Fit to He-like O VII
Similarly, in Fig. 10, we show our fit to the line series corresponding to He-like O VII. In the bottom panel, we show the best fit possible assuming only recombination. Note the marked underprediction of the resonance line and all higher order features relative to the RRC. We note that the ratio given in Table XMM-Newton Reflection Grating Spectrometer Observations of Discrete Soft-X-ray Emission Features from NGC 1068 is greater than expected for pure recombination. This may arise from an additional contribution to the forbidden line due to inner-shell photoionization in O VI (e.g., Kinkhabwala et al. 2002). In the top panel, we self-consistently add in the contribution from photoexcitation assuming the model described above and a column density of O VII of cm-2. Again, all the higher-order-series lines are completely explained by the addition of photoexcitation.
6.3. Final Fit to All H-like and He-like Ion Series
Our fit to all H-like and He-like ions in the spectrum as a whole (neglecting Fe L shell emission) is presented in Fig. 11. By “fit,” we simply mean a possible set of parameters that can reproduce the spectrum in detail. Though photo is a local model in XSPEC, the interdependent, multicomponent nature of fitting with this model does not all for well-defined error bars for our fitted parameters. The best-fit global values for and of 200 km s-1 and ergs s-1, respectively, were found by trial and error. Attempts were made to fit the spectrum using km s-1 and km s-1 with global normalization and individual column densities left free. However, the details of the higher-order transitions for any given ion were less satisfactorily fit. An estimate for the model parameter uncertainty, therefore, gives roughly a factor of two for all inferred model parameters: , , and . Ratios of individual column densities, however, are much better determined (ranging from a few percent to a few tens of percent). Of course, parameters such as and the RRC temperatures are directly observed with error bars quoted in Tables XMM-Newton Reflection Grating Spectrometer Observations of Discrete Soft-X-ray Emission Features from NGC 1068 and XMM-Newton Reflection Grating Spectrometer Observations of Discrete Soft-X-ray Emission Features from NGC 1068.
Assuming km s-1 and ergs s-1, as well as the observed broadening of km s-1, we provide all other best-fit parameters in Table XMM-Newton Reflection Grating Spectrometer Observations of Discrete Soft-X-ray Emission Features from NGC 1068. For each H-like and He-like ion series, all features (from the transitions up to the RRC) are reproduced very well (Fig. 11) using these parameters. The column densities we infer are indeed consistent with our assumption of negligible photoelectric absorption and, additionally, are consistent (within a factor of a few) with the column densities derived from several recent high-resolution soft-X-ray spectra of Seyfert 1 galaxies Kaastra et al. (2000); Kaspi et al. (2000); Branduardi-Raymont et al. (2001); Sako et al. (2001). The inferred radial velocity distribution of km s-1 is also consistent with the range (–600 km s-1) observed in soft-X-ray spectra of these same Seyfert 1 galaxies. Further inspection of Table XMM-Newton Reflection Grating Spectrometer Observations of Discrete Soft-X-ray Emission Features from NGC 1068 reveals that the H-like and He-like ions of each element have approximately equal column densities; this important observation is discussed further in §7.6. Assuming Solar abundances (Grevesse, Noels, & Sauval 1996; Allende Prieto, Lambert, & Asplund 2001) and a fractional ionic abundance of O VIII of , we obtain a column density in H of cm-2 (see §7.2).
We also give measurements of the emission measure of the recombining plasma () for each ion in Table XMM-Newton Reflection Grating Spectrometer Observations of Discrete Soft-X-ray Emission Features from NGC 1068. For all EM values, we assume that the recombining ion fractional abundance is near maximal at . For C, N, and O, these emission measures are based on the measured RRC temperatures and fluxes. For Ne, Mg, and Si, the EM is based on the arbitrarily chosen temperature of eV. We note that the temperatures for these ions are not likely to be lower than eV, but could easily be an order of magnitude higher (see §7.4), implying the EMs we list are really only lower limits for these ions.
7. Discussion
We have shown that the soft-X-ray spectrum of the prototypical Seyfert 2 galaxy NGC 1068 is dominated by emission from warm plasma irradiated by the nuclear continuum. In addition, we have shown that the relative amounts of photoionization versus photoexcitation for all ionic transition series provide detailed, self-consistent information about the geometry and dynamics of the emission regions, yielding radial column densities, radial velocity widths, and the product of covering factor and nuclear luminosity. The values we obtain for these geometrical properties (in particular, the radial ionic column densities) are remarkably similar to absorption measurements in Seyfert 1 galaxies. We have also shown that there is no measurable additional component due to hot, collisional plasma (e.g., from shocks, a circumnuclear starburst, or a hot confining medium). We can put a robust upper limit to an additional hot, collisional plasma component in NGC 1068 at an order-of-magnitude less than the line luminosities measured in the soft-X-ray spectrum, or cm-3 for temperatures in the range –900 eV. In the following, we explore further relevant astrophysical considerations.
7.1. Radial Filling Factor of the Warm Absorbing Plasma
The Chandra image of NGC 1068 shown in Fig. 12 reveals that a large fraction of the soft-X-ray emission from the ionization cone comes from a region close to the nucleus, as inferred from radio observations. The minimum radius of the ionization cone is clearly pc, but could be much smaller. It is possible that a large fraction of the cone is obscured from our view; however, the observed photoexcitation of low-n, high-oscillator-strength transitions implies that we must be directly viewing the bulk of the ionization cone, since these high-oscillator-strength transitions saturate very quickly (see Fig. 7). This sets a lower limit on the radius of the bulk of the ionization cone which must be greater than the radius of the obscured circumnuclear region.
Using upper limits to the covering factor () and minimum radius ( pc), we can derive an upper limit to the radial filling factor of the plasma , which, by definition, is . We can estimate the column density for a given ion as follows:
| (1) | |||||
where is the elemental abundance, is the fractional ionic abundance, is the minimum radius of the cone measured in parsec, is the radial filling as a function of radius, and is a single number representing the average radial filling in the cone. Assuming the relevant values for C V of (Grevesse et al. 1996), erg cm s-1, and observed column density of cm-2, we obtain . Similarly, assuming the relevant values for O VIII of (Allende Prieto et al. 2001), ergs cm s-1, and observed column density of cm-2, we obtain . Using robust upper limits for the covering factor and the minimum radius from the Chandra image (Fig. 12) of and pc, we obtain upper limits of (plasma at erg cm s-1) and (plasma at ergs cm s-1). The actual filling factor, therefore, is significantly less than unity, suggesting that the X-ray plasma fills only a small portion of the ionization cone.
The number densities for plasma with ionization parameter erg cm s-1 at 500 pc (maximum extent of cone from Fig. 12) down to 1 pc (arbitrarily-assumed minimum radius), taking ergs s-1, are – cm-3. These densities are a factor of ten less for plasma with ergs cm s-1.
7.2. Lack of Electron-scattered Continuum and
We observe no significant electron-scattered continuum. This allows us to obtain an upper limit to the electron column density in the context of our model as follows. From our measured value for the covering factor times nuclear luminosity of ergs s-1 and the assumed distance to NGC 1068 of 14.4 Mpc, we can write the column density in electrons as a function of the normalization of the reflected continuum ( has units of photons cm-2 s-1 keV-1 with in keV) as cm-2. The observed upper limit to the electron-reflected continuum of (using the line-free region between 20.0–20.6 Å) gives cm-2. We have already found a reasonable lower limit to of cm-2 in §6.3. Therefore, assuming H and He are fully stripped, we constrain the neutral column density to be cm cm-2.
7.3. Optical Depth in Transverse Direction
The optical depth in a given line for an approximately spherical cloud determines the average number of scatters a line photon will experience before it is either destroyed or escapes. For significant column density transverse to the cone (i.e., along the Seyfert 2 line of sight in Fig. 6), the higher-order resonance transitions (np1s with ) and photons created by recombination directly to ground will be reprocessed and degraded to transitions Bowen (1935).
Since we do not know the geometry of the scattering regions (e.g., filled cone or isolated clouds), we employ order-of-magnitude estimates. If is the ionic column density and is the line-profile-averaged cross section for a particular transition (taking into account velocity broadening ) in a roughly spherical cloud, then the optical thickness is and the average number of scatters is . Applying these considerations to H-like and He-like series, we find that conversions of Ly to Ly and He to He provide the most sensitive diagnostics. The branching ratios are roughly 0.9 to produce the same photon and therefore 0.1 to cascade differently.
Our final fit to the spectrum of NGC 1068 shown in Fig. 11 assumes that all reemission occurs in optically-thin plasma, i.e., all photons created in the plasma escape with no further reprocessing. Therefore, due to the goodness of the fit, we assume at most a 10% reduction (roughly the limit of detectability) in the Ly and He lines, we plot the upper limit to the ionic optical depth versus for several different ions in Fig. 13. Robust lower and upper limits to of 10 km s-1 and 500 km s-1 are set by thermal broadening ( eV) and the observed line broadening, respectively. He-like ions provide the best upper limits to ionic column densities. Notice that the upper limits (over the entire range in ) to the ionic column densities of C V, N VI, and O VII are consistent-with-to-lower-than the inferred column densities along the cone given in Table XMM-Newton Reflection Grating Spectrometer Observations of Discrete Soft-X-ray Emission Features from NGC 1068 (where we have assumed a radial velocity distribution of km s-1). This may suggest that the radial column density is larger by roughly a factor of a few than the transverse column density, which would be consistent with a narrow cone geometry.
7.4. Electron Temperatures
The electron temperatures we measure directly from the RRC for recombination onto specific ions can be compared with results from self-consistent simulations of photoionized plasma, where photoelectric heating is balanced by line cooling in the plasma. Using the photoionization code XSTAR Kallman & Krolik (1995), we have determined the expected temperature, , versus ionization parameter, , for a spherical, optically-thin plasma with central, ionizing, power-law continuum (, eV, keV). In Fig. 14, we present the expected range in temperature and ionization parameter for all observed H-like and He-like ions. The XSTAR-predicted temperatures agree well with the data.
7.5. Thermal Instability
For a generic photoionized plasma, thermal instabilities may develop. In Fig. 15, we plot the thermal equilibrium curve for the same optically thin plasma (assuming Solar abundances) along which heating equals cooling. The plasma is thermally unstable along segments of the equilibrium curve which have negative slope, since upward deviations from the curve in this region heat the plasma until it reaches the higher stable branch and downward deviations cool the plasma until it reaches the lower stable branch. Comparing both Figs. 14 and 15, we see that several ions present in the spectrum have maximal ionic abundances in this thermally unstable region. This putative thermal instability, therefore, appears problematic for ions in the observed range of ionization parameter, .
We note that thermal instability can be removed if additional heating/cooling mechanisms are at work in the plasma in addition to those associated with photoelectric heating and line cooling. Thermal instability is also sensitive to metal abundance (Hess, Kahn, & Paerels 1997), with low metal abundances effectively removing the instability. The existence of thermal instability in astrophysical photoionized plasmas is presently an open question.
7.6. Ionization Parameter Distribution
In Fig. 16, we present the fractional ionic abundances relative to H and assuming Solar abundances for the elements observed in the RGS spectrum of NGC 1068. No single ionization parameter is capable of explaining the column densities obtained in Table XMM-Newton Reflection Grating Spectrometer Observations of Discrete Soft-X-ray Emission Features from NGC 1068, which shows similar column densities in H-like and He-like ions for each elemental species. The data instead require a broad, flat distribution in ionization parameter of the plasma over the range –3. This distribution in could be due to spatial stratification of ionization zones in a single-density cone Sako et al. 2000a or a broad density distribution at each radius.
Kraemer and Crenshaw (2000b) find that the extended optical/UV absorber is powered by photoionization due to an inferred hidden source of continuum, as we similarly argue for the soft-X-ray emission. These findings, coupled with the remarkable overlap of the soft-X-ray image of the cone with optical observations of O III emission regions (Young et al. 2001), favor an intrinsic density distribution (over at least three orders of magnitude) at each radius. For such a model, a perfectly flat distribution in would give a distribution in densities at each radius of . An intrinsic density distribution in AGN ionization cones has been proposed in the past to explain the optical and UV spectra of generic Seyfert 2 galaxies (e.g., Komossa & Schulz 1997). In X-ray emitting plasmas, such a density distribution may naturally arise in outflows due to thermal instabilities (Krolik & Kriss 2001), which may counter the usual perception of such instabilities on the presence of specific ions in the unstable region (see §7.5).
The upper limits obtained in §7.1 for the radial filling factor do not allow for distinguishing between spatially-stratified ionization zones or an intrinsic density distribution. Robust discrimination between these two models will require future observations and analysis.
7.7. Relative Elemental Abundances
Given the ionization parameter distribution, the inferred ionic column densities can provide estimates of relative elemental abundances. However, even absent knowledge of the exact distribution, some tentative conclusions can be drawn due to the overlap in ionization parameter of specific charge states of different ions.
The necessity of a broad, rather flat range of ionization parameter allows for comparison of overlapping charge states of different elements, such as H-like C and He-like O (see Fig. 16). Overall, we find that all of the well-measured ionic column densities yield relative elemental abundances which are consistent with Solar (Grevesse et al. 1996; Allende Prieto et al. 2001), excluding N, which is overabundant by approximately a factor of three. The column densities of Mg and Si also seem high in the context of a flat ionization parameter distribution. But, due to low counts and blending, their column densities are not well determined, making difficult any robust conclusions concerning their relative abundance.
Furthermore, we note that the abnormally high Fe/O abundance invoked for previous ASCA spectra of NGC 1068 by Netzer & Turner (1997) is not observed. In fact, the O VII and O VIII emission lines are the strongest in the spectrum, especially when compared to Fe L-shell transitions, which are considerably weaker (but not necessarily inconsistent with Solar-abundance photoionized plasma). Fe L-shell line emission in generic photoionized plasma, as well as in NGC 1068, is currently under investigation.
References
- Allende Prieto, Lambert, & Asplund (2001) Allende Prieto, C., Lambert, D. L., Asplund, M. 2001, ApJ, 556, 1, L63
- Antonucci (1993) Antonucci, R. R. J. 1993, ARA&A, 31, 473
- Antonucci & Miller (1985) Antonucci, R. R. J., & Miller, J. S. 1985, ApJ, 297, 621
- Arnaud (1996) Arnaud, K. A. 1996, in ASP Conf. Ser. 101, Astronomical Data Analysis Software Systems V, ed. G. H. Jacoby & J. Barnes (San Francisco: ASP), 17
- Bethe & Salpeter (1977) Bethe, H. A. & Salpeter, E. E. 1977, Quantum Mechanics of One- and Two-Electron Atoms (New York: Plenum Publishing Corporation)
- Bland-Hawthorn et al. (1997) Bland-Hawthorn, J., Gallimore, J. F., Tacconi, L. J., Brinks, E., Baum, S. A., Antonucci, R. R. J., Cecil, G. N. 1997, Ap&SS, 248, Issue 1/2, 9
- Bowen (1935) Bowen, I. S. 1935, ApJ, 81, 1
- Branduardi-Raymont et al. (2001) Branduardi-Raymont, G., Sako, M., Kahn, S. M., Brinkman, A. C., Kaastra, J. S., & Page, M. 2001, A&A, 365, L140
- den Herder et al. (2001) den Herder, J. W., et al. 2001, A&A, 365, L7
- den Herder et al. (2002) den Herder, J. W., et al. 2002, to appear in the proceedings of the symposium ’New Visions of the X-ray Universe in the XMM-Newton and Chandra Era’, 26-30 November 2001, ESTEC, The Netherlands
- Dickey & Lockman (1990) Dickey, J. M., & Lockman, F. J. 1990, ARA&A, 28, 215
- Ebstein et al. (1989) Ebstein, S. M., Carleton, N. P., & Papaliolios, C. 1989, ApJ, 336, 103
- Elvis & Lawrence (1988) Elvis, M., & Lawrence, A. 1988, ApJ, 331, 161
- Fath (1909) Fath, E. A. 1909, Lick Observatory Bulletin, 5, 17
- Gabriel & Jordan (1969) Gabriel, A. H., & Jordan, C. 1969, MNRAS, 145, 241.
- Grevesse, Noels, & Sauval (1996) Grevesse, N., Noels, A., & Sauval, A. J. 1996, in ASP Conf. Ser. 99, Cosmic Abundances, ed. S. S. Holt & G. Sonneborn (San Francisco: ASP), 117
- Grimes, Kriss, & Espey (1999) Grimes, J. P., Kriss, G. A., & Espey, B. R. 1999, ApJ, 526, 130
- Gu (2002) Gu, M. F. 2002, in preparation
- Hess, Kahn, & Paerels (1997) Hess, C. J., Kahn, S. M., & Paerels, F. B. S. 1997, ApJ, 478, 94
- Hubble (1926) Hubble, E. 1926, ApJ, 54, 369
- Huchra, Vogeley, & Geller (1999) Huchra, J. P., Vogeley, M. S., & Geller, M. J. 1999, ApJS, 121, 287
- Kaastra et al. (2000) Kaastra, J. S., Mewe, R., Liedahl, D. A., Komossa, S., & Brinkman, A. C. 2000, A&A, 354, L83
- Kallman & Krolik (1995) Kallman, T. R., & Krolik, J. H. 1995, XSTAR = A Spectral Analysis Tool, HEASARC (NASA/GSFC, Greenbelt)
- Kallman et al. (1996) Kallman, T. R., Liedahl, D., Osterheld, A., Goldstein, W., & Kahn, S. 1996, ApJ, 465, 994
- Kaspi et al. (2000) Kaspi, S., Brandt, W. N., Netzer, H., Sambruna, R., Chartas, G., Garmire, G. P., & Nousek, J. A. 2000, ApJ, 535, L17
- Kinkhabwala et al. (2002) Kinkhabwala, A., Behar, E., Sako, M., Gu, M. F., Kahn, S. M., & Paerels, F. 2002, in preparation
- Komossa & Schulz (1997) Komossa, S., & Schulz, H. 1997, A&A, 323, 31
- Koyama et al. (1989) Koyama, K., Inoue, H., Tanaka, Y., Awaki, H., Takano, S., Ohashi, T., & Matsuoka, M. 1989, PASJ, 41, 731
- (29) Kraemer, S. B., & Crenshaw, D. M. 2000a, ApJ, 532, 256
- (30) Kraemer, S. B., & Crenshaw, D. M. 2000b, ApJ, 544, 763
- Krolik & Kriss (1995) Krolik, J. H., & Kriss, G. A. 1995, ApJ, 447, 512
- Krolik, McKee, & Tarter (1981) Krolik, J. H., McKee, C. F., & Tarter, C. B. 1981, ApJ, 249, 422
- Liedahl (1999) Liedahl, D. A. 1999, in X-Ray Spectroscopy in Astrophysics, ed. J. van Paradijs & J. A. M. Bleeker (Berlin: Springer), 189
- Liedahl & Paerels (1996) Liedahl, D. A., & Paerels, F. 1996, ApJ, 468, L33
- Marshall et al. (1993) Marshall, F. E., et al. 1993, ApJ, 405, 168
- Messier (1850) Messier, C. 1850, Connaissance des Temps, 1784, 227
- Miller & Antonucci (1983) Miller, J. S., & Antonucci, R. R. J. 1983, ApJ, 271, L7
- Miller, Goodrich, & Mathews (1991) Miller, J. S., Goodrich, R. W., & Mathews, W. G. 1991, ApJ, 378, 47
- Monier & Halpern (1987) Monier, R., & Halpern, J. P. 1987, ApJ, 315, L17
- Muxlow et al. (1996) Muxlow, T. W. B., Pedlar, A., Holloway, A. J., Gallimore, J. F., & Antonucci, R. R. J. 1996, MNRAS, 278, 854
- Netzer & Turner (1997) Netzer, H., & Turner, T. J. 1997, ApJ, 488, 694
- Pedlar et al. (1983) Pedlar, A., Booler, R. V., Spencer, R. E., & Stewart, O. J. 1983 MNRAS, 202, 647
- (43) Sako, M., Kahn, S. M., Paerels, F., & Liedahl, D. A. 2000a, ApJ, 542, 684
- (44) Sako, M., Kahn, S. M., Paerels, F., & Liedahl, D. A. 2000b, ApJ, 543, L115
- Sako et al. (2001) Sako, M., et al. 2001, A&A, 365, L168
- Seyfert (1943) Seyfert, C. K. 1943, ApJ, 97, 28
- Slipher (1917) Slipher, V. M. 1917, Lowell Observatory Bulletin, 3, 59
- Smith & Brickhouse (2000) Smith, R., & Brickhouse, N. 2000, Astrophysical Plasmas: Codes, Models, and Observations, Proceedings of the conference held in Mexico City, October 25-29, 1999, ed. J. Arthur, N. Brickhouse, & J. Franco, Revista Mexicana de Astronomía y Astrofísica (Serie de Conferencias), 9, 134
- Ueno et al. (1994) Ueno, S., Mushotzky, R. F., Koyama, K., Iwasawa, K., Awaki, H., & Hayashi, I. 1994, PASJ, 46, L71
- Wilms, Allen, & McCray (2000) Wilms, J., Allen, A., & McCray, R. 2000, ApJ, 542, 914
- Wilson & Ulvestad (1982) Wilson, A. S., & Ulvestad, J. S. 1982, ApJ, 263, 576
- Wilson & Ulvestad (1983) Wilson, A. S., & Ulvestad, J. S. 1983, ApJ, 275, 8
- Young, Wilson, & Shopbell (2001) Young, A. J., Wilson, A. S., & Shopbell, P. L. 2001, ApJ, 556, 6


| Line ID | [Å] | Shift [km s-1]aaError bars (due to dominant systematic instrumental uncertainty) are 1-. | [km s-1]aaError bars (due to dominant systematic instrumental uncertainty) are 1-. | Flux [ photons cm-2 s-1]aaError bars (due to dominant systematic instrumental uncertainty) are 1-. |
|---|---|---|---|---|
| Fe XX | 12.846 | — | ||
| Fe XVII | 15.014 | bbFe L-shell lines and He-like triplet linewidths for N and O were tied together for fitting for each line complex. | ||
| Fe XVII | 15.261 | bbFe L-shell lines and He-like triplet linewidths for N and O were tied together for fitting for each line complex. | ||
| Fe XVII (2) | 17.051,17.096 | — | ||
| Si XIV Ly | 6.18223 | — | — | |
| Si XIII rif | 6.69 | — | — | |
| Si I K | 7.1542 | — | — | |
| Mg XII Ly | 8.42100 | — | ||
| Mg XI rif | 9.23 | — | — | |
| Ne X Ly | 12.134 | |||
| Ne IX He | 11.000 | — | ||
| Ne IX He | 11.547 | — | — | |
| Ne IX r | 13.447 | — | ||
| Ne IX i | 13.552 | — | — | |
| Ne IX f | 13.698 | — | ||
| O VIII Ly | 14.821 | — | — | |
| O VIII Ly | 16.006 | — | ||
| O VIII Ly | 18.969 | |||
| O VII He | 17.396 | — | ||
| O VII He | 17.768 | |||
| O VII He | 18.627 | — | ||
| O VII r | 21.602 | bbFe L-shell lines and He-like triplet linewidths for N and O were tied together for fitting for each line complex. | ||
| O VII i | 21.803 | bbFe L-shell lines and He-like triplet linewidths for N and O were tied together for fitting for each line complex. | ||
| O VII f | 22.101 | bbFe L-shell lines and He-like triplet linewidths for N and O were tied together for fitting for each line complex. | ||
| N VII Ly | 19.361 | — | ||
| N VII Ly | 19.826 | |||
| N VII Ly | 20.910 | |||
| N VII Ly | 24.781 | |||
| N VI He | 23.277 | |||
| N VI He | 23.771 | |||
| N VI r | 28.787 | bbFe L-shell lines and He-like triplet linewidths for N and O were tied together for fitting for each line complex. | ||
| N VI i | 29.083 | bbFe L-shell lines and He-like triplet linewidths for N and O were tied together for fitting for each line complex. | ||
| N VI f | 29.534 | bbFe L-shell lines and He-like triplet linewidths for N and O were tied together for fitting for each line complex. | ||
| C VI Ly | 26.357 | |||
| C VI Ly | 26.990 | |||
| C VI Ly | 28.466 | |||
| C VI Ly | 33.736 | |||
| C V He | 32.754 | |||
| C V He | 33.426 | — | ||
| C V He | 34.973 |
| Ion | RRC [eV]aaError bars denote approximate 90% confidence interval. | Flux [ photons cm-2 s-1]bbError bars (due to dominant effective-area uncertainty) are 1-. |
|---|---|---|
| C V | ||
| C VI | ||
| N VI | ||
| N VII | ||
| O VII | ||
| O VIII |
| Ion | Line Ratio | CIEaaEvaluated at CIE temperature which maximizes ion fraction. | RECbbEvaluated at eV, although the temperature dependence is weak. | ObservedccError bars are 1-. |
|---|---|---|---|---|
| C VI | LyLy | 0.090 | 0.144 | |
| LyLy | 0.024 | 0.052 | ||
| LyLy | 0.010 | 0.026 | ||
| N VII | LyLy | 0.096 | 0.141 | |
| LyLy | 0.023 | 0.049 | ||
| LyLy | 0.009 | 0.024 | ||
| O VIII | LyLy | 0.100 | 0.138 | |
| LyLy | 0.025 | 0.048 | — | |
| LyLy | 0.010 | 0.023 |
| Ion | Line Ratio | RECaaEvaluated at eV for N VI and 4 eV for O VII. | ObservedbbError bars are 1-. |
|---|---|---|---|
| N VI | He | 0.047 | |
| He | 0.016 | ||
| He | 0.008 | ||
| O VII | He | 0.051 | |
| He | 0.017 | ||
| He | 0.008 |
| Ion | Ratio | CIEaaValid over realistic range of collisional for each ion Smith & Brickhouse (2000). | RECbbValid for –100 eV Kinkhabwala et al. (2002). | ObservedccError bars are 1-. |
|---|---|---|---|---|
| N VI | 5.0–5.5 | 6.0–7.0 | ||
| O VII | 4.0–4.3 | 3.4–4.0 | ||
| N VI | 0.5–1.0 | 4.0–5.5 | ||
| O VII | 0.5–1.1 | 4.0–5.3 |
| Ion | [cm-2] | [eV]aa values in italics are arbitrarily assumed. | EM [1064 cm-3]bbAssumes Solar abundance and fractional ionic abundance . Values in italics correspond to italicized (and arbitrary) values. |
|---|---|---|---|
| C V | 8E17 | 2.5 | 6.7 |
| C VI | 9E17 | 4.0 | 1.8 |
| N VI | 6E17 | 3.0 | 6.5 |
| N VII | 6E17 | 4.0 | 1.7 |
| O VII | 1.1E18 | 4.0 | 1.5 |
| O VIII | 1E18 | 4.0 | 0.32 |
| Ne IX | 3E17 | 4 | 0.42 |
| Ne X | 2.5E17 | 4 | 0.097 |
| Mg XI | 2E17 | 4 | 0.31 |
| Mg XII | 2E17 | 4 | 0.092 |
| Si XIII | 2E17 | 4 | 0.13 |
| Si XIV | 2E17 | 4 | 0.042 |