SZ and X-ray combined analysis of a distant galaxy cluster, RX J2228+2037
We have performed a combined analysis of X-ray and Sunyaev-Zel’dovich data in the direction of the distant galaxy cluster, RX J2228+2037. Fitting a -model to the high-resolution HRI data gives kpc and . The dependency of the Sunyaev-Zel’dovich effect with respect to the gas temperature allows us, through the additional use of the 21 GHz data of the cluster, to determine keV. Extrapolating the gas density profile out to the virial radius ( Mpc), we derived a gas mass of . Within the hypothesis of hydrostatic equilibrium, the corresponding extrapolated total mass for this source is: , which corresponds to a gas fraction of . Our results on the temperature and on the cluster mass classify RX J2228+2037 among the distant, hot and very massive galaxy clusters. Our work highlights the power of the association of galaxy cluster mapping observations in X-ray and the SZ effect to derive the cluster’s physical properties, even without X-ray spectroscopy.
Key Words.:
Cosmology: observation – Galaxies: clusters: individual: RX J2228+2037 – Intergalactic mediumetienne@astr.tohoku.ac.jp
1 Introduction
The study of galaxy clusters is one of the clues in our understanding of the universe. Located at the nodes of large-scale structures, they are the object of many different cosmological studies. While it is important to study their statistical properties, it is also important to probe their internal physics in the context of structure formation in the universe. As the main baryonic component of galaxy clusters, the intracluster gas is a rich source of information. It represents between 10 and 30% of the cluster total mass. Largely observed in X-ray through its Bremsstrahlung emission, it can also be detected from submillimeter to centimeter wavelengths. In the last case, the signal is due to the Sunyaev-Zel’dovich (SZ) effect (Sunyaev & Zel’dovich (1972)). The intracluster gas is highly ionized because of its high thermal temperature. The thermal electrons accelerate the low energy photons of the cosmic microwave background (CMB) by inverse Compton scattering. The transfer of energy from the thermal electrons to the photons produces a shift in the CMB spectrum towards higher energies. This characteristic distortion of the CMB spectrum is a well-known signature of a galaxy cluster (Birkinshaw (1999)). Since the SZ flux is independent of the redshift, the study of the SZ effect toward distant clusters is a powerful tool to probe massive clusters at high redshift and to constrain the cosmological density parameter.
The single dish measurements of the SZ effect allows us to determine the absolute intensity of the effect from centimeter to submillimeter wavelengths. When performed on large radio telescopes, they also are the only way to get high resolution SZ observations. Recent SZ studies at millimeter wavelengths using such observing methods and coupled with the use of high performance bolometric detectors have led to significant results. Two independent groups, Pointecouteau et al. (pointecouteau99 (1999, 2001)) with the IRAM-30mDIABOLO instrument and Komatsu et al. (komatsu99 (1999, 2001)) with the NRO-45mNOBA instrument, have shown surprising results in the direction of the same target, the most luminous X-ray cluster known to date, RX J1347-1145. Discrepancies between the SZ and the X-ray (ROSAT) signal distributions have been pointed out, as well as evidence for an internal structuring of the intracluster gas. The existence of an internal structure is confirmed by the Chandra observation of RX J1347-1145 (Allen et al. (2001)).
In this paper, we present the result of a combined SZ and X-ray analysis in the direction of RX J2228+2037, a distant galaxy cluster (). It was detected in the ROSAT All Sky Survey (RASS). An optical identification of the X-ray source was given by Bade et al. (bade98 (1998)). Voges et al. (voges99 (1999)) identified this source as a galaxy cluster. More recently it has been included in the NORAS galaxy cluster survey (Böhringer et al. (2000)) and in the ROSAT Brightest Cluster sample (Ebeling et al. (2000)). Both catalogs are based on the RASS observations in the [0.1-2.4] keV energy band. The characteristics reported for this target in these two papers are in agreement. The results of the NORAS catalog are: a count rate of cts s-1, an estimated flux for a temperature of 5 keV of ergs s-1 cm-2 and an intrinsic luminosity of ergs s-1.
We have observed RX J2228+2037 through its SZ effect using the Nobeyama Radio Observatory (NRO) 45 m radiotelescope at 21 GHz and combined those data with the X-ray image obtained from the ROSAT/HRI instrument in the [0.1-2.4] keV energy band. In the following, we present an extensive study of this target through the combined analysis of the two sets of data. In a first step, we probe the spatial structure of the cluster with the X-ray data (see Sec. 3). Then, we use the direct dependency of the SZ flux with respect to the gas temperature to extract this key parameter and furthermore we deduce the gas mass and the total mass of RX J2228+2037 (see Sec. 4).
Throughout this paper, we used km s-1 Mpc-1, and . In this cosmology an angular scale of 1 arcmin corresponds to a physical size of 328 kpc at the redshift of RX J2228+2037.
2 Observations
2.1 The X-ray data
Apart from the RASS data, pointed observations have been conducted in the direction of RX J2228+2037. A total of 30 ks exposure time has been spent with ROSAT/HRI on this target on the 8th and the 12th of December 1996. The pointing coordinates were =22h28m36s and =+20∘37′12′′.
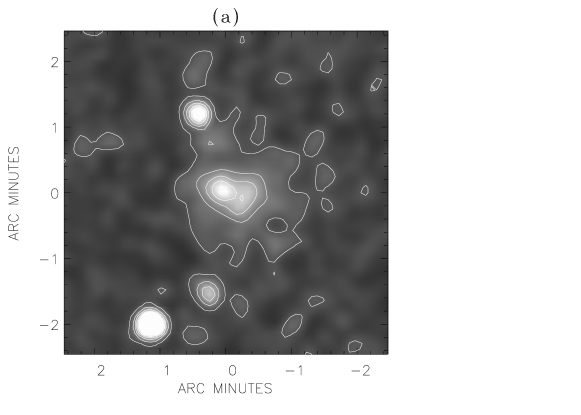
We have processed the data using the EXSAS software (Zimmermann et al. (1993)). In order to limit the background events, we checked each PHA individually. We only selected PHA displaying a significant signal for inclusion in the data processing. Finally, PHA from 1 to 10 were selected. The events were binned into 5 arcsec pixels to generate a raw image of the cluster. The cluster map is presented in Fig 1a.
2.2 The SZ data
The SZ effect observations were conducted at the Nobeyama Radio Observatory in December 1999 using the 45 m radio telescope facilities at 21 GHz. The 21 GHz (1.43 cm) detector is a double channel equiped with low-noise HEMT receivers coupled to 2 GHz bandwidth back-ends. Basically the two channels allow detection of a circularly polarized signal. However, we have used them as independent detectors for the same signal. This redundancy allows us to monitor the self consistency of the signal and to avoid unexpected drift and systematics in the signal measurement. It also increases the reliability of our measurements. The beam size is given by the diffraction limit of the telescope at this wavelength: arcsec, which corresponds to a physical angular scale of 437 kpc at the cluster redshift. During the whole observation, the system temperature was approximately 135 K.
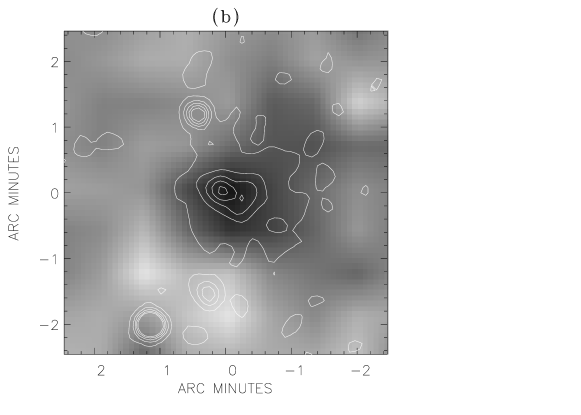
Observing at the 45 m telescope at 21 GHz, we were looking for the extended SZ signal, with the goal of mapping the distribution of the SZ decrement at large angular scales. Our observations covered an area of about arcmin2. We directly mapped the target in the RA–DEC coordinates referential by using a raster/scanning technique: a single observation is composed by a X raster (the scanning is done in the right ascension direction) and a Y raster (the scanning is done in the declination direction). Their combination is expected to cancel out the scanning effects. Each single map (either a X or a Y raster) had a basic scanlength of 360 arcsec for a total of 9 lines. Two lines are separated by 40 arsec in order to achieve a correct spatial sampling with respect to the beam size. We have monitored the atmospheric emission and done pointing verifications in the direction of point sources lying near the cluster location. Calibration measurements have been done throughout the observing run in the direction of NGC7027 (Ott et al. (1994)). The main steps of the data processing pipeline include a baseline subtraction (a first order polynomial is fitted to the edges of each line of the X and the Y rasters). The signal is cleaned of glitches due to cosmic high energy particles and to the electronic spikes in the readout systems. After the calibration of the signal, the X and the Y rasters are combined using a Fourier transform filtering method to remove the scanning noise (Emerson & Graeve (1988)). Each raster is reprojected on a RA-DEC grid to avoid a difference in the central position between observing sequences. Finally, the SZ map is computed from the sum of the whole set of rasters.
The resulting map is presented in Fig 1b. The sensitivity level we have reached is 0.5 mJy beam-1 for an integration time of 34 h.
3 Spatial analysis
3.1 X-ray analysis
To characterize the intrinsic emission of RX J2228+2037, we first cleaned the field of view of contaminating sources. The sources were extracted using a maximum likelihood method with a threshold of 8, which roughly corresponds to a 3.5 detection level. A total of 27 sources were identified above this level and then removed. The hydrogen column density was fixed to the galactic value cm-2 (Dickey & Lockman (1990)). The count rate for the cluster at the virial radius is cts s-1.
The X-ray map seems to present an extension in the right ascension direction. Moreover, the shape of the cluster seems to be slightly elliptical and tilted. For this reason, we have chosen to fit different models of the intracluster gas distribution to the data. We checked four different models based on a modified King profile, or so-called -model (Cavaliere & Fusco-Femiano (1978)) and refered to them as A, B, C and D. Our models also assumed that the intracluster medium is isothermal.
Models A and B are 2D elliptical models and therefore they have been fitted to the X-ray map. Model A is an elliptical -model. The centroid of this model has been fixed to the position of the X-ray maximum. Model B is also an elliptical -model, but in this second case, the position of the centroid is left as a free parameter.We apply the following expression of the X-ray surface brightness in radial coordinates :
| (1) |
| Model | |||||||
|---|---|---|---|---|---|---|---|
| ( ergs s-1 cm-2 arcmin-2) | (arcsec) | (deg) | |||||
| A | – | ||||||
| B | – | ||||||
| C | – | – | 1.04 | ||||
| D | – | – | 1.38 | ||||
-
a
Value of the reduced . See text in Sec. 3.1 for model A and B.
is the central X-ray surface brightness and the background value. is the core radius along the major axis of the cluster, and is its ellipticity, defined as the ratio of the major axis core radius over the minor axis core radius. is the orientation angle, the angle between the cluster major axis and the right ascension axis. In model A, , , , , and are fitted simultaneously. In model B, the centroid coordinates and are additional free-fit parameters. The 27 contaminating sources have been masked to avoid any bias in the fitting procedure.
For those two models, we strictly followed the 2D fitting procedure of an elliptical -model described by Neumann & Böhringer (neumann97 (1997)): we smoothed the image of the cluster with a Gaussian filter with arcsec . We reproduced this Gaussian filtering on the 2D elliptical -model. We calculated the corresponding uncertainty taking into account the Gauss filter. The uncertainties on the best fit parameters were obtained via a Monte Carlo method: a random Poisson noise is added to the data. This “modified” data set is fitted the same way as the real data. We reproduced this procedure 100 times for different realizations of the Poisson noise. We took the value of the standard deviation of the 100 fitted values as the uncertainty of each parameter.
Even though this method does not allow us to give the exact value of the , it allows us to minimize it and it has already shown good results for CL 0016+16, A2218 or 3C295 (see Neumann & Böhringer neumann97 (1997, 1999); Neumann neumann99b (1999)).
Models C and D are “Classical” 1D -models. They have been fitted to the radial X-ray surface brightness profile using a maximum likelihood method. Model C is centered on the location of the X-ray maximum, and model D has been fitted to the profile folded from the cluster centroid position (, ) determined by model B. For a 1D -model, the X-ray surface brightness is:
| (2) |
The radial profiles have been extracted from the X-ray map within a 12 arcmin circular area from the position chosen as the cluster center. Within this area, the X-ray background can be considered as a constant (Ota (2000)). The events of the 27 contaminating sources have been masked, so that the resulting radial profile is free from any contamination (see Fig 2a). The two models include 4 free parameters: , , and .
Our four models have been tested against the X-ray data. In each case the PSF effects have been taken into account. The results are summarized in Table 1. The best fit parameters are given with their errors bars. For models A and C, the location of the cluster center, which corresponds to the position of the maximum of the X-ray emission, is: 22h28m33.3s, 20∘37′12.2′′. In the case of models B and D, this position is determined by the best fit position for the centroid of the elliptical -model in model B: 22h28m32.7s, 20∘37′11.2′′. The core radii for the different models (A, B, C, D) as well as the parameters agree within the 2 limit. In case of the 1D models, model C presents the best quality fit. In the following, we have used model C as the reference model.
3.2 SZ analysis
Before combining the SZ data with the X-ray data, in order to extract the intracluster gas temperature, we decided to check whether our SZ data were consistent with the results obtained from the spatial analysis of the X-ray data.
If the cluster gas distribution follows a modified King profile, then the SZ surface brightness can be expressed as:
| (3) |
where is the central SZ surface brightness and the background emission level.
Unfortunately, the quality of the SZ data is not good enough to allow us to test an elliptical model, so that we limited our analysis to a symmetrical -model. Using this distribution to model the SZ signal, we have reproduced in it each step of the SZ data processing (convolution with the beam pattern, baseline subtraction, etc) in order to get the most accurate model. Using a maximum likelihood method, we left the SZ central flux, the core radius and the parameter as free parameters and fitted the model over the SZ map. The best configuration parameters are obtained for a reduced chi-squared value of 1.1 (96 d.o.f): mJy beam-1, arcsec and . The result for and are compatible with the best fit parameter values obtained from the X-ray data analysis within a 1 and a 2 limit respectively. The large errors (especially in the case of ) are due to the low signal to noise ratio and to the lack of resolution of our SZ data at 21 GHz. This made the precise determination of the core radius and very difficult and explained the strong degeneracy between those parameters.


4 Physical properties of RX J2228+2037
Knowing that the angular diameter distance of RX J2228+2037 is Mpc, the value of the angular core radius, arcsec, corresponds to a physical core radius of kpc. From the best fit parameters of model C, we have extracted the central electron density, cm-3.
4.1 Temperature determination
ROSAT/HRI has no spectral resolution so that the X-ray data do not allow us to determine the electron temperature. However, using the high luminosity value in the [0.1-2.4] keV energy band reported for RX J2228+2037 in the NORAS catalog ergs s-1(Böhringer et al. (2000)), we can expect a quite high temperature for the intracluster medium. In fact, we can use this value of the luminosity as a lower limit for the bolometric luminosity of the cluster to put a lower limit on the gas temperature. Using the relation, we obtained keV (Arnaud & Evrard (1999)) or keV (Fairley et al. (2000)).
Knowing that the SZ signal is directly proportional to the pressure and furthermore to the gas mass integrated along the line of sight, we have used the spatial information of our SZ map to constrain the gas temperature of RX J2228+2037. The central SZ surface brightness can be expressed as follow :
| (4) |
where represents the SZ effect spectral shape. The dependency of this spectral shape with respect to the gas temperature should not be neglected, especially in our case where we expect a high value for the temperature. This dependency is not linear and has to be computed numerically (Pointecouteau et al. (1998)). is the Comptonization parameter:
| (5) |
where , , and are respectively the Boltzmann constant, the electron mass, the speed of light and the Thomson cross-section. is the electron density at the center of the cluster. Mpc is the virial radius of the cluster (Bryan & Norman (1998)). represents the gas distribution profile along the line of sight.
To determine the electron temperature from the SZ data, we have fixed the -model parameters to the best fit values of model C, arcsec and (see Sec. 3.1). has also been fixed so that the temperature was the only remaining free parameter in the model. We have tested this -model against the SZ map for various temperature values. Taking into account the temperature effect on the SZ spectral shape, we have derived from a maximum likelihood analysis a value of keV (). This high temperature value is in agreement with the lower limit value suggested by the [0.1-2.4] keV X-ray luminosity. The corresponding central Comptonization parameter is .
From this determination and the X-ray count rate estimates (see Sec. 3.1), we deduced the X-ray flux and luminosity of the cluster in the [0.1-2.4] energy band: ergs s-1 cm-2 and ergs s-1. The X-ray bolometric luminosity has been computed from the best fit model: ergs s-1. This allows us to check our determination of the temperature against the relation expectations: keV (Arnaud & Evrard (1999)) and keV (Fairley et al. (2000)). Our temperature determination fits perfectly on the relation. This determination confirms the fact that RX J2228+2037 is indeed a hot cluster.
| S1 | S2 | S3 | (keV) | ||||
| 22h28m26.18s | 22h28m26.71s | 22h28m32.51s | – | – | |||
| 20∘37′00′′ | 20∘39′40.2′′ | 20∘35′32.6′′ | |||||
| F(1.4 GHz) (mJy) | 9.0 | 19.4 | 7.6 | – | – | ||
| F(21.0 GHz) (mJy) | |||||||
| 2.3 | 5.0 | 2.0 | 2.2 | ||||
| 0.6 | 1.3 | 0.5 | 1.06 | ||||
| 0.93 |
-
a
is the spectral index of the power law used as a model for the radio sources emission (see Sec. 4.2)
-
b
In this case the fluxes of the three sources are free parameters. They are fitted simultaneously with the gas temperature.
4.2 Point sources
Where the determination of the spatial parameters of the cluster ( and ) is provided by the X-ray data, the electron temperature is constrained by the SZ data. Within the hypothesis of the hydrostatic equilibrium, the SZ flux and the electron temperature are linearly linked, so that any contamination in the SZ flux measurement will bias the temperature estimation. Such contamination could be inferred by the presence of point sources in the field of view. To prevent such biases, we have investigated for the presence of point sources in our field of view. We have found three radio sources in the NVSS survey (Condon et al. (1998)), that could contaminate the SZ mapping of the cluster. We only know their flux measurements at 1.4 GHz, therefore we are not able to determine their spectra in order to extrapolate their flux at 21 GHz without a few hypothesis. Assuming that the radio emission of the sources is due to synchrotron emission, we can adopt a power law as a model for their spectra. To date many different radio sources have been observed with different spectral shapes. Nevertheless, most of the spectral indexes of models extracted from radio source analysis fit into the interval: . Using those two limits we have extrapolated the contamination sources fluxes from 1.4 GHz to 21 GHz using a power law spectrum: . In order to estimate whether the presence of radio sources affects the determination of , we have added the point source contribution to the SZ model and performed a new temperature estimation. In a first step, each point source flux was fixed to the value extrapolated from the 1.4 GHz measurements with the two spectral index values of and . In a second step, we considered their fluxes as free parameters as well as the electron temperature. The characteristics of the radio sources and the results on the temperature determination are summarized in table 2.
In each configuration, the temperature determination is not really affected. The three temperature values are consistent with the value obtained when ignoring the point sources. The value is bad in the case of . On the contrary, the fit for a spectral index of is satisfying and also agrees very well with the fluxes value we determined from the SZ data (third case) within a 2 limit. This can be explained by the low fluxes expected or fitted at 21GHz and by the relatively high noise level on the SZ map. Moreover, in this case the point sources produce a localized effect which is washed out in the temperature determination over the entire map. It appears that the influence of the point sources present in the cluster neighborhood can be neglected in the temperature extraction. Therefore the value of keV can be taken as the isothermal temperature for RX J2228+2037.
4.3 Mass estimation
The SZ surface brightness is directly proportion to the pressure integrated along the line of sight. A map of the SZ effect is a direct projected image of the cluster gas mass distribution if the temperature distribution is isothermal. Knowing the gas temperature, the projected gas mass is derived from the SZ flux through a linear transformation : . Where is a constant depending on the cluster redshift and on the gas temperature. From our 21 GHz SZ data, we are able to measure the gas mass up to a radius of 0.5 Mpc: .
Assuming the isothermality of the cluster, we can derive the gas mass and the total mass from our best fit model C to the X-ray data (see Sec. 3.1) :
| (6) |
where is the average weight per massive particle and the gravitational constant. The measured gas mass from the SZ map is in good agreement with the mass predicted by the best fit model C: .
Finally, we can estimate the gas mass and the total mass at the virial radius by extrapolating the profile corresponding to the best fit parameters out to the virial radius. Using our best fit model C which parameters are and (Sec. 3.1), we obtained the following extrapolated measurements: and .
The errors on the mass determination take into account the uncertainties derived from the best fit parameters. However, our results using and for the 1D and 2D profiles do not account for a possible oblate or prolate form in the direction of the line-of-sight. Taking these effects into account would certainly increase the error bars. However, such analysis is beyond the scope of this paper.
The corresponding gas fraction is . This result is larger than the value derived by Grego et al. (grego01 (2001)) from the SZ measurements of 18 clusters, , but both values agree within the 2 limit.
5 Conclusion
In this paper we have presented a combined analysis of the SZ effect and X-ray mapping observations. Through this analysis, we have carried out an extensive study of the galaxy cluster RX J2228+2037.
This work led us to the characterization of the cluster physical properties, among which the gas temperature is a key parameter. Our estimation of this parameter, keV, has only been possible through the SZ and X-ray data combination which shows the power of combining this sort of data.
This target will be soon observed by the new generation X-ray satellites, XMM-Newton and Chandra. The high quality spectral data that will be provided by those instruments should confirm and help to improve our results.
Our work also emphasizes how powerful the combination of SZ and X-ray data is. It is a preview of what we can expect for many sources when the full sky coverage of the Planck Surveyor satellite from submillimeter to centimeter wavelengths will be available. Many sources in this catalog are expected to have faint X-ray counterparts. The quality of the X-ray spectral data is expected to be poor in such cases so that the combination with SZ data will be the only path to the extraction of reliable information about the physics of galaxy clusters.
Acknowledgements.
The authors are grateful to F. J. Castander, the referee, whose comments helped to improve the quality of this paper. We want to thank the NRO staff members for their help during the observations and T. Kitayama for providing support for the data processing. EP acknowledges the support of the Japanese Society for Promotion of Science.References
- Allen et al. (2001) Allen, S. W., Schmidt, R. W., Fabian, A. C. 2001, submitted to MNRAS, astro-ph/0111368
- Arnaud & Evrard (1999) Arnaud, M. & Evrard, A. 1999, MNRAS, 305, 631
- (3) Bade, N. et al. 1998, Astron. Astrophys. Suppl., 127, 145
- Birkinshaw (1999) Birkinshaw, M. 1999, Phys. Rept. 310, 97
- Böhringer et al. (2000) Böhringer, H. et al. 2000, ApJ Suppl., 129, 435
- Bryan & Norman (1998) Bryan, G. L. & Norman, M. L. 1998, ApJ, 495, 80
- Cavaliere & Fusco-Femiano (1978) Cavaliere, A. & Fusco-Femiano, R. 1978, A&A, 70, 677
- Condon et al. (1998) Condon, J. J., Cotton, W. D., Greisen, E. W., Yin, Q. F., Perley, R. A., Taylor, G. B. and Broderick, J. J. 1998, Astron. J., 115, 1693
- Dickey & Lockman (1990) Dickey, J. M. & Lockman, F. J. 1990, Ann. Rev. Astron. Ap., 28, 215
- Ebeling et al. (2000) Ebeling, H., Edge, A. C., Allen, S. W., Crawford, C. S., Fabian, A. C., & Huchra, J. P. 2000, MNRAS, 318, 333
- Emerson & Graeve (1988) Emerson, D. T. & Graeve, R. 1988, A&A, 190, 353
- Fairley et al. (2000) Fairley, B. W. et al. 2000, MNRAS, 315, 669
- (13) Grego, L., Carlstrom, J. E., Reese, E. D., Holder, G. P., Holzapfel, W. L., Joy, M. K., Mohr, J. J., & Patel, S. 2001, ApJ, 552, 2
- (14) Komatsu, E. et al. 1999, ApJ (Lett.), 516, L1
- (15) Komatsu, E. et al. 2001, PASJ, 53, 57
- (16) Neumann, D. M. & Böhringer, H. 1997, MNRAS, 289, 123
- (17) Neumann, D. M. & Böhringer, H. 1999, ApJ, 512, 630
- (18) Neumann, D. M. 1999, ApJ, 520, 87
- Ota (2000) Ota, N. 2000, PhD Thesis
- Ott et al. (1994) Ott, M., Witzel, A., Quirrenbach, A., Krichbaum, T. P., Standke, K. J., Schalinski, C. J., & Hummel, C. A. 1994, A&A, 284, 331
- Pointecouteau et al. (1998) Pointecouteau, E., Giard, M. & Barret, D. 1998, A&A, 336, 44
- (22) Pointecouteau, E. et al. 1999, ApJ (Lett.), 519, L115
- (23) Pointecouteau, E. et al. 2001, ApJ, 552, 42
- Sunyaev & Zel’dovich (1972) Sunyaev, R. & Zel’dovich, Y. 1972, Comments Astrophys. Space Phys., 4, 173
- (25) Voges, W. et al. 1999, A&A, 349, 389
- Zimmermann et al. (1993) Zimmermann, H. U., Belloni, T., Izzo, C., Kahabka, P., & Schwentker, O. 1993, ASP Conf. Ser. 52: Astronomical Data Analysis Software and Systems II, 2, 233