The most distant structure of galaxies known: a protocluster at 11affiliation: Based on observations carried out at the European Southern Observatory, Paranal, Chile; program LP167.A-0409
Abstract
Imaging and spectroscopy with the Very Large Telescope have revealed 20 Ly emitters within a projected distance of 1.3 Mpc and 600 km s-1 of the luminous radio galaxy TN J1338–1942 at . Compared to the field density of Ly emitters, this implies an overdensity on the order of 15. The structure has a projected size of at least 2.7 Mpc 1.8 Mpc and a velocity dispersion of 325 km s-1, which makes it the most distant structure known. Using the galaxy overdensity and assuming a bias parameter = 3 – 5, the mass is estimated to be . The radio galaxy itself is surrounded by an uniquely asymmetric Ly halo. Taken together with our previous data on PKS 1138–262 at , these results suggest that luminous radio sources are excellent tracers of high density regions in the early Universe, which evolve into present-day clusters. The statistics of bright radio sources and of concentrations in the Lyman break galaxy population are consistent with the picture that each of those concentrations harbours an active or passive luminous radio source.
1 Introduction
Studies of high redshift (proto)clusters of galaxies () can directly constrain theories of galaxy evolution and cosmological models (e.g. Bahcall & Fan 1998), but the detection of (proto)clusters at these redshifts using conventional optical and X-ray techniques is difficult. High redshift radio galaxies (HzRGs, ) can help: they are among the most evolved and most massive galaxies in the early Universe (De Breuck et al. 2002) and are most likely located in dense (proto)cluster environments (e.g., Le Fèvre et al. 1996; Pascarelle et al. 1996; Röttgering et al. 1996; Carilli et al. 1997; van Ojik et al. 1997; Pentericci et al. 2000b). In addition, HzRGs have properties that would be expected of forming central cluster galaxies. Their extremely clumpy morphologies revealed by Hubble Space Telescope images (Pentericci et al. 1999) are strikingly similar to simulations of forming brightest cluster galaxies, based on hierarchical models (e.g., Aragón-Salamanca, Baugh, & Kauffmann 1998).
A pilot project on the Very Large Telescope (VLT) to search for Ly-emitting galaxies around the clumpy radio galaxy PKS 1138–262, resulted in the discovery of 14 galaxies and a QSO at approximately the same redshift as the radio galaxy (Kurk et al. 2000; Pentericci et al. 2000a). If the structure found is virialized, the total mass of the protocluster would be . Motivated by this result, we started a large program at the VLT to search for forming clusters (protoclusters) around HzRGs at redshifts 2 and higher. The first radio galaxy field we observed was TN J1338–1942 at a redshift of 4.1 (De Breuck et al. 1999). This HzRG is one of the brightest and most luminous in Ly known. Both its Ly profile and radio structure are very asymmetric (De Breuck et al. 1999), which indicates strong interaction with dense gas, and the rest-frame radio luminosity is comparable to that of the most luminous 3CR sources (P erg s-1 Hz-1 sr-1). Here we report on the discovery of a substantial overdensity of Ly emitters around this radio galaxy at .111Throughout this Letter, magnitudes are in the AB system and a -dominated cosmology with H km s-1 Mpc-1, , and is assumed.
2 Observations and candidate selection
2.1 VLT imaging and selection of candidate Ly emitters
We carried out narrow- and broadband imaging on 2001 March 25 and 26 with the 8.2 m VLT Kueyen (UT2), using the imaging mode of the FOcal Reducer/low dispersion Spectrograph 2 (FORS2). At the Ly emission line is redshifted to 6202 Å, which falls in our custom narrowband filter with a central wavelength of 6195 Å and FWHM of 60 Å. The broadband R filter had a central wavelength of 6550 Å and FWHM of 1650 Å. The detector was a SiTE CCD with 20482048 pixels, with a scale of 02 per pixel and a field of view of 6868. We took 18 separate 1800 s exposures and one 900 s exposure in the narrow band and 21 exposures of 300 s in , shifted by ″ with respect to each other to minimize flat-fielding problems and to handle cosmic rays. The nights were photometric and the average seeing in both narrowband and broadband images was 065. The 1 limiting magnitude per square arcsecond was 28.6 for the narrowband and 29.2 for the broadband image. For the flux calibration the spectrophotometric standard star GD 108 (Oke 1990) was used. The final images have sizes of 64 62 (39.7 arcmin2). The total volume probed at by our narrowband filter is 7315 Mpc3.
NTT imaging data, taken on 1998 April 27 and 29 under nonphotometric conditions with SuSI2, were also used to provide - and -band magnitudes for candidate emitters where possible. The 1 limiting magnitude per square arcsecond was about 27.8 in both bands.
For the detection and photometry of objects in the images, we used the object detection and classification program SExtractor (Bertin & Arnouts 1996). Detected objects had at least 9 connected pixels with values larger than the rms sky noise on the narrowband image. A photometric analysis was then carried out on both the narrowband and the broadband image. In total 2407 objects were extracted. Based on the statistics of our detection of Ly emitters around PKS 1138–262, we selected objects with a rest-frame equivalent width (EW greater than 15 Å (or ) and significance as candidate Ly-emitting galaxies, with the ratio of continuum-subtracted counts in the narrowband to the combined noise in the broadband and narrowband (Bunker et al. 1995). Of the 2407 objects, 34 objects satisfied these criteria, including the radio galaxy. Of these 34 objects, 31 were detected in the -band image, 9 were detected in the NTT image and 5 in the NTT image. The 5 objects with a detection in B have a color of 0–1, inconsistent with the colors expected for galaxies at (Steidel et al. 1999). Three of these objects are located in the halo of the radio galaxy, which affects the narrowband photometry. The other two are likely to be foreground objects with another line falling in the narrowband filter, e.g. [O III] or [O II] . Excluding the radio galaxy, the resulting 28 objects were our Ly-emitting candidates for follow-up spectroscopy.
2.2 VLT spectroscopy
On 2001 May 20, 21, and 22 we carried out spectroscopy using FORS2 in the mask multiobject spectroscopy mode with standard resolution. The nights were photometric with an average seeing of 1″. The spectra were obtained with the 600RI grism with a dispersion of 1.32 Å pixel-1 and a wavelength range from 5300 Å to 8000 Å. This grism was preferred because of its high throughput (peak efficiency is 87%). Two different masks were used to observe 23 of the candidate Ly emitters and the radio galaxy, with slit sizes of 1″, resulting in a resolution of 6 Å, which corresponds to 290 km s-1 at . The total exposure time was 31,500 s for the first mask and 35,100 s for the second mask. Wavelength calibration was obtained from exposures of He, Ar, Ne, and HgCd arc-lamps. The accuracy of the wavelength calibration was better than 0.05 Å. For the flux calibration, long slit exposures with a 5″ slit were used of the spectrophotometric standard stars EG 274 and LTT 7987 (Stone & Baldwin 1983; Baldwin & Stone 1984).
3 Results
3.1 Line emitters in the field
3.1.1 Line identifications
Of the 23 candidates observed, 20 show an emission line with a peak between Å and Å. The signal-to-noise of these lines is at least 10. Ten randomly selected spectra from our sample are shown in Figure 1. Two nondetections were very faint ( and respectively). The third nondetection had a very low surface brightness. The success rate of our selection criteria was therefore 87%.
The first question is whether the detected lines are indeed due to Ly at the redshift of the radio galaxy. Intervening neutral hydrogen will absorb emission blueward of the Lya line (Steidel et al. 1999). This discontinuity of the continuum over the Lya emission line is observed in one of the spectra, but the continuum emission of the other emitters was too faint to be detected (R ). Identification of the lines with [O III] at can be excluded, because of the lack of confirming lines [O III] and H in the spectra. The position of the emitter within the slit mask determines the wavelength coverage of the resulting spectrum. In 9 cases this coverage was suitable to exclude the identification with [O II] at on similar grounds. The detected emitters are anyway unlikely to be foreground [O II] galaxies. First of all, if one of the lines would be [O II], then the rest-frame equivalent width would be at least 70 Å. A survey of nearby field galaxies, conducted by Jansen et al. (2000), gives a mean EW0 of the [O II] line of Å for galaxies with , which roughly compares to R at . Only 2 galaxies out of 159 galaxies with [O II] in emission have EW0([O II]) Å. The number of [O II] emitters expected in our field, using another study (Hogg et al. 1998), is . Again, only a few percent of the [O II] emitters observed by Hogg et al. have an EW Å. Therefore, from our sample of 20 emitters, is expected to be an [O II] emitter.
Additional evidence that the observed lines are predominantly Ly lines at associated with the radio galaxy is provided by their velocity distribution, which has a dispersion of km s-1 and a FWHM of km s-1 (Fig. 2), which is 4 times smaller than the FWHM of the narrowband filter. Further, the velocity distribution peaks within 200 km s-1 of the radio galaxy Ly peak, corrected for absorption (De Breuck et al. 1999).
For all these reasons we interpret the observed emission lines as Ly. To estimate the redshifts, flux densities, and widths (FWHM) of the lines, a Gaussian function was fitted to each of the one-dimensional spectra. Details will be provided in a future paper (B.P. Venemans et al., in preparation).
3.1.2 Significance and properties of the overdensity
The next question to be addressed is to what extent the statistics of our detections represent a significant overdensity of galaxies in the field. A “blank-field” study of Ly emitters at approximately the same redshift is the Large-Area Lyman Alpha survey (LALA survey, Rhoads et al. 2000). Preliminary results of this survey indicate a number density of deg-2 for objects with EWÅ and line + continuum erg s-1 cm-2. For our field the second criterion corresponds to and we expect such Ly emitters within our probed volume. However, 9 of the confirmed emitters satisfy the above criteria (including the radio galaxy). In our cosmology the comoving volume density of the LALA survey is Mpc-3. The volume density in our field is Mpc Mpc-3. The difference in number density is /. However, the FWHM of the velocity distribution is approximately 4 times smaller than the FWHM of the filter (see Fig. 2). This implies that our radio galaxy field is overdense in Ly emitters by a factor of 15 compared with a blank field.
The spatial distribution of the emitters is not homogeneous (Fig. 3). The structure appears to be bound in the northwest but our FOV is not large enough to show a boundary in the south. The size of the structure is therefore at least 6′ 4′, which corresponds to greater than 2.7 Mpc 1.8 Mpc. Remarkably, the radio galaxy, probably the most massive system in the structure, does not appear to be at the center of the protocluster, in disagreement with models for the formation of dominant cluster galaxies (e.g., West 1994).
3.2 Radio galaxy halo
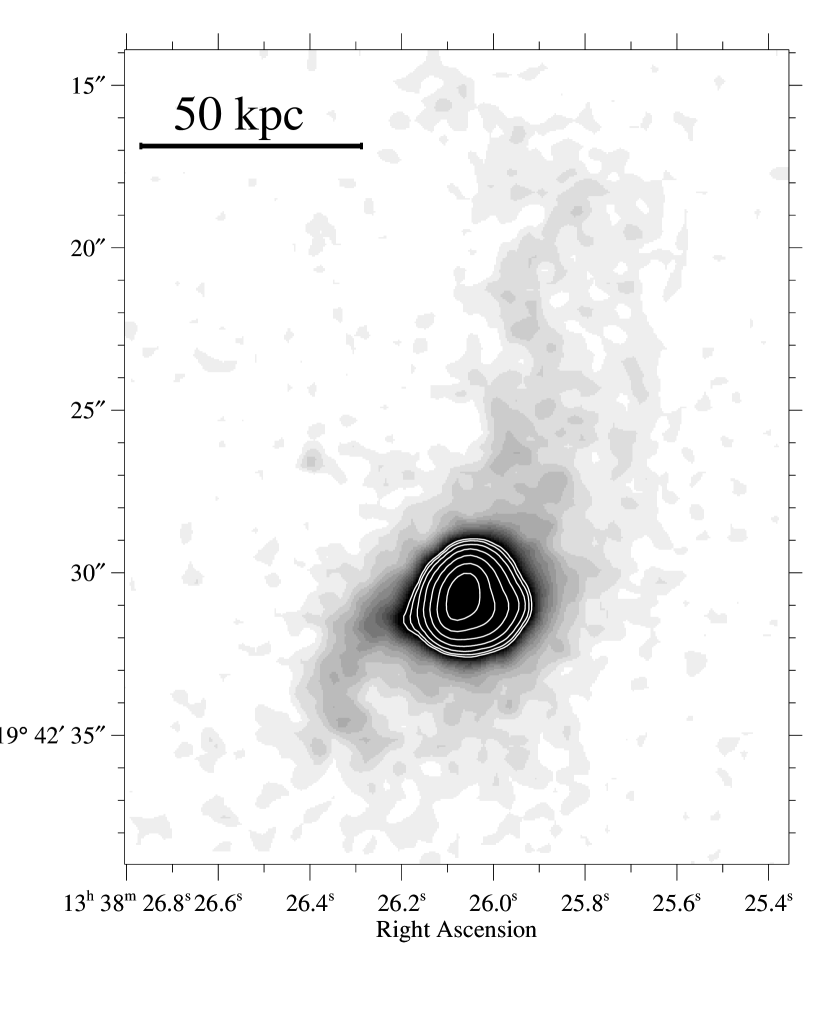
The radio galaxy is located close to the apparent north-west boundary of the galaxy overdensity structure. The radio emission is dominated by two components, separated by 55 (De Breuck et al. 1999). The brightest component coincides with the optical emission, while the other is in the south-east, towards the center of the galaxy overdensity. A spectacular feature of the radio galaxy, visible in the narrowband image, is the large Ly halo (Fig. 4). Although giant Ly halos are a common feature of HzRGs, they are usually fairly symmetrically extended around the radio galaxy. In the case of TN J1338–1942, the halo is highly asymmetric and extends for ″ (110 kpc) to the north-west, i.e., away from the center of the overdensity structure. In its narrowness and asymmetry the TN J1338–1942 halo is unique among known distant radio galaxies. Possible mechanisms to produce this structure include cooling flows in colliding sub-structures and buoyancy effects (Gisler 1976) and will be considered in a subsequent paper.
4 Discussion
4.1 Nature of the overdensity
Could the structure that we have detected be a protocluster at that will evolve into a rich cluster of galaxies in the local Universe? At the Universe is Gyr old, too short for the structure to have virialized since the mean crossing time for galaxies at the observed velocity dispersion is at least 4 Gyr. Thus the observed velocities are probably infall velocities of the galaxies accreting onto a large overdensity. The total mass of this structure can be estimated by using with the mean density of the Universe and the mass overdensity within our volume (Steidel et al. 1998). The mass overdensity is related to the galaxy overdensity through , where takes into account the redshift space distortions caused by peculiar velocities and is the bias parameter. From the statistics of redshift “spikes”, Steidel et al. (1998) argue that . Taking in the range 3–5 and assuming that the structure is just breaking away from the Hubble expansion, is estimated to be 0.5–2.3, giving a mass of our structure of (1–2) . This is comparable to the mass of the Lyman break galaxy overdensity (spike) found by Steidel et al. and to that of the Coma cluster (e.g., Fusco-Femiano & Hughes 1994).
4.2 Relation to overdensity spikes
It is instructive to compare the number of luminous radio sources at to the number of redshift spikes. Steidel et al. (1998) estimate that about one velocity spike is detected in each 9′ 18′ field in their spectroscopic survey, corresponding to redshift spikes in the whole sky. Their survey is sensitive to redshifts between 2.7 and 3.4, corresponding to a cosmic evolution time of 0.6 Gyr.
How many luminous radio sources are there at ? Using the pure luminosity evolution model of Dunlop & Peacock (1990) to describe the steep spectrum radio luminosity function, we estimate that in the redshift range there should be radio sources with luminosities exceeding erg s-1 Hz-1 sr-1 at 2.7 GHz (“Cygnus A type” radio sources: P2.7GHz(Cygnus A) erg s-1 Hz-1 sr-1, Becker, White, & Edwards 1991). Assuming that HzRGs are only once active for yr (Blundell & Rawlings 1999), we expect the number of (previously) active radio sources in this redshift range to be .
Hence, the luminosity functions and lifetimes of luminous radio sources are consistent with every velocity “spike” in the space densities of Lyman break galaxies being associated with a massive galaxy that has been or will become a luminous radio source once. Note that West (1994) presented similar statistical evidence to argue that distant powerful radio galaxies are the precursors of cD galaxies at the centers of galaxy clusters.
5 Conclusion
We have found a structure of 20 Ly-emitting galaxies around the high redshift radio galaxy TN J1338–1942. The overdensity of this protocluster is on the order of 15 compared to field samples. Our results demonstrate that by , megaparsec-scale structure had already formed.
Together with our previous data, this implies that the most luminous radio sources are tracers of regions of galaxy overdensity in the early Universe. The estimated masses of – are consistent with the overdensities being ancestors of rich clusters of galaxies in the local Universe.
References
- Aragon-Salamanca et al. (1998) Aragón-Salamanca, A., Baugh, C. M., & Kauffmann, G. 1998, MNRAS, 297, 427
- Bahcall & Fan (1998) Bahcall, N. A. & Fan, X. 1998, ApJ, 504, 1
- Baldwin & Stone (1984) Baldwin, J. A. & Stone, R. P. S. 1984, MNRAS, 206, 241
- Becker et al. (1991) Becker, R. H., White, R. L., & Edwards, A. L. 1991, ApJS, 75, 1
- Bertin & Arnouts (1996) Bertin, E. & Arnouts, S. 1996, A&AS, 117, 393
- Blundell & Rawlings (1999) Blundell, K. M. & Rawlings, S. 1999, Nature, 399, 330
- Bunker et al. (1995) Bunker, A. J., Warren, S. J., Hewett, P. C., & Clements, D. L. 1995, MNRAS, 273, 513
- Carilli et al. (1997) Carilli, C. L., Röttgering, H. J. A., van Ojik, R., Miley, G. K., & van Breugel, W. J. M. 1997, ApJS, 109, 1
- De Breuck et al. (1999) De Breuck, C., van Breugel, W., Minniti, D., Miley, G. K., Röttgering, H. J. A., Stanford, S. A., & Carilli, C. 1999, A&A, 352, L51
- De Breuck et al. (2002) De Breuck, C., van Breugel, W., Stanford, S. A., Röttgering, H. J. A., Miley, G. M., Stern, D. 2002, AJ, in press (astro-ph/0109540)
- Dunlop & Peacock (1990) Dunlop, J. S. & Peacock, J. A. 1990, MNRAS, 247, 19
- Fusco-Femiano & Hughes (1994) Fusco-Femiano, R. & Hughes, J. P. 1994, ApJ, 429, 545
- Gisler (1976) Gisler, G. R. 1976, A&A, 51, 137
- Hogg et al. (1998) Hogg, D. W., Cohen, J. G., Blandford, R., & Pahre, M. A. 1998, ApJ, 504, 622
- Jansen et al. (2000) Jansen, R. A., Fabricant, D., Franx, M., & Caldwell, N. 2000, ApJS, 126, 331
- Kurk et al. (2000) Kurk, J. D., et al. 2000, A&A, 358, L1
- Le Fèvre et al. (1996) Le Fèvre, O., Deltorn, J. M., Crampton, D., & Dickinson, M. 1996, ApJ, 471, L11
- Oke (1990) Oke, J. B. 1990, AJ, 99, 1621
- Pascarelle et al. (1996) Pascarelle, S. M., Windhorst, R. A., Driver, S. P., Ostrander, E. J., & Keel, W. C. 1996, ApJ, 456, L21
- Pentericci et al. (2000a) Pentericci, L., et al. 2000a, A&A, 361, L25
- Pentericci et al. (1999) Pentericci, L., Röttgering, H. J. A., Miley, G. K., McCarthy, P., Spinrad, H., van Breugel, W. J. M., & Macchetto, F. 1999, A&A, 341, 329
- Pentericci et al. (2000b) Pentericci, L., Van Reeven, W., Carilli, C. L., Röttgering, H. J. A., & Miley, G. K. 2000b, A&AS, 145, 121
- Rhoads et al. (2000) Rhoads, J. E., Malhotra, S., Dey, A., Stern, D., Spinrad, H., & Jannuzi, B. T. 2000, ApJ, 545, L85
- Röttgering et al. (1996) Röttgering, H. J. A., West, M. J., Miley, G. K., & Chambers, K. C. 1996, A&A, 307, 376
- Steidel et al. (1998) Steidel, C. C., Adelberger, K. L., Dickinson, M., Giavalisco, M., Pettini, M., & Kellogg, M. 1998, ApJ, 492, 428
- Steidel et al. (1999) Steidel, C. C., Adelberger, K. L., Giavalisco, M., Dickinson, M., & Pettini, M. 1999, ApJ, 519, 1
- Stone & Baldwin (1983) Stone, R. P. S. & Baldwin, J. A. 1983, MNRAS, 204, 347
- van Ojik et al. (1997) van Ojik, R., Röttgering, H. J. A., Miley, G. K., & Hunstead, R. W. 1997, A&A, 317, 358
- West (1994) West, M. J. 1994, MNRAS, 268, 79