Deep Ly imaging of two z=2.04 GRB host galaxy fields ††thanks: Based on observations made with the Nordic Optical Telescope, operated on the island of La Palma jointly by Denmark, Finland, Iceland, Norway, and Sweden.,††thanks: Based on observations made with the NASA/ESA Hubble Space Telescope, obtained from the data archive at the Space Telescope Institute. STScI is operated by the association of Universities for Research in Astronomy, Inc. under the NASA contract NAS 5-26555.
We report on the results of deep narrow-band Ly and broad-band U and I imaging of the fields of two Gamma-Ray bursts at redshift z=2.04 (GRB 000301C and GRB 000926). We find that the host galaxy of GRB 000926 is an extended (more than 2 arcsec), strong Ly emitter with a rest-frame equivalent width of 71 Å. The galaxy consists of two main components and several fainter knots. GRB 000926 occurred in the western component, whereas most of the Ly luminosity (about 65%) originates in the eastern component. Using archival HST images of the host galaxy we measure the spectral slopes () of the two components to = 2.40.3 (east) and 1.40.2 (west). This implies that both components contain at most small amounts of dust, consistent with the observed strong Ly emission. The western component has a slightly redder VI colour than the eastern component, suggesting the presence of at least some dust. We do not detect the host galaxy of GRB 000301C in neither Ly emission nor in U and I broad-band images. The strongest limit comes from combining the narrow and U-band imaging where we infer a limit of U(AB)27.7 (2 limit per arcsec2). The upper limits on the Ly flux implies a Ly equivalent width upper limit of Å. We find eleven and eight other galaxies with excess emission in the narrow filter in the fields of GRB 000301C and GRB 000926 respectively. These galaxies are candidate Ly emitting galaxies in the environment of the host galaxies. Based on these detections we conclude that GRB 000926 occurred in one of the strongest centres of star formation within several Mpc, whereas GRB 000301C occurred in an intrinsically very faint galaxy far from being the strongest centre of star formation in its galactic environment. Under the hypothesis that GRBs trace star formation, the wide range of GRB host galaxy luminosities implies a very steep faint end slope of the high redshift galaxy luminosity function.
Key Words.:
cosmology: observations – gamma rays: bursts1 Introduction
In addition to the very important question of what may be the central engine of Gamma-Ray Bursts (GRBs, see van Paradijs et al. 2000 for a recent review) these enigmatic events constitute a powerful new tool for the study of the intermediate and high redshift galaxy population. This is mainly because GRB selection of galaxies is independent of other selection methods such as continuum flux (e.g. Steidel & Hamilton 1992; Steidel et al. 1996; Adelberger & Steidel 2000; Fontana et al. 2000), gas absorption (Wolfe et al. 1986; Møller & Warren 1993, 1998; Leibundgut & Robertson 1998; Fynbo et al. 1999; Kulkarni et al. 2000, 2001; Ellison et al. 2001; Warren et al. 2001; Møller et al. 2001) or Ly- emission (see below). By comparing the results of these very different methods by which to select high redshift galaxies we can better understand the selection biases inherent to each method and hence obtain a more complete understanding of the underlying population of high redshift galaxies (see also Møller et al. 2001).
Since the first detection of an optical afterglow of a GRB in 1997 (van Paradijs et al. 1997) the detection of about 25 GRB host galaxies have been reported (Hogg & Fruchter 1999 and references therein; Bloom et al. 1999; Holland & Hjorth 1999; Hjorth et al. 2000; Klose et al. 2000; Fruchter 2001; Vreeswijk 2001; Castro-Tirado et al. 2001; Holland et al. 2001; Fynbo et al. 2001a, Fruchter et al. 2001a; Kaplan et al. 2001; Fruchter et al. 2001b; Bloom et al. 2001). Only for GRB 990308 has an unambiguous detection of the host galaxy not yet been reported. GRB host galaxies have been detected in a very broad range of redshifts from z=0.43 (GRB 990712) to z=4.50 (GRB 000131) excluding GRB 980425 at z=0.0085 which may be a burst of different nature. Furthermore, the measured optical magnitudes of GRB hosts also span a very wide range from V=22.8 (GRB 980703) to V30 (GRB 980326, GRB 990510, GRB 000301C). This span is both due to a wide range of distance moduli and a large spread in absolute magnitudes. In fact, GRB-selection of galaxies is currently the only technique that allows the detection of galaxies over such a wide range of redshifts and absolute luminositites. Most host galaxies detected so far are estimated to be fainter than L∗ at similar redshifts (L∗ is here defined from the fit to a Schechter function to the observed luminosity function at the given redshift). This fact may be due to intrinsic extinction in the GRB host galaxies (Sokolov et al. 2001), but it is not known if GRB host galaxies have more than average intrinsic extinction compared to other galaxies at similar redshifts. In general GRB host galaxies are actively star-forming, i.e. characterised by restframe UV emission and large emission-line equivalent widths (Bloom et al. 2002; Fruchter et al. in prep.). Searches for sub-mm emission from GRBs (Smith et al. 1999, 2001) show that GRB host galaxies are in general not similar to the obscured star bursts detected in deep SCUBA and ISO surveys (e.g. Ivison et al. 2000; Franceschini et al. 2001).
In this paper we present a study of the host galaxies and environments of the two z2 bursts GRB 000301C and GRB 000926. The goal is to place the host galaxies and their galactic environments in the context of other z2 galaxies. The redshifts of the two bursts have both been determined via absorption lines in the spectra of the optical afterglow. GRB 000301C was at z=2.040 (Smette et al. 2001; Castro et al. 2000; Jensen et al. 2001) and GRB 000926 at z=2.038 (Fynbo et al. 2001c; Castro et al. 2001; Møller et al. in prep.). The host galaxy of GRB 000301C is very faint with estimates of its magnitude between R=28.0 (Bloom et al. 2002) and R=29.7 (Levan, private communication; Fruchter et al. in prep.), whereas in the case of GRB 000926 Fynbo et al. (2001a) and Price et al. (2001) report the detection of an extended R=24 galaxy consisting of several compact knots near the position of the optical afterglow. Here we use narrow-band Ly observations to probe these two host galaxies and to search for other galaxies in their environments. It is presently unknown whether the galactic environments of GRB host galaxies are overdense or representative of the general field. Narrow-band Ly observations are ideal to address this question as it has been shown to be an efficient way to probe the faint end of the galaxy population at redshifts 2z5 (Møller & Warren 1993; Francis et al. 1995; Pascarelle et al. 1996; Thommes et al. 1997; Pascarelle et al. 1998; Cowie & Hu 1998; Hu et al. 1998; Fynbo et al. 1999, 2000; Kudritzki et al. 2000; Kurk et al. 2000; Pentericci et al. 2000, Steidel et al. 2000; Roche et al. 2000; Rhoads et al. 2000; Malhotra & Rhoads 2002; Fynbo et al. 2001b). Ly selection has the advantage that it is not continuum flux limited and hence allows the detection of high redshift proto–galaxies, or Ly Emitting Galaxy-building Objects (LEGOs, Møller & Fynbo 2001), that are intrinsically much fainter than those selected in continuum flux limited surveys. However, since not all galaxies are Ly emitters (about 30% of the R25 z3 Lyman-Break galaxies are (Steidel et al. 2000)), galaxy samples selected from Ly emission will not be complete to the continuum flux limit of the sample.
The paper is organised in the following way. In Sect. 2 we describe the observations and the data reduction, in Sect. 3 we present our results and in Sect. 4 we discuss the implications of our results. We have assumed a cosmology where = 65 km s-1 Mpc-1, , and . For this cosmology a redshift of 2.04 corresponds to a luminosity distance = 17.16 Gpc and a distance modulus of 46.17. One arcsecond corresponds to 9.00 proper kpc and the look-back time is 11.1 Gyr.
2 Observations and Data reduction
The observations were carried out during five dark, photometric/clear nights in May 2001 and four dark nights in August 2001 at the 2.56-m Nordic Optical Telescope (NOT) using the Andalucía Faint Object Spectrograph and Camera (ALFOSC). The ALFOSC detector is a 20482 pixels thinned Loral CCD with a pixel scale of 0189.
The fields of GRB 000301C and GRB 000926 were imaged in three filters: the standard U and I filters and a special narrow-band filter manufactured by Custom Scientific Inc. The narrow-band filter (CS3701/45) is tuned to Ly at z=2.04 and has a width of 45 Å (corresponding to a redshift width of for Ly or a Hubble flow depth of 3600 km s-1). The filter transmission curves of the CS3701/45, U and I filters are shown in Fig. 1.
In order to reduce the contribution to the total noise from read-out noise, the detector was binned 2 by 2 during the narrow-band observations, and the integration times for the individual exposures was set to 4000 s. The total integration times for the GRB 000301C field was 12.2 hours (CS3701/45), 7.3 hours (U-band), and 3.0 hours (I-band). For the field of GRB 000926 total integration times were 12.2 hours (CS3701/45), 7.3 hours (U-band), and 3.1 hours (I-band). The journal of observations is presented in Table LABEL:obs-journal. The individual exposures were bias-subtracted and flat-field corrected using standard techniques. The individual reduced images were combined using a -clipping routine optimised for faint sources (for details see Møller & Warren, 1993). The full-width-at-half-maximum (fwhm) of point sources in the combined images are 083 (I-band), 125 (U-band) and 124 (CS3701/45).
| date | filter | Exp.time 301C | Exp.time 926 |
|---|---|---|---|
| (s) | (s) | ||
| May 20 | CS3701/45 | 8000 | 8000 |
| May 20 | U | 2500 | 3750 |
| May 20 | I | 3200 | 2400 |
| May 21 | CS3701/45 | 8000 | 8000 |
| May 21 | U | 2500 | 2500 |
| May 21 | I | 2100 | 3300 |
| May 22 | CS3701/45 | 11800 | 11800 |
| May 22 | U | - | 1250 |
| May 22 | I | 2700 | 1700 |
| May 23 | CS3701/45 | 8000 | 8000 |
| May 23 | U | 2500 | 1250 |
| May 23 | I | 1200 | 1500 |
| May 24 | CS3701/45 | 8000 | 8000 |
| May 24 | U | 3750 | 2500 |
| May 24 | I | 1500 | 2100 |
| Aug 13 | U | - | 3000 |
| Aug 14 | U | 3000 | 4500 |
| Aug 15 | U | 6000 | 3000 |
| Aug 16 | U | 6000 | 4500 |

In order to calibrate the narrow-band observations the four HST spectrophotometric standard stars feige66, feige67, BD+25o4655, and BD+33o2642 (Colina & Bohlin 1994) were observed. We obtained well sampled Spectral Energy Distributions (SEDs) of these four stars from the archive of the HST Calibration Data Base System111ftp://ftp.stsci.edu/cdbs/cdbs1/calspec/. We then calculated the AB magnitudes of the stars in the narrow filter as the weighted mean of the AB magnitudes within the filter, where the filter transmission was used as weight. We find AB magnitudes of 9.96, 11.08, 9.06, and 10.64 for feige66, feige67, BD+25o4655, and BD+33o2642 respectively. Instrumental magnitudes were measured in a 11 arcsec circular aperture. To the difference between standard AB magnitudes and instrumental magnitudes as a function of airmass we finally fitted a zero-point and an extinction term. For counts given as electrons per second we find a zero-point of 21.57 and an extinction term of 0.42 magnitudes per unit airmass. The broad-band images were calibrated using secondary standards from Henden et al. (2000) and brought onto the AB-system using the transformations given in Fukugita et al. (1995): U(AB) = U+0.69; I(AB) = I+0.43.
3 Results

Contour plots of the combined narrow-band images of the 340340 arcsec2 fields surrounding the two GRB positions are shown in Fig. 2. The position of 19 candidate LEGOs (see Sect. 3.3 below) are indicated with circles, and the position of 7 galaxies with a deficit of flux in the narrow filter (see Sect. 3.5) are shown with squares. The position of GRB 000301C is indicated with an ‘’.
3.1 Object Detection
In order to create a catalogue of reliable candidate emission-line galaxies we need robust detection and precise colours. We use the software SExtractor (Bertin & Arnouts, 1998) for both detection and photometry. SExtractor uses a detection image to build the isophote apertures and then measures the fluxes of objects in the narrow, U, and I images in these apertures. Because the narrow band is inside the U-band, the optimal detection of emission line objects is obtained on a detection image created as a weighted sum of the combined narrow-band and U-band images. We found that the weights which optimized the Signal-to-Noise (S/N) ratio of emission line objects were 0.7 and 0.3 for the narrow-band and U-band images respectively. This combined image was then convolved with a Gaussian filter with a width similar to that of the combined seeing. For the SExtractor input detection parameters we used a minimum area of 5 (binned) pixels 1.1 above the noise in the background. In our final catalogue we only include objects detected at a total S/N ratio larger than 5 in an isophotal aperture in the narrow-band. In total we found 648 objects in the two fields. Objects detected at the 5 levels in the narrow-band have AB isophotal magnitudes of approximately 25.5.222In the following we shall denote with “n” the magnitude in the narrow filter. This corresponds to an observed emission line flux of 210-17 erg s-1 cm-2 (for details on the photometry see Sect. 3.2). In a 30 circular aperture the 5 limit is n(AB)=25.0 corresponding to 3.510-17 erg s-1 cm-2. The combined U-band image is 1 magnitude deeper for continuum sources, i.e. U(AB)=26.5 at 5 significance in the isophotal aperture.
3.2 Photometry
To derive colours for all detected objects we measure the isophotal magnitudes. The isophotal apertures are defined on the detection image, and the same (small) aperture is then used for all three frames narrow, U and I. To the extent that the seeing of the images in the different passbands are equal, which is the case for the U and narrow-band images, and if the morphologies of the objects are independent of colour the isophotal magnitudes therefore provide photometry appropriate for accurate colour determination. The systematic error on the U-I colours caused by the slightly better seeing in the combined I image is much smaller than the photometric errors and hence ignored. To estimate the total magnitudes of the objects the isophotal aperture is too small. Instead we use aperture photometry with 30 and 40 apertures and determine aperture corrections based on the radial profiles of the candidate emission galaxies as described in Sect. 3.4.
We calculate two-sided error-bars on magnitudes as
where is derived by SExtractor. We calculate error-bars on colours using the maximum likelihood analysis described in appendix A.


3.3 Selection of Candidate LEGOs
For the final selection of candidate LEGOs we use the “narrow minus on-band-broad” versus “narrow minus off-band-broad” colour/colour plot technique (Møller & Warren 1993; Fynbo et al. 1999, 2000b). In order to constrain where objects with no special spectral features in the narrow filter fall in the diagram, we calculate colours based on synthetic galaxy SEDs taken from the Bruzual & Charlot 1995 models. We have used models with ages ranging from a few Myr to 15 Gyr and with redshifts from 0 to 1.5 (open squares) and models with ages ranging from a few Myr to 1 Gyr with redshifts from 1.5 to 3.0 (open triangles). Higher redshifts are not relevant for our 3700 Å selected survey. For the colours of high redshift galaxies we include the effect of intergalactic Lyman line absorption (Møller & Jakobsen 1990; Madau 1995). In Fig. 3 we show the n(AB)U(AB) versus n(AB)I(AB) colour diagram for the calculated galaxy colours (upper panel) and for the observed sources in the two GRB fields (middle and lower panels). The open squares in the upper panel shows the colours of the model SEDs. The dashed line indicates where objects with broad-band colour equal to that of the host galaxy of GRB 000926, and with either absorption or emission in the narrow filter, will fall. Emission line objects will fall in the lower left corner of the diagram (due to excess emission in the narrow-filter). In the middle panel we show the colour-colour diagram for all objects detected in the two fields. Several objects are found to lie significantly away from the locus of continuum objects.
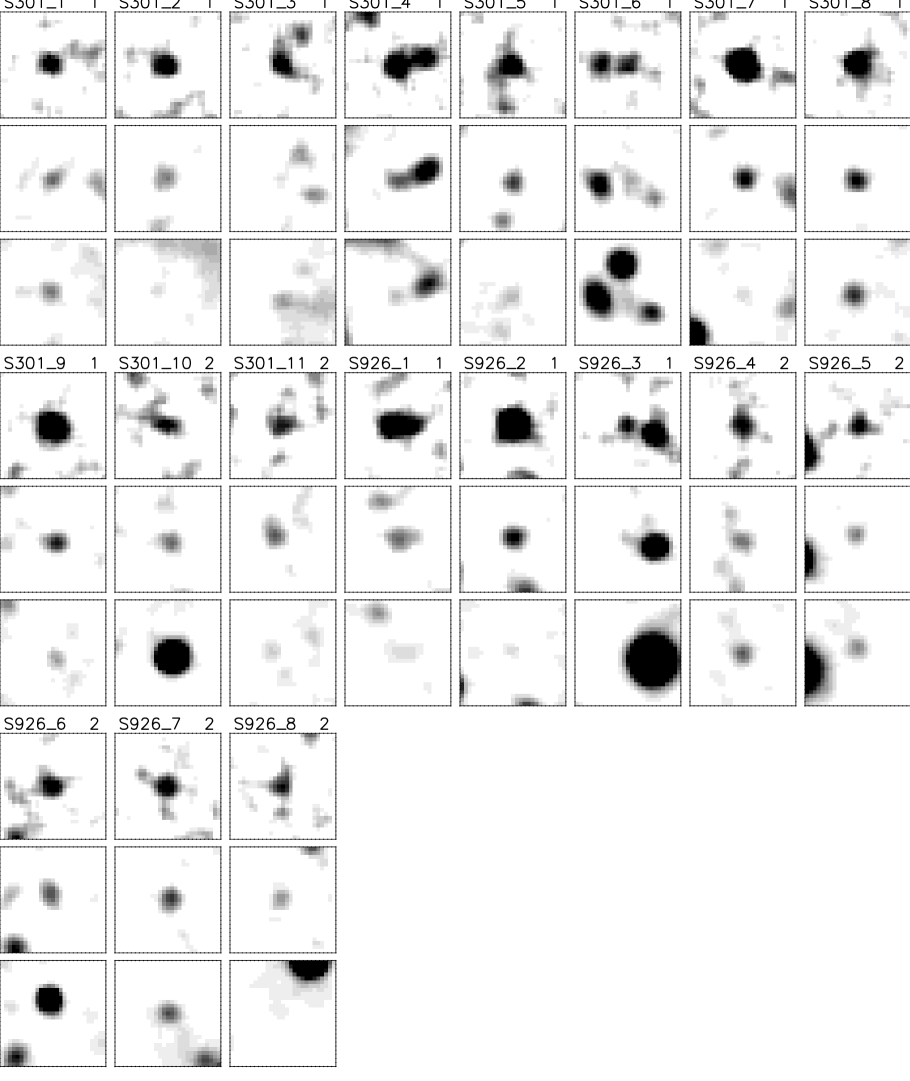
The probability that a Ly emitter will separate itself significantly from the pure continuum objects is a (complex) function of its continuum magnitude, colour, and Ly emission line equivalent width. It is therefore necessary to define a strategy to most effciently identify the Ly emitters. One may decide to err on the low probability side (providing a large list of candidates but with fairly low confirmation fraction, e.g. 30% in the work by Arnaboldi et al. 2001 and references therein) or on the high probability side (shorter candidate list, but higher confirmation efficiency, e.g. 100% in Warren & Møller (1996), Kudritzki et al. (2000), and Fynbo et al. (2001b)). Both strategies have their merits and their drawbacks; the conservative candidate list will likely miss a number of objects while the non-conservative candidate list in the end may provide a few more confirmed LEGOs, but at the price of a much lower efficiency during spectroscopic confirmation. However, when spectroscopic follow-up is done via MOS (Multi-Object Spectroscopy) one can to some extent have the best of both strategies as the less secure candidates can be used for slits not covered by the secure candidates. We therefore decided to make a ranked candidate list in the following way: We first select all objects with S/N5 in the narrow-band image and an isophotal colour n(AB)U(AB). We find 32 such objects. We subsequently rank these candidates in four groups, 1:certain, 2:good, 3:possible, and 4:rejected. For the rank 1,2, and 3 groups we expect rough confirmation efficiencies of 100%, 75% and 50% respectively. We base the rank on visual inspection (to exclude spurious detections or objects with wrong colours due to bright neighbours) and on the aperture photometry (the aperture colour should also be consistent with excess emission in the narrow filter). In the following we will only discuss the 12 and 7 candidates that fall in the certain and good categories (our conservative candidate list). The possible candidates we plan to use as fill-up objects during the follow-up spectroscopic observations. The colours of the rank 1 and 2 candidates are shown in the lower panel of Fig. 3. We find eleven rank 1 and 2 candidate LEGOs in the field of GRB 000301C and eight in the field of GRB 000926 (including the host galaxy). In Table LABEL:candprop1 and Table LABEL:candprop2 we list the photometric properties of the rank 1 and 2 candidates. In Fig. 5 we show regions of size 1010 arcsec2 around each candidate from the combined narrow-band (top row), U-band (centre row), and I-band (bottom row) images. In Fig. 2 we show the distribution of the candidate LEGOs in each of the two fields projected on the sky. In the field of GRB 000301C (the left plot) the candidates are all located in the southern part of the field. In the field of GRB 000926 the eight galaxies are more uniformly distributed over the field of view. The skewed distribution of LEGOs in the field of GRB 000301C suggests a large scale structure, possibly a filament similar to the one found in the field of the z=3.04 QSO Q1205-30 (Møller & Fynbo 2001). Spectroscopic follow-up is needed to place the LEGOs in 3D redshift space.
Below we describe how we determine Ly fluxes, Ly equivalent widths and star formation rates for the candidate LEGOs.
Ly fluxes: We determine Ly fluxes, , as
where is the transmission curve of the narrow filter, is the top transmission of the filter, the term is the “effective” width of the filter (equal to 45 Å), and is the average specific flux of the source determined from the narrow-band AB magnitude, n(AB), as
Ly equivalent widths: To estimate equivalent widths we derive the relation between the n(AB)-U(AB) colour and the observed equivalent width (W). The n(AB)-U(AB) colour for an object with specific flux is given by the expression:
where and are the transmission curves of the narrow and broad-band U filters respectively. We assume that the specific flux is a constant, , except for an emission line with Gaussian profile at Å with equivalent width . Under these assumptions we have
where is a Gaussian function with area equal 1.
Finally, we use and insert in the expression for n(AB)-U(AB) above to obtain the relation between Wem(obs) and n(AB)-U(AB). Assuming instead that is constant leads to practically the same relation.
Star formation rates: Kennicutt (1983) has derived the following scaling relation between the Star Formation Rate (SFR) and the H luminosity L(H):
Assuming negligible dust extinction we can use the case B recombination (relevant for gas that is optically thick in the H i resonance lines) ratio L(Ly)/L(H)=8.7 (Brocklehurst 1971) to derive L(H), where L(Ly) = , and hence the SFR. The effects of dust will be to reduce the Ly flux for a given SFR (Charlot & Fall 1993; Valls-Gabaud 1993; Deharveng et al. 1995; see also Neufeld 1991). Therefore SFRs derived in this way must be considered lower limits.
The Ly fluxes, Ly equivalent widths and SFRs for the candidate LEGOs appear in Table LABEL:candprop1 and Table LABEL:candprop2.
3.4 Extendedness of Ly emission
Previous studies have found evidence that the Ly emission is more extended than the continuum emission (Møller & Warren 1998; Fynbo et al. 2001). To test whether this is also the case for the Ly emitters in this study we proceed as follows. Because the individual sources are too faint for precise profile fits, we stack the isolated rank 1 candidates and measure the radial profile on the stacked image in narrow-band, U, and I. We compare the profiles with the profile of the same number of point sources stacked in the same way. The results of this procedure are shown in the three panels of Fig. 4. The Ly objects are clearly extended. Furthermore, although the S/N is lower than for the narrow-band profile, there is marginal evidence that the continuum sources of the Ly objects are less extended than the Ly emission itself.
We finally use the profiles of the point-sources and the candidate Ly emitters to determine the aperture corrections for our 30 and 40 circular apertures relative to a 11 circular aperture (as used for the standard stars, Sect. 2). We find aperture corrections for the 30(40) apertures of 0.36(0.21), 0.27(0.15) and 0.23(0.14) mag for narrow, U and I respectively.

3.5 Narrow-band absorption objects
Roughly half of the Lyman-Break selected Galaxies have Ly in absorption (e.g. Shapley et al. 2001, their Fig. 7). In order to detect z=2.04 galaxies with absorption in the narrow-band filter, we run SExtractor using the combined U-band image as detection image, hence optimising the detection of objects that are bright in the U-band. We detect 515 and 578 objects above S/N=5 in isophotal apertures in the fields of GRB 000301C and GRB 000926 respectively. Since the observations were tuned to select objects with excess emission in the narrow-band filter the combined narrow-band image is about 1 magnitude shallower than the combined U-band image for objects with flat SEDs. We can therefore only detect a deficit of emission in the narrow filter for relatively bright U-band selected objects (brighter than U(AB)=25.3). As candidates we select galaxies with colours above n(AB)U(AB)=0.6 within 1. We detect two and five such galaxies in the field of GRB 000301C and GRB 000926 respectively. Their positions are indicated with squares in Fig. 2. Deep follow-up spectroscopy is required to confirm if these objects are high redshift galaxies with strong z=2.04 intrinsic or intervening Ly absorption lines.
| Object | n(AB) | U(AB) | I(AB) | f(Ly) | Wem(obs) | SFRLyα |
|---|---|---|---|---|---|---|
| 10-17 erg s-1 cm-2 | Å | M☉ yr-1 | ||||
| Isophote | ||||||
| S301_1 | 25.07 | 25.98 | 24.28 | 3.36 0.54 | 69 | 0.920.15 |
| S301_2 | 24.88 | 26.16 | 26.34 | 3.98 0.58 | 130 | 1.090.16 |
| S301_3 | 24.98 | 26.80 | 26.52 | 3.64 0.52 | 325 | 1.000.14 |
| S301_4a | 23.91 | 25.13 | 25.44 | 9.80 0.87 | 120 | 2.680.24 |
| S301_5 | 24.54 | 25.50 | 24.80 | 5.46 0.64 | 75 | 1.490.18 |
| S301_6a | 25.48 | 26.90 | 25.17 | 2.30 0.42 | 163 | 0.630.11 |
| S301_7 | 23.11 | 24.87 | 25.67 | 20.40 1.05 | 292 | 5.580.29 |
| S301_8 | 24.13 | 25.18 | 23.72 | 7.95 0.75 | 88 | 2.180.21 |
| S301_9 | 23.30 | 24.90 | 24.56 | 17.14 1.00 | 223 | 4.690.27 |
| 30 aperture | ||||||
| S301_1 | 24.58 | 25.49 | 23.88 | 5.27 1.04 | - | 1.440.28 |
| S301_2 | 24.29 | 25.27 | 25.92 | 6.89 1.06 | - | 1.880.29 |
| S301_3 | 24.32 | 26.15 | 25.92 | 6.72 1.06 | - | 1.840.29 |
| S301_4a | 23.74 | 25.07 | 25.82 | 11.39 1.09 | - | 3.120.30 |
| S301_5 | 24.16 | 25.10 | 24.30 | 7.73 1.07 | - | 2.120.29 |
| S301_6a | 24.43 | 25.52 | 23.94 | 6.05 1.05 | - | 1.660.29 |
| S301_7 | 23.11 | 24.83 | 25.92 | 20.47 1.11 | - | 5.600.30 |
| S301_8 | 23.87 | 24.86 | 23.39 | 10.14 1.08 | - | 2.770.30 |
| S301_9 | 23.27 | 24.90 | 24.64 | 17.54 1.10 | - | 4.800.30 |
| 40 aperture | ||||||
| S301_1 | 24.59 | 25.27 | 23.91 | 5.20 1.26 | - | 1.420.34 |
| S301_2 | 24.33 | 25.09 | 25.62 | 6.64 1.28 | - | 1.820.35 |
| S301_3 | 24.14 | 25.94 | 25.62 | 7.87 1.30 | - | 2.160.36 |
| S301_4a | 23.59 | 24.73 | 25.62 | 13.10 1.33 | - | 3.590.37 |
| S301_5 | 24.08 | 25.14 | 24.01 | 8.33 1.30 | - | 2.280.36 |
| S301_6a | 24.24 | 25.10 | 23.10 | 7.23 1.29 | - | 1.980.35 |
| S301_7 | 23.02 | 24.77 | 25.63 | 22.09 1.36 | - | 6.050.37 |
| S301_8 | 23.75 | 24.77 | 23.42 | 11.26 1.33 | - | 3.080.36 |
| S301_9 | 23.15 | 24.84 | 24.84 | 19.75 1.36 | - | 5.410.37 |
| Isophote | ||||||
| S926_1b | 23.35 | 24.94 | 24.17 | 16.30 1.02 | 217 | 4.460.28 |
| S926_2 | 22.78 | 24.52 | 25.85 | 27.73 1.14 | 287 | 7.590.31 |
| S926_3a | 25.50 | 27.04 | 24.73 | 2.27 0.40 | 204 | 0.620.11 |
| 30 aperture | ||||||
| S926_1b | 23.48 | 24.94 | 24.24 | 14.49 1.04 | - | 3.970.28 |
| S926_2 | 22.83 | 24.60 | 25.57 | 26.39 1.06 | - | 7.220.29 |
| S926_3a | 24.91 | 25.66 | 22.16 | 3.88 0.97 | - | 1.060.26 |
| 40 aperture | ||||||
| S926_1b | 23.23 | 24.75 | 23.81 | 18.26 1.38 | - | 5.000.38 |
| S926_2 | 22.70 | 24.57 | 25.89 | 29.67 1.40 | - | 8.120.38 |
| S926_3a | 24.68 | 25.60 | 21.60 | 4.80 1.27 | - | 1.310.35 |
a Broad-band photometry affected by bright nearby object.
b The host galaxy of GRB 000926.
| Object | n(AB) | U(AB) | I(AB) | f(Ly) | Wem(obs) | SFRLyα |
|---|---|---|---|---|---|---|
| 10-17 erg s-1 cm-2 | Å | M☉ yr-1 | ||||
| Isophote | ||||||
| S301_10a | 25.40 | 26.57 | 21.67 | 2.48 0.42 | 108 | 0.680.11 |
| S301_11 | 25.74 | 26.62 | 27.02 | 1.81 0.36 | 65 | 0.490.10 |
| 30 aperture | ||||||
| S301_10a | 24.67 | 25.58 | 20.54 | 4.83 1.03 | - | 1.320.28 |
| S301_11 | 24.55 | 25.49 | 25.07 | 5.41 1.04 | - | 1.480.29 |
| 40 aperture | ||||||
| S301_10a | 24.68 | 25.74 | 20.43 | 4.79 1.25 | - | 1.310.34 |
| S301_11 | 24.49 | 25.24 | 24.79 | 5.72 1.26 | - | 1.570.35 |
| Isophote | ||||||
| S926_4 | 25.04 | 25.76 | 24.06 | 3.46 0.56 | 47 | 0.950.15 |
| S926_5 | 25.33 | 26.25 | 24.78 | 2.64 0.44 | 70 | 0.720.12 |
| S926_6 | 24.72 | 25.45 | 23.71 | 4.64 0.65 | 48 | 1.270.18 |
| S926_7 | 24.79 | 25.56 | 23.89 | 4.34 0.57 | 52 | 1.190.16 |
| S926_8 | 25.64 | 26.59 | 25.80 | 1.98 0.39 | 74 | 0.540.11 |
| 30 aperture | ||||||
| S926_4 | 24.46 | 25.11 | 23.74 | 5.91 1.00 | - | 1.620.27 |
| S926_5 | 24.81 | 25.65 | 23.94 | 4.28 0.97 | - | 1.170.27 |
| S926_6 | 24.27 | 25.14 | 22.40 | 7.00 1.01 | - | 1.910.28 |
| S926_7 | 24.48 | 24.91 | 23.48 | 5.76 0.99 | - | 1.580.27 |
| S926_8 | 24.75 | 25.61 | 24.95 | 4.50 0.98 | - | 1.230.27 |
| 40 aperture | ||||||
| S926_4 | 24.39 | 24.97 | 23.62 | 6.25 1.30 | - | 1.710.36 |
| S926_5 | 24.83 | 25.59 | 23.95 | 4.19 1.26 | - | 1.150.34 |
| S926_6 | 24.21 | 24.91 | 21.94 | 7.37 1.32 | - | 2.020.36 |
| S926_7 | 24.48 | 24.84 | 23.20 | 5.75 1.29 | - | 1.570.35 |
| S926_8 | 24.60 | 25.88 | 24.53 | 5.20 1.28 | - | 1.420.35 |
a Broad-band photometry affected by bright nearby object.
3.6 The host galaxies
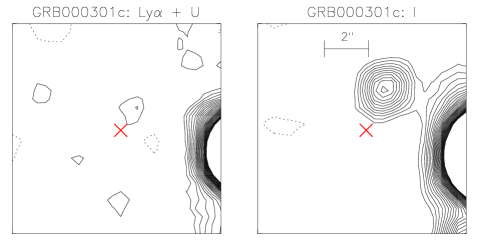
We now discuss what can be inferred on the properties of the host galaxies from the observations presented here. The host galaxy of GRB 000301C is not detected in any of the bands. In Fig. 6 we show a 1010 arcsec2 region centred on the position of the afterglow of GRB 000301C from the combined I-band image and from a weighted sum of the combined Ly and U-band images. We calculate the weight as the inverse of the variance of the background after scaling to the same flux level. In the I-band we detect the red galaxy 2 arcsec north of the afterglow also seen in the STIS images by Smette et al. (2001). In the Ly + U-band image we detect no significant emission from either this red galaxy or from the host of GRB 000301C found by Fruchter et al. (2001a) above an estimated 2 limit of U27.7 per arcsec2. Since the host is very faint (R=28–30, Bloom et al. 2002; Levan private communication; Fruchter et al. in prep) this non-detection is not surprising.
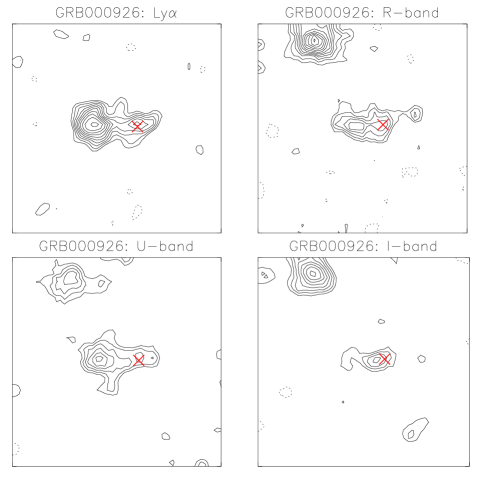
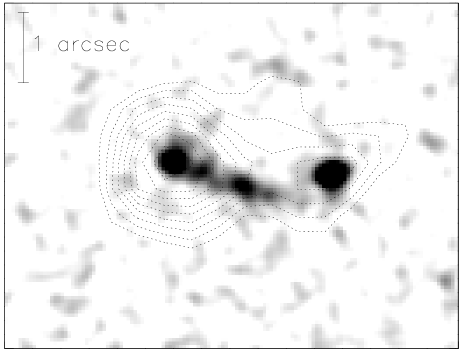
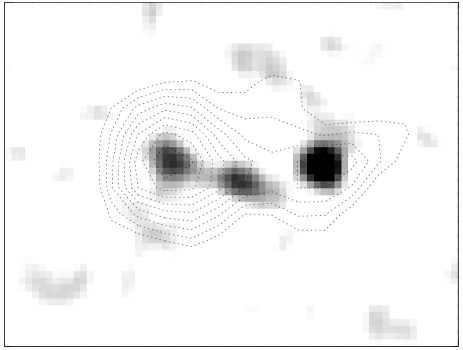
The host galaxy of GRB 000926 is detected in all bands and is a strong Ly emitter with a rest-frame equivalent width of the Ly emission line of 71 Å. The galaxy is shown in more detail in Fig. 6. Deep HST images of the host has been reported by Price et al. (2001) and Castro et al. (2001). These images confirm what was found from the ground based R-band images (Fynbo et al. 2001b and Fig. 6), namely that there are several compact objects within a few arcsec, one of which coincide with the position of the OT. To better compare the extent of the Ly emission to that of the continuum we retrieved and drizzled (Fruchter & Hook 2002) the May 19 2001 F606W HST imaging data of the host from the HST archive. These data are published in Castro et al. (2001). In the top panel of Fig. 7 we show a section of the F606W image together with the contours of the Ly emission. The Ly emission covers all of the components seen in the continuum and we conclude that they are all at the same redshift and hence part of the host galaxy and/or its environment. As a simple model we fit the Ly image with two point sources using DAOPHOT (Stetson 1987, 1997). The derived distance between the two best fitting point sources is 2.220.08 arcsec (corresponding to 20.0 kpc), which is consistent with the distance between the brightest knots in the HST image (2.250.01 arcsec). From the point source fit we find that about 65% of the Ly emission is emitted from the eastern compact knot and 35% from the western knot. The position of the western (Ly) knot is spatially coincident with the position of the OT to within 2 of our error of about 0.10 arcsec on the relative astrometry between the R-band image with the OT from Fynbo et al. (2001a) and the Ly image. Castro et al. (2001) measure an impact parameter of the OT relative to the centroid of the western (continuum) knot of 324 mas based on five epochs of F606W images of the OT superimposed on the host galaxy.
As seen from Fig. 6 the western and eastern knots seem to have different broad band colours with the western component being the reddest. To better quantify this we also retrieved the F814W HST image from May 20 (lower panel in Fig. 7 – not drizzled due to the lower S/N of the host in the F814W image) and measured the magnitudes of the two brightest components of the host in F606W and F814W images. In these images we measure the AB colours (V606 I814)AB = 0.110.11 and (V606 I814)AB = 0.190.07 for the eastern and western components respectively. Using the relation between (V606 I814)AB, redshift and the spectral slope () derived by Meurer et al. (1999) we derive spectral slopes = 2.40.3 and 1.40.2 for the two components. Based on the relation also derived by Meurer et al. (1999) we conclude that the eastern component must be essentially dust free (the derived value of is formally negative, but consistent with 0), whereas for the western component we find = 1.60.4. The luminosity-weighted mean value of for the sample of Lyman-Break galaxies studied by Meurer et al. (1999) is 1.80.2.
The restframe EW of 71 Å is within the range of 50–200 Å expected for dust-free galaxies (Charlot & Fall 1993). Furthermore, the SFR derived from the Ly flux in the 40 aperture taking into account the aperture correction is 6 M☉ yr-1. This is only about a factor of 2 lower than what we found based on the restframe 2100 Å continuum flux (Fynbo et al. 2001a). This means that there cannot be large amounts of dust in the host galaxy to absorb the resonantly scattered Ly photons. This is consistent with the low values of derived above and with the low SMC-like extinction measured from the optical afterglow (Fynbo et al. 2001b; Price et al. 2001).
Of all the candidate LEGOs, the Ly emission from the host galaxy of GRB 000926 is the only to have an obvious multi-component morphology. This suggests that we see several galaxy sub-clumps (or LEGOs as we call them) in the process of merging and that the GRB could be related to a merging induced starburst.
If we assume a R-band magnitude of R=28 for the GRB 000301C host galaxy it is about 40 times fainter than GRB 000926 host galaxy. If the GRB 000301C host has the same colour and Ly equivalent width, its Ly flux will be 410-18 erg s-1 cm-2 which is a factor of 5 below the (5) detection limit in the narrow-band image. Hence, our data does not exclude that the GRB 000301C host galaxy is also a high equivalent width Ly emitter.
3.7 Exclusion of contamination due to foreground emission line sources
For searches for high redshift emission-line galaxies it is important to realize that lower redshift galaxies with other emission lines in the narrow filter can mimic high redshift Ly candidates (e.g. Stern et al. 2000; Fynbo et al. 2001c). For the host galaxy of GRB 000926 the redshift is known from the spectroscopy of the Optical Transient (OT) (Fynbo et al. 2001d; Castro et al. 2001; Møller et al. in prep.). For the remaining candidate LEGOs we here consider other possible emission line sources than Ly at z=2.04. We can exclude foreground galaxies with [O ii] in the narrow filter, since such objects would have to be at redshift z=0 and hence be much brighter than our candidates. Distant planetary nebulae in the galaxy could be selected due to their strong O ii emission lines, but such planetary nebulae are very rare at the high galactic latitudes of our fields (+44.4o and +37.3o respectively). In total only about 10 planetary nebulae are known in the Milky Way halo (Howard et al. 1997). Other possible explanations are C iv 1550 Å at z=1.39 or Mg ii 2800 Å at z=0.32. The presence of strong C iv and Mg ii emission requires an underlying AGN. The surface density of AGN at z2.2 down to a B-band magnitude of 22.5 is 130 deg-2 (Hartwick & Schade 1990). If we extrapolate to B=25.0 using the observed faint end slope of we find 800 deg-2. Hence, we expect 6 z2.2 AGNs to this limit in each of our 27.6 arcmin2 fields. The probability that these fall in the small volumes at z=0.32 and z=1.39 (0.18% and 1.9% of the total comoving volume out to z=2.2 respectively) probed by our filter is small, especially since the space density of AGNs is declining rapidly with decreasing redshift. We therefore do not expect a significant C iv and Mg ii contamination due to AGN. In conclusion, the only probable explanation for the excess emission in the narrow filter is Ly at z=2.04.
4 Discussion and conclusions
4.1 LEGOs
We first compare the photometric and other properties of the candidate LEGOs in the fields of GRB 000301C and GRB 000926 to properties of z2 galaxies found in other surveys.
Fontana et al. (2000) have determined photometric redshifts for galaxies in the HDF and NTT deep fields. From their catalogue we find 22 galaxies with photometric redshifts within z=0.15 of z=2.04. The I(AB) magnitudes of these galaxies range from I(AB)=23.7 to I(AB)=25.8. The range of I(AB) magnitudes for the candidate LEGOs in our fields is extending to somewhat fainter magnitudes as 4 of the 19 candidates are not detected above the 2 level of 25.6 in the 30 aperture.
Kurk et al. (2000) and Pentericci et al. (2000) have detected and spectroscopically confirmed 14 LEGOs in the field around the radio galaxy PKS1138-262 using narrow-band observations. They reach a 5 detection limit of 1.410-17 erg s-1 cm-2 over a field of 38 arcmin2 at z=2.156. Their filter spans a redshift range of = 0.054. Their survey parameters are therefore similar to ours. The inferred number of LEGOs per arcmin2 per unit redshift in their survey is 6.81.8. We expect to confirm 100% (75%) of our rank 1 (rank 2) candidates, hence 17 LEGOs total in two 27.6 arcmin2 fields observed with a filter spanning = 0.037. This corresponds to 8.32.0, which is consistent with the density found by Pentericci et al. (2000).
Pentericci et al. (2000) estimate that their field is a factor of 6 overdense relative to the field, but this estimate is very uncertain as it is based on i) only the four brightest objects in their sample, ii) a comparison with the spike of Lyman-Break galaxies observed by Steidel et al. (2000) at a significantly larger redshift (z=3.09) and with different selection criteria, and iii) an assumption about the (unknown) fraction of galaxies at z=2.16 that are Ly emitters. Hence, we consider the evidence for an overdensity to be at best weak. Unfortunately, there are currently no similar (in redshift and depth) surveys for Ly emitters in blank fields so we do not know yet whether the QSO and GRB fields are both equally overdense or if they represent the mean density of LEGOs at z2 (which we consider more likely). We are currently undertaking a large blank field survey at the Nordic Optical Telescope using the same filter with the purpose of examining the density and spatial distribution of LEGOs in blank fields.
4.2 GRB host galaxies
This study confirms what is already known from broad-band studies, namely that GRBs occur in galaxies covering a very broad range of luminosities. The faintest host galaxies detected so far in the broad-bands are the hosts of GRB 000301C and GRB 990510 at R29.7 and R29.2 and the host of GRB 980326 at V30.3 (Levan, private communication; Fruchter et al. in prep.).
We have used deep Ly narrow band imaging to map out the star formation in volumes around the host galaxies of two GRBs. GRB 000926 occurred in one of the strongest centres of star formation within several Mpc, whereas GRB 000301C occurred in an intrinsically very faint galaxy far from being the strongest centre of star formation in its galactic environment (cf. Table LABEL:candprop1).
What is the underlying mechanism for GRBs? The answer to this question is still not known, but we now have several vital clues. It has been noted that GRB host galaxies generally are UV bright and have emission lines with large equivalent widths (Bloom et al. 2002; Fruchter et al. in prep.), indicating that they are actively star forming. This result is supported by our detection of strong Ly emission from the host of GRB 000926, and is not contradicted by the lack of Ly emission from the host of GRB 000301C where even a very high Ly rest equivalent width of 150 Å would have remained undetectable in our deep narrow band image. It is quite natural therefore, to hypothesize that the GRB phenomenon is linked to star formation (Paczyński 1998). A strong prediction from this hypothesis is that the GRB host galaxies are drawn from the underlying population of high redshift galaxies weighted with the integrated star formation rate in each magnitude bin. If the LF of the underlying population was flat, then we would predict that all GRB host galaxies should be very bright. Conversely a very steep LF would result in all GRB host galaxies being drawn from the very faintest galaxies. The observation that GRB host galaxies span a very wide range of luminosities therefore places constraints on the allowed range of faint end slopes of the LF. For example, if we use a standard Schechter form
of the LF, and use R∗=23.5333For Lyman-Break galaxies at z=3.0 Adelberger & Steidel (2000) find R∗=24.54, which roughly corresponds to R=23.5 at z=2.0 then a simple calculation shows that the observed flat distribution in the range R=24 to R=30 requires a faint end slope . Such a steep (steeper than in the local universe) faint end slope is in good agreement with the faint end slope for Lyman-Break galaxies at z=3.0 (, Adelberger & Steidel, 2000), and with the faintness and small impact parameters of high redshift DLA galaxies (Fynbo et al. 1999; Møller et al. 2001). The current data set is therefore compatible with the hypothesis that GRBs trace star formation, and the outlook for impending advance on this question is good. A full statistical treatment of a slightly larger sample of GRB host galaxies would significantly decrease the error bars on , and would show if it remains compatible with the faint end slope of the LBGs. More importantly, the GRB host galaxies probe fainter magnitudes than the LBG samples and will therefore reveal if there is a turn-over, or if the faint end slope continues. The question of how far the faint end of the LF continues with unchanged slope is important for the determination of the total star formation rates at high redshifts.
Acknowledgements
The data presented here have been taken using ALFOSC, which is owned by the Instituto de Astrofisica de Andalucia (IAA) and operated at the Nordic Optical Telescope under agreement between IAA and the NBIfAFG of the Astronomical Observatory of Copenhagen. MA acknowledges the support of the U. of Oulu astrophysics group. JG acknowledges the the receipt of a Marie Curie Research Grant from the European Commission. MPE and MW acknowledge support from the ESO Directors Discretionary Fund. JUF, MPE and MW acknowledges excellent support at the NOT during the 5 nights in May at which most of the data presented here were obtained. This work was supported by the Danish Natural Science Research Council (SNF). JUF is supported by an ESO research fellowship. We thank P. Vreeswijk and R. Mendez for helpful discussions and our referee N. Panagia for comments that improved our manuscript on several important points.
References
- (1) Adelberger, K., Steidel, C.C., 2000, ApJ, 544, 218
- (2) Andersen, M.I., Hjorth, J., Pedersen, H., et al., 2001, A&A, 364, L54
- (3) Arnaboldi, M., Alfonso, J., Aguerri, L., et al., AJ in press (astro-ph/0110522)
- (4) Bertin, E., Arnouts, S., 1996, A&AS, 117, 393
- (5) Bloom, J.S., Kulkarni, S.R., Djorgovski, S.G., 2002, AJ in press
- (6) Bloom, J.S., Odewahn, S.G., Djorgovski, S.G., et al., 1999, ApJ, 518, L1
- (7) Bloom, J.S., Fox, D., Kulkarni, S.R., et al., 2001, GCN#1133
- (8) Brocklehurst, M. 1971, MNRAS, 153, 471
- (9) Castro, S.M., Diercks, A., Djorgovski, S.G., et al., 2000, GCN# 605
- (10) Castro, S.M., Galama, T.J., Harrison, F.A., et al., 2001, submitted to ApJ (astro-ph/0110566)
- (11) Castro-Tirado, A. J. and Sokolov, V. V. and Gorosabel, J., et al., 2001, A&A, 370, 398
- (12) Colina, L., Bohlin, R.C., 1994, AJ, 108, 1931
- (13) Cowie, L.L., Hu, E.M., 1998, AJ, 115, 1319
- (14) Charlot, S., & Fall, S.M. 1993, ApJ, 415, 580
- (15) Derharveng, J.-M., Buat, V., Bergeron, J., 1995, A&A, 298, 57
- (16) Ellison, S.L., Pettini, M., Steidel, C.C., Shapley, A.E., 2001, ApJ, 549, 770
- (17) Fontana, A., D’Odorico, S., Poli, F., et al., 2000, AJ, 120, 2206
- (18) Franceschini, A., Aussel, H., Cesarsky, C. J., Elbaz, D., Fadda, D., 2001, A&A, 378, 1
- (19) Francis, P.J., Woodgate, B.E., Warren, S.J., et al., 1995, ApJ, 457, 490
- (20) Fruchter, A., 2001, GCN#1029
- (21) Fruchter, A., Hook, R., 2002, PASP, 114, 144
- (22) Fruchter, A., Vreeswijk, P., et al., 2001a, GCN#1063
- (23) Fruchter, A., Burud, I., Rhoads, J., Levan, A., 2001b, GCN#1087
- (24) Fukugita, M., Shimasaku, K., Ichikawa, T., 1995, PASP, 107, 945
- (25) Fynbo, J.U., Møller, P., Warren, S.J., 1999, MNRAS, 805, 849
- (26) Fynbo, J.U., Thomsen, B., Møller, P., 2000, A&A, 858, 457
- (27) Fynbo, J.U., Gorosabel, J., Dall. T.H., et al., 2001a, A&A, 373, 796
- (28) Fynbo, J.U., Møller, P., Thomsen, B., 2001b, A&A, 374, 343
- (29) Fynbo, J.U., Gorosabel, J., Møller, P., et al., 2001c, In: “Lighthouses of the Universe”, in press (astro-ph/0110603)
- (30) Hartwick, F.D.A., Schade, D., 1990, ARAA, 28, 437
- (31) Henden, A., 2000, GCN#583
- (32) Hjorth, J., Holland, S., Courbin, D., et al., 2000, ApJ, 539, L147
- (33) Hogg., D.W., Fruchter, A.S., 1999, ApJ, 520, 54
- (34) Holland, S., Hjorth, J., 1999, A&A, 344, L67
- (35) Holland, S., Fynbo, J.U., Hjorth, J., et al., 2001, A&A, 371, 52
- (36) Howard, J.W., Henry, R.B.C., McCartney, S., 1997, MNRAS, 284, 465
- (37) Ivison, R.J., Smail, I., Barger, A.J., et al., 2000, MNRAS 315, 209
- (38) Jensen, B.L., Fynbo, J.U., Gorosabel, J., et al., 2001, A&A, 370, 909
- (39) Kaplan, D.L., Eisner, J.A., Kulkarni, S.R., Bloom, J.S., 2001, GCN#1069
- (40) Kennicutt, R.C, 1983, ApJ, 272, 54
- (41) Klose, S. and Stecklum, B. and Masetti, N., et al., 2000, ApJ, 545, 271
- (42) Kudritzki, R.-P., Méndez, R.H., Feldmeier, J.J., et al., 2000, ApJ, 536, 19
- (43) Kulkarni, V.P., Hill, J.M., Schneider, G., et al., 2000, ApJ, 536, 36
- (44) Kulkarni, V.P., Hill, J.M., Schneider, G., et al., 2000, ApJ, 551, 37
- (45) Kurk, J.D., Röttgering, H.J.A., Pentericci, L., et al., 2000, A&A, 358, L1
- (46) Leibundgut, B., Robertson, G., 1998, MNRAS, 303, 711
- (47) Madau, P., 1995, ApJ, 441, 18
- (48) Malhotra, S., Rhoads, J.E., 2002, ApJ, 565, L71
- (49) Meurer, G.R., Heckman, T.M., Calzetti, D., 1999, ApJ, 521, 64
- (50) Møller, P., & Jakobsen, P. 1990, A&A 228, 299
- (51) Møller, P., & Warren, S.J. 1993, A&A 270, 43
- (52) Møller, P., & Fynbo, J.U., 2001, A&A, 372, L57
- (53) Møller, P., Warren, S.J., Fall M., Fynbo, J.U., Jakobsen, P., 2001, submitted to ApJ
- (54) Neufeld, D.A. 1991, ApJ, 370, L85
- (55) Paczyński, B., 1998, ApJL, 494, L45
- (56) van Paradijs, J., Groot, P.J., Galama, T., et al., 1997, Nature 386, 686
- (57) van Paradijs, J., Kouveliotou, C., & Wijers, R.A.M.J., 2000, ARA&A 38, 379
- (58) Pascarelle, S. M., Windhorst, R. A., Driver, S. P., Ostrander, E. J., Keel, W. C., 1996, ApJ, 456, L21
- (59) Pascarelle, S.M., Windhorst, R.A., Keel, W.C., 1998, AJ, 116, 2659
- (60) Pentericci, L., Kurk, J.D., Röttgering, H.J.A., et al., 2000, A&A, 361, L25
- (61) Price, P.A., Harrison, F.A., Galama, T.J., et al., 2001, ApJ, 549, L7
- (62) Rhoads, J. E. and Malhotra, S. and Dey, A., et al., 2000, ApJ, 545, L85
- (63) Roche, N., Lowenthal, J., Woodgate, B., 2000, MNRAS, 317, 937
- (64) Smette, A., Fruchter, A.S., Gull, T.R., et al., 2001, ApJ, 555, 70
- (65) Smith, I.A., Tilanus, R.P.J., van Paradijs, J, et al., 1999, A&A, 347, 92
- (66) Smith, I.A., Tilanus, R.P.J., Wijers, R.A.M.J., et al., 2001, A&A, 380, 81
- (67) Thommes, E., Meisenheimer, K., Fockenbrock, R., Hippelein, H., Röser, H.-J., 1997, RvMA, 10, 297
- (68) Sokolov, V. V. and Fatkhullin, T. A. and Castro-Tirado, A. J., et al., 2001, A&A, 372, 438
- (69) Steidel, C.C., Hamilton, D., 1992, AJ, 104, 941
- (70) Steidel, C.C., Giavalisco, M., Pettini, M., Dickinson, M., Adelberger, K., 1996, ApJ 462, L17
- (71) Steidel, C.C., Adelberger, K., Shapley, A.E., et al., 2000, ApJ, 532, 170
- (72) Stern, D., Bunker, A., Spinrad, H., Dey, A., 2000, ApJ 537, 73
- (73) Stetson, P., 1987, PASP 99, 191S
- (74) Stetson, P., 1997, “User’s Manual for DAOPHOT II”
- (75) Valls-Gabaud, D. 1993, ApJ, 419, 7
- (76) Vreeswijk, P. M. and Fruchter, A. and Kaper, L., et al., 2001, ApJ, 546, 672
- (77) Warren, S., Møller, P., 1996, A&A, 311,25
- (78) Warren, S.J., Møller, P., Fall, S.M., Jakobsen, P., 2001, MNRAS, 326, 759
- (79) Wolfe, A.M., Turnshek, D.A., Smith, H.E., Cohen, R.D., 1986, ApJS, 61, 249
Appendix A Errors on colours for faint sources
Here we detail a method by which to calculate two-sided error-bars for sources detected at low signal-to-noise ratio. We wish to calculate the colour for a source with fluxes and in two passbands. We first derive the likelihood function for the flux ratio . To do this we introduce and note that and . The joint likelihood function for and can then be found as
where () is the maximum likelihood estimate. By maximizing the likelihood function in the variable for a fixed value of we find
and
After inserting these expressions we find the likelihood function for of the form
We then determine the two-sided error-bars for the ratio as the two solutions to the equation
Finally, we use the error-bars on to calculate the error-bars on the colour in the same way as for the magnitudes in Sect. 3.2.