X-ray Point Sources in The Central Region of M31 as seen by Chandra
Abstract
We report on Chandra observations of the central region of M31. By combining eight Chandra ACIS-I observations taken between 1999 and 2001, we have identified 204 X-ray sources within the central region of M31, with a detection limit of . Of these 204 sources, 22 are identified with globular clusters, 2 with supernova remnants, 9 with planetary nebula, and 9 as supersoft sources. By comparing individual images, about 50% of the sources are variable on time scales of months. We also found 13 transients, with light curves showing a variety of shapes. We also extracted the energy spectra of the 20 brightest sources; they can be well fit by a single power-law with a mean photon index of 1.8. The spectral shapes of 12 sources are shown to be variable, suggesting that they went through state changes. The luminosity function of all the point sources is consistent with previous observations (a broken power-law with a luminosity break at ). However, when the X-ray sources in different regions are considered separately, different luminosity functions are obtained. This indicates that the star-formation history might be different in different regions.
1 Introduction
At a distance of kpc, M31 provides us with a prime opportunity to study the global properties of a galaxy which is similar to our Galaxy. As M31 and our Galaxy share similar morphology and size, comparisons between their X-ray properties can be enlightening. Even though M31 is further away, studies of X-ray sources within it are simplified relative to our Galaxy for several reasons. Firstly, the distance is well known, allowing us to determine X-ray luminosities accurately. Secondly, the extinction of X-ray sources within M31 is much lower than that typical of sources in our Galaxy, which enables us to study the X-ray properties of M31 over a wider energy band. Finally, the moderate inclination angle of M31 allows us to more easily determine the location of X-ray sources within (or outside of) spiral arms, the galactic bulge, or halo.
M31 has been observed extensively by several earlier X-ray missions. The first detailed observations were made with the Einstein IPC and HRI (Trinchieri & Fabbiano 1991) and over 100 sources were detected at a detection limit of (0.2–4.0 keV). Subsequent ROSAT HRI observations of the central revealed 86 sources at a similar detection limit (Primini, Forman, & Jones 1993, hereafter PFJ93). A comparison of the Einstein and ROSAT source lists showed that 42% of the sources within the central region were variable. Recently, two deep and extensive ROSAT PSPC surveys have identified 560 point sources in the entire disk of M31 (Supper et al. 1997, 2001; hereafter Su97, Su01). The detection limit of this survey was (0.1–2 keV). These 560 sources include 33 globular clusters, 16 supernova remnants, 15 supersoft sources, 55 foreground stars and 10 background objects.
M31 was observed by Chandra and XMM-Newton soon after these observatories were launched. In the first observation (8.8 ks) of the core region by Chandra in 1999 October, 121 point sources were identified within the central region and the nucleus, which had been seen as one source by previous missions, was nicely resolved into five point sources (Garcia et al. 2000a). Moreover, a bright transient was discovered from the nucleus. A relatively deeper XMM-Newton observation (34.8 ks) was made in 2000 June; 116 sources were detected down to a limiting luminosity of (0.3–12 kpc; Shirey et al. 2001) and a pulsating supersoft transient with a periodicity of s was discovered (Osborne et al. 2001). Moreover, both Chandra (Garcia et al. 2001a; Primini et al. 2000) and XMM-Newton (Shirey et al. 2001) observations confirmed that the unresolved X-ray emission in the core region is much softer than most of the resolved X-ray sources in that region. Fifteen X-ray point sources are newly associated with globular clusters (Di Stefano et al. 2002), which when combined with the previous ROSAT results (Su01) brings the total number of M31 globular clusters with detected X-ray emission to 48. The X-ray luminosity of these globular clusters appears to be substantially higher than clusters in our Galaxy; for example, in M31 of the clusters have luminosities (0.5–7.0 keV) as compared to within the Galaxy (Di Stefano et al. 2002). Chandra and XMM-Newton also discovered several bright ( ) transients in M31 and M32 (Garcia et al. 2000a; Garcia et al. 2000b; Osborne et al. 2001; Shirey 2001; Kong et al. 2001; Garcia et al. 2001b). The brightest of these reached a peak luminosity of .
We report herein the properties of the point sources in the central region of M31 as deduced from eight separate ks ACIS-I observations spanning years. The detection limit (while variable) is erg s-1 (0.3–7 keV) across most of this region. In addition to a source catalog, we discuss the overall spectral properties, temporal variability and luminosity function of these sources. The brighter sources have sufficient counts to allow meaningful searches for spectral variability, allowing comparison to Galactic sources. The main focus of this paper is on the complete source list and the overall properties of point sources in M31. In a series of companion papers, we will discuss the diffuse emission (for instance, see Primini et al. 2000 and Dosaj et al. 2001 for a preliminary analysis), the X-ray emission from the central supermassive black hole (Garcia et al. 2002), temporal and spectral variability (Kong et al., in preparation) and supersoft source populations (Di Stefano et al., in preparation)
In this paper, we adopt a distance of 780 kpc (Stanek & Garnavich 1998; Macri et al. 2001) and assume a hydrogen column density equal to the Galactic value of cm-2 (Dickey & Lockman 1990) unless otherwise specified. The quoted errors throughout this paper are at 1- confidence, unless otherwise specified.
2 Observations and Data Reduction
M31 was observed with Chandra regularly as part of the AO-1 and AO-2 GTO program during 1999–2001. The program was designed to search for transients. The observations consist of a series of HRC snapshots ( 1 ks) that cover the entire galaxy. If a transient is discovered in the HRC mosaic, then a follow-up ACIS image ( 5 ks) of the transient is obtained; otherwise an ACIS image of the nucleus is obtained. In this paper we focus only on the ACIS-I (I0, I1, I2 and I3) data obtained for the central region of M31. These data consist of 8 separate observations, with exposure times ranging from 4 to 8.8 ks. The details of the observations are given in Table 1. The nuclear region of M31 was placed near the aim-point of the ACIS-I array. The focal-plane temperature was C during the first four observations, and C for the others. The observations were made at various spacecraft roll angles; consequently, the total region covered by the observations is slightly larger than , and sources near the outer edge of ACIS are not observable in all eight exposures.
All data were telemetered in Faint mode and were collected with a frame transfer time of 3.2 s. In order to reduce the instrumental background, only data with ASCA grades of 0, 2, 3, 4, and 6 were included. We selected data free from bad columns, hot pixels and columns close to the borders of each ACIS chip node. The standard pixel randomization was also removed. Only events with photon energies in the range of 0.3–7.0 keV were included in our analysis. We inspected the background count rates from the ACIS-S3 chip for all of the observations; except for the first observation, no significant background flares were found. For the first observation, periods with high background were rejected, resulting in an effective exposure time of 8.8 ks out of 17.5 ks (see Garcia et al. 2000a for details of this observation).
The data reduction and analysis was done with CIAO v2.1 111http://asc.harvard.edu/ciao/. Some of the image analysis was done with IRAF 222http://iraf.noao.edu/, while the spectra were analyzed with XSPEC v11 333http://heasarc.gsfc.nasa.gov/docs/xanadu/xspec/index.html.
3 Analysis
3.1 X-ray Images
In order to create a deep image suitable for the detection of faint sources, the eight observations were combined into a single stacked image. The rms uncertainty of the aspect solution of Chandra is , but there can be systematic errors (up to ) for specific ACIS-I observations 444see http://asc.harvard.edu/mta/ASPECT/. These errors are larger than the PSF, and therefore could degrade the PSF of the stacked image. We removed these errors by registering all the data sets to the coordinate frame of OBSID00312 using 12 bright X-ray sources within of the aim-point. The positions of these sources were determined from the weighted centroid of the counts in a pixel (= one ACIS pixel) image. The cross registration of the eight data sets is accurate to (as measured from the rms differences in the shifts of the 12 sources).
Because the nuclear region of M31 is particularly crowded (see Garcia et al. 2000a), we were concerned that the accuracy achieved above would be insufficient. We therefore repeated the procedure above on an image of the central , but used a pixel size of (= 1/4 ACIS pixel) scale. Such sub-pixel images can easily be generated using CIAO routines. Any Chandra image in sky co-ordinates must be reconstructed from the instantaneous space-craft dither position, and the arrival times and detector locations of the individual photons. While reconstruction of the image on a scale that matches the detector pixel size is a natural choice, one can just as easily reconstruct the image a finer scale. Of course, the larger size of the detector pixel means that the photon location within this finer scale is randomized by the dither position at the photon arrival time. When we generated a set of sub-pixel images from our 8 observations, we found that we were able to reduce the rms registration errors in the stacked image to .
The absolute astrometry of these images is still limited by the Chandra aspect solution to . We choose to stack the images in the coordinate frame of OBSID00312 merely because it was convenient. The systematic error of this coordinate frame (processing system version R4CU5UPD8.2) should be . While future reprocessing of all Chandra data to remove systematic aspect errors is expected to yield absolute astrometry of , more accurate astrometry may be possible by registering the Chandra image with astrometric catalogs. This has been done by Kaaret (2002) with an HRC image of M31 and the 2MASS catalog to an accuracy of (see Kaaret 2002 for details). The positions listed in Table 2 and throughout this paper use this astrometric reference.
We note that the exposure of the combined image ranges from 4 ks (at the extreme edges) to 39.7 ks (in the center). More than 170 sources have a total integration time of 30 ks.
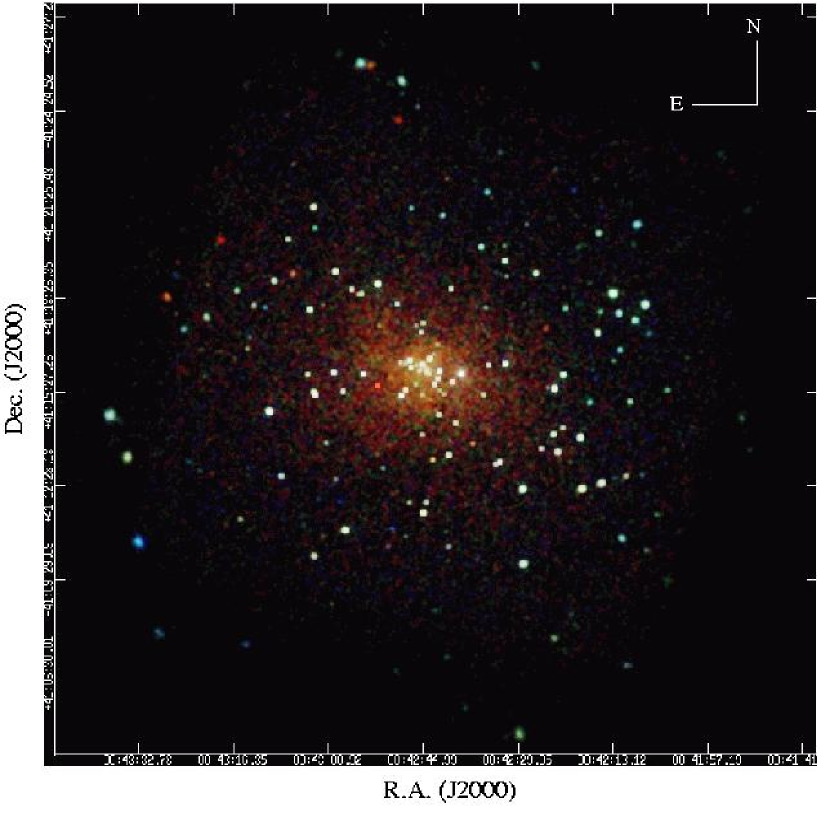
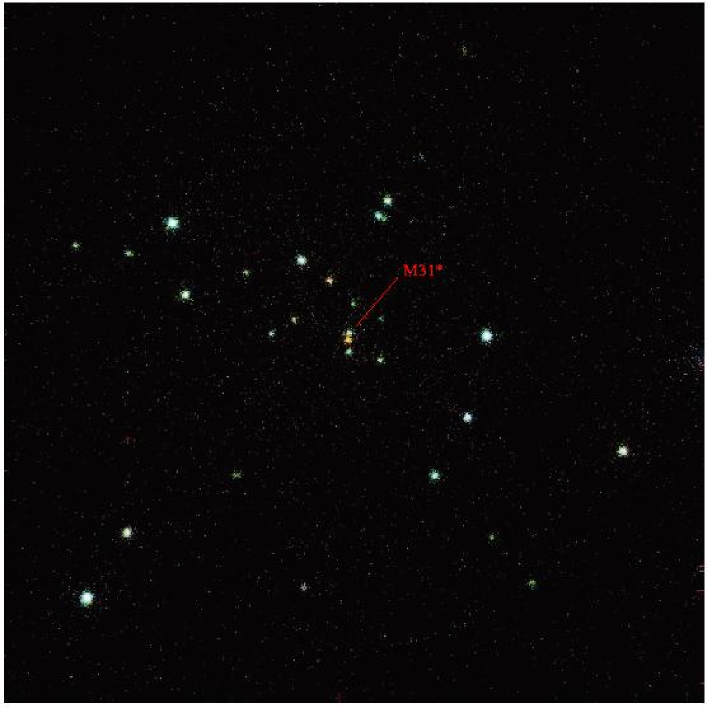
Figure 1 shows the stacked “true color” image of M31, which is a composite of images from soft (0.3–1.0 keV), middle (1–2 keV) and hard (2–7 keV) bands. Soft sources appear red, moderately hard sources appear green, and the hardest sources appear blue. The image has been corrected for exposure and smoothed slightly with a Gaussian () in order to improve the appearance of point sources. In Figure 2, we show the “true color” image of the central region of M31 in pixel resolution, with the possible nuclear counterpart (M31∗) marked (Garcia et al. 2002).
3.2 Source Detection
Discrete sources in the stacked image were found with WAVDETECT (Freeman et al. 2002), a wavelet detection algorithm implemented within CIAO. The central region was treated separately by using the pixel image. The two source lists were combined into the master source list shown in Table 2. We set the detection threshold to be and carried out the wavelet analysis at 9 scales (1, , 2, , 4, , 8, and 16). This detection threshold corresponds to false detection due to statistical fluctuations in the background. We then repeated this procedure on the annular square region between and in size using an image with pixels. On the region outside of the square we used an image with pixels. A total of 205 sources were detected. Source count rates were determined via aperture photometry. The radius of the aperture was varied with average off axis angle in order to match the 90% encircled energy function. The average off axis angle was computed for each source based on the off axis angles of the eight observations weighted by their exposure times. The extraction radius varies from near the aim-point to for the sources with the largest off axis angles.
Background was extracted from an annulus centered on each source. In some cases, for example in the nuclear region, we modified the extraction region to avoid nearby sources. It was also necessary to modify the extraction radius for some faint sources that are close to more luminous sources. Every extraction region was examined carefully in the image. The count rate was corrected for exposure, background variation and instrumental PSF. We examined the image of each detected source, and found only one case in which the detection was clearly spurious (this source had signal-to-noise ratio S/N ).
Table 2 lists the 204 sources in our catalog, sorted in order of increasing R.A. The columns give the source number, the IAU approved name, the position (J2000), the net counts, the count rate and 1- error, hardness ratios (see §3.4) and the 0.3–7.0 keV luminosity. The source numbers have a prefix of r1, r2 and r3. The r1 sources are located in the central or “inner bulge” region. The r2 sources are located within the central excluding the inner bulge region; we refer to this annular region as the “outer bulge”. The r3 sources are located outside the central in the “disk” region. This nomenclature is based on optical studies (Morton, Andereck & Bernard 1977); a similar classification was also used by Trinchieri & Fabbiano (1991). The conversion to luminosities assumes an absorbed power-law spectrum with a photon index of 1.7 and cm-2, which is the typical spectrum of a point source in M31 (Shirey et al. 2001). All sources in the catalog have S/N and only 5 have S/N . The detection limit for the sources varies across the image due to the variations of exposure time, background and instrumental PSF, and is highest near the edges where the PSF broadens rapidly and exposure time is lowest. Over the inner of the field, the detection limit is counts s-1, which is equivalent to erg s-1.
3.3 Source Identification
Tables 3–5 summarize the results of matching our new ACIS source catalog with existing catalogs of M31 objects. Table 3 lists the number of matches found in each of the catalogs we searched, and also the number of accidental (spurious) matches expected. Table 4 lists the catalog identifications of the ACIS sources and the radial offset between the cataloged object and the ACIS source. Table 5 itemizes the matches between our ACIS catalog and the ROSAT HRI source list (PFJ93). We varied the search radius based on the accuracy of the various catalogs (increasing it as needed), and also based on the density of sources in the catalogs (reducing it in order to limit accidental matches).
We used the following catalogs and corresponding search radii:
ROSAT sources: the ROSAT HRI catalog (PFJ93) — search radius.
Globular clusters: the Bologna catalog (Battistini et al. 1987), the catalog by Magnier (1993), and a recent catalog based on HST data by Barmby (2001) — search radius for all three.
Supernova remnants: the lists by d’Odorico et al. (1980), Braun & Walterbos (1993), and Magnier et al. (1995) — search radius.
Planetary nebulae: the catalogs by Ford & Jacoby (1978) and Ciardullo et al. (1989)— search radius.
Extragalactic objects: the NASA/IPAC Extragalactic Database (NED) and SIMBAD — search radius.
M31 stars: the catalog of 485,425 objects (mainly stars) by Haiman et al. (1994) and the SIMBAD — search radius.
Stellar Nova: as reported in the IAUC during the period covered by our observations — search radius.
OB Associations: the catalog of 174 OB associations within M31 identified by Magnier et al. 1993) — search radius.
In order to estimate the accidental correlation rate, we used a technique similar to that described by Hornschemeier et al. (2001). We shifted all the Chandra sources by to the northeast, northwest, southeast, and southwest, and ran the search for each of the catalogs. The results were averaged to estimate the accidental matching rate listed in Table 3. With the exception of the large catalog of M31 stars, the accidental matching rates are generally small, therefore justifying our choice of search radius. For example, the average accidental matching rate with ROSAT sources is 9.5, which is about of the total number of ROSAT matches found (77).
We find two matches with SNR, but predict a random match rate (1.0) that is similar to what we find. However, the unusual nature of the two sources which match with the SNR catalog leads us to believe that these matches are real. Both of these Chandra sources have relatively low hardness ratio values (see §3.4) and Chandra source r3-63 is resolved into a ring-like object (Kong et al. 2002). Both of these identifications are listed in Table 4, and the total number of true SNR IDs is listed in Table 3 as two.
We found 29 Chandra sources (excluding optically identified globular clusters and planetary nebulae) within of objects in the Haiman et al. (1994) catalog, which consists mainly of stars in the field of M31. The number of accidental matches even with this small search radius is 21.25, nearly equal to the number found! This is due to the very high density of objects in this catalog, and leads us to expect that most of the 29 matches are spurious. We note that our searching radius is roughly equal to the astrometric accuracy of the Haiman et al. catalog.
However, one can test these possible identifications with the spectral (or hardness ratio) data. X-ray emission from stars is relatively soft; for instance, the PSPC survey (Su97) showed that the energy spectrum of a foreground star can be best fitted by a Raymond-Smith model with keV or a power-law model with a photon index . However the Chandra sources which have a sufficient number of counts for spectral analysis (see §3.5) have much harder spectra () and are therefore unlikely to be stars. In the remaining cases where there are too few counts we examined the hardness ratio (HR2; see §3.5). If the ratio is inconsistent with a soft spectrum (i.e., if HR2 is greater than ), we similarly rule out a stellar association. In this way we rule out 25 of the possible 29 matches. Table 4 lists the remaining 4 possible stellar identifications. We note the (fortuitous?) agreement in numbers between the number of sources with soft spectra (4) and the accidental matching rate which leads us to expect that out of our possible 29 matches may be real. These numbers are summarized in Table 3.
We find that 77 Chandra sources have counterparts in the ROSAT HRI catalog (see Table 5). The remaining 127 () Chandra sources were not detected in the ROSAT HRI catalog, presumably because they are below the ROSAT detection limit or are variable. The Chandra catalog extends fainter than the ROSAT HRI catalog. We have not compared our Chandra catalog to the new complete ROSAT PSPC catalog (Su01) because the later catalog covers a much larger area and has substantially lower resolution, making it less appropriate to compare to this ACIS data than the HRI catalog. We note that in 6 cases the ROSAT HRI sources match up with 2 or more Chandra sources, indicating either that these ROSAT sources have been resolved by Chandra or that one (or more) of the Chandra sources is transient. It is worth noting that PF93(44) is the nucleus identified by PFJ93. Alternatively, we note that we expect spurious matches with ROSAT sources, so something like % of these multiple matches may be spurious. The expected numbers of spurious matches leads us to list the “true” number of matches as 67 in Table 3.
We identify 22 Chandra sources with globular clusters (see Table 4). Eight of these globular clusters are identified as X-ray sources (comparing to previous ROSAT observations) for the first time, while three of them are new to the recent studies by Chandra (Di Stefano et al. 2002) because of the different roll angles and improved astrometry. Because globular clusters are sometimes used to register M31 images taken at different wavelengths, it may be worth noting that the average radial offset (after taking the average offsets in RA and DEC) between the X-ray and optical positions is . Chandra source r3-74 is within of both mita165 and mita166, but we note that these clusters themselves are separated by only . We therefore allow the possibility that in reality they constitute a single cluster. This possibility, along with the number of expected spurious matches, leads us to list the number of detected globular clusters as 22 in Table 3.
We found 11 matches between Chandra sources and planetary nebula (PN), and expect that of these are spurious matches. Ford 316 is within of both r1-21 and r1-33, both of which are in the very crowded nuclear region of M31. It seems likely that Ford 316 is associated with only one (but not both) of these Chandra sources. Chandra source r1-26 is within of both Ford 21 and Ford 74, but it seems unlikely that both PN would be associated with a single X-ray source. While it is unclear which associations might be spurious, these multiple identifications and the expected number of spurious sources leads us to estimate that there are 9 true associations between PN and Chandra sources (see Tables 3 and 4).
Planetary nebula in our Galaxy are in general rather weak and soft X-ray sources, with erg s-1 and kT keV (Guerrero et al. 2000, 2001). The most luminous PN within our galaxy has erg s-1 and kT keV (Kastner, Vrtilek, & Soker 2001). These Chandra sources have luminosities ranging from erg s-1 to erg s-1 and (with the exception of r2-56) X-ray colors much harder than Galactic PN, raising the possibility that these sources are either very unusual or something other than PN. We note that the Ford & Jacoby (1978) survey identified PN on the basis of on and off band imaging within the 5007Å O [III] line. Symbiotic stars often show strong 5007Å emission and are generally soft X-ray sources of modest intensity, with the single exception of GX 1+4. This object has a hard spectrum and erg s-1 because of its neutron star (as opposed to white dwarf or main sequence) primary. This suggests that these “PN” may in fact be GX 1+4 analogs in M31. Optical spectroscopy could help determine the nature of these sources.
We searched for matches between stellar novae as listed in the IAUC that were contemporaneous with our Chandra observations we found no matches within . Because novae may appear as X-ray sources some time after their optical appearance, we started our search with the nova reported in IAUC 7093 (Stagni, Buonomo, & di Mille 1999 Jan), which appeared months before our first Chandra observation. Other novae include those in IAUC 7218 (Modjaz and Li 1999 July), 7236 (Johnson, Modjaz, & Li 1999 Aug), 7272 (Filippenko et al. 1999 Oct), 7477 (Li, 2000 Aug), 7516 (Donato et al. 2000 Nov) and 7709 (Fiaschi, Di Mille, & Cariolato 2001 Sept). While outside of our search radius (), a nova found in 2001 September (IAUC 7709, Fiaschi, Di Mille & Cariolato 2001) is within of source r2-29. This Chandra source is positionally coincident with XMMU J004234.1+411808, which Osborne et al. (2001) suggested may be an X-ray nova. This source was not detected in the ACIS observation of 2000 June 1 (OBSID 309); it reached a peak flux in an HRC-I observation on 2000 June 6 (OBSID 273), more than one year before the optical nova (see Figure 5). We know of no cases in which the X-ray outburst of an optical nova (or an X-ray nova) proceeded the optical outburst by year, which therefore suggests that the spatial proximity of the two events is a random coincidence. The expectation value of such events is 0.25, so this is moderately possible.
We also searched for matches with OB associations, as O and B stars may be moderate X-ray sources (erg s-1, Berghofer et al. 1997). While this is well below our detection limit, a group of O and/or B stars may reach our detection threshold, and star forming regions could conceivably harbor massive X-ray binaries. However, we found no matches within our search radius of .
We searched for extragalactic emission line objects as listed in NED and SIMBAD, and found a single match (r3-83, see Table 4). AGN are likely to be obscured by the bulge of M31 and therefore we expect that we may detect many AGN without optical counterparts. A better estimate to the numbers of such objects is made based on deep field observations in the next section.
3.4 Hardness Ratios
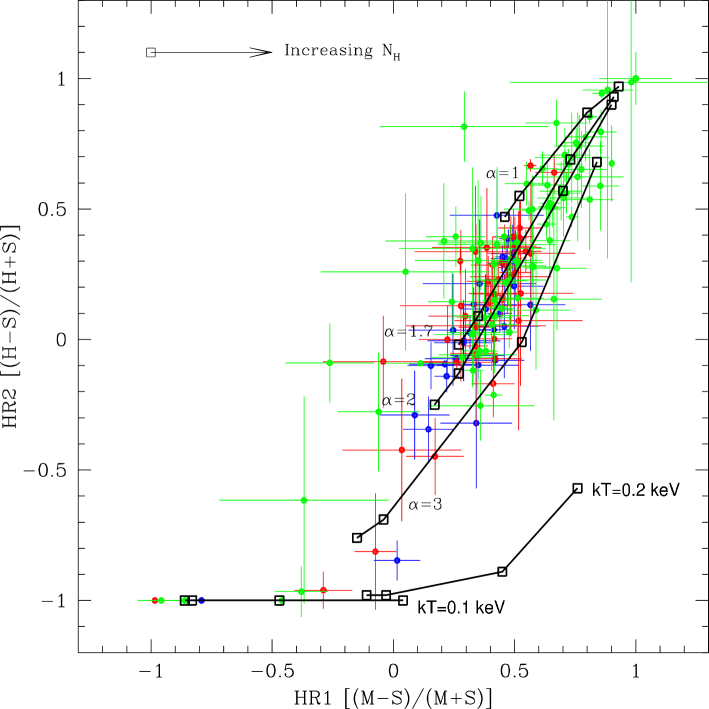
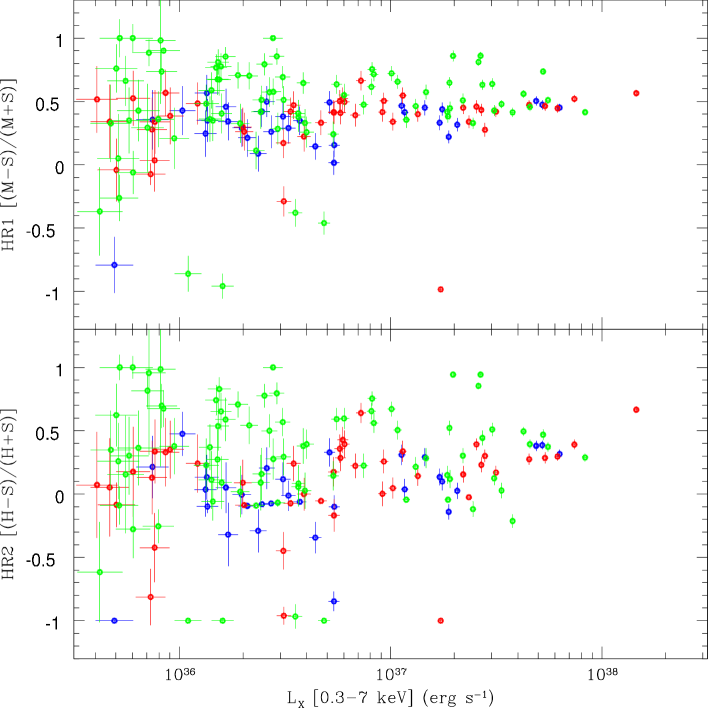
Many of the sources in our catalog have 100 counts, which makes it difficult to derive spectral parameters with meaningful constraints. However, hardness ratios can give a crude indication of the X-ray spectra in these cases. We therefore computed the hardness ratios for all the detected sources. These ratios were based on the source counts in three energy bands: S (0.3–1.0 keV), M (1–2 keV) and H (2–7 keV). The two hardness ratios are defined as HR1=(M-S)/(M+S) and HR2=(H-S)/(H+S). We calculated the uncertainties of the hardness ratios by using maximum likelihood method as used in the Einstein catalog (Harris et al. 1993). Table 2 lists both HR1 and HR2. Figures 3 and 4, respectively, show the color-color diagram (CD) and hardness-intensity diagram (HID) for sources with over 20 counts. We have overlaid the CD with 6 lines showing the tracks followed by representative spectra with differing values of . Power-law spectra tend to occupy the top right section of the diagram, while soft blackbody models occupy the lower left. For example, a “supersoft source” (SSS) having a blackbody spectrum with a temperature of 70 eV and of cm-2 would be in the lower left with HR1= and HR2=. A typical AGN or X-ray binary with a power-law spectrum and a photon index would be in the extreme upper right if cm-2.
From the CD in Figure 3, it is clear that there are three sources with more than 20 counts and with both HR1 and HR2 consistent with (r3-84, r2-12, and r3-8). This indicates that they have no counts above 1 keV, and therefore are very likely SSSs. The brightest of these three sources (r2-12) is within the central region and has erg s-1. This source was also detected in the ROSAT surveys and identified as a SSS (Su01).
We searched our catalog for other candidate SSSs, following a method analogous to that of Su97 and Kahabka (1999). These surveys identified 15 SSSs (Su97) or perhaps 16 additional SSSs (Kuhabka 1999), depending upon the selection criteria used. Candidate Chandra SSSs are those with HR2+ and HR1 , or HR1+. There are 14 sources satisfying these conditions: r1-25, r2-12, r2-19, r2-42, r2-46, r2-56, r2-57, r3-5, r3-8, r3-63, r3-69, r3-77, r3-84, and r3-96. A single one of these (r1-25) is in the central region. Source r2-12 was noted as a bright SSS in both the Einstein and PSPC surveys. Source r3-8 was not classified as a SSS in the PSPC surveys (Su97, Su01) but was subsequently identified as a SSS based on the less tight selection criteria of Kahabka (1999). Sources r3-63 and r3-69 were both detected in the PSPC survey and were identified to be SNRs (see Table 4). Source r2-42, r2-46 and r2-19 may be associated with stars listed in the Ha94 catalog. Removing these stars and the two SNRs from consideration, we are left with 9 SSS candidates, 7 of which are newly discovered.
In the CD and HID, we have marked the three regions of M31 we have defined in different colors: the central (region 1) is blue, the central excluding the central (region 2) is red, and the entire field excluding the central (region 3) is green. All three regions show extensive overlap in both diagrams, with one clear exception: the top right hand corner of the CD is populated mainly with sources from region 3. The appearance of this figure is born out by the average hardness ratios for the three regions as listed in Table 6. Both HR1 and HR2 of region 3 are significantly () higher than the values for regions 1 and 2, which are themselves consistent at the level. Although these sources may be intrinsically hard and within M31, many are probably strongly absorbed background AGN.
These harder sources may form a distinct group in the CD, i.e., there may be a separate clump of sources with HR1 and HR2 . There are 48 sources that meet these hardness ratio criteria, 42 of them are in region 3. Based on the Chandra deep field observations (Brandt et al. 2001), we estimate that there should be serendipitous sources in our field. Thus, the majority of these will be background AGN and would therefore be strongly absorbed by the dust and gas in M31.
3.5 Temporal Variability
The eight Chandra ACIS-I observations described herein span nearly 2 years from 1999–2001. This is substantially longer than previous surveys by ROSAT (2 observations separated by year). In order to study long-term X-ray variability, we computed a variability parameter following PFJ93:
| (1) |
where and are the minimum and maximum X-ray flux during the 2 years of observations, and and are the corresponding errors. We define a source to be a variable if . The 100 sources we found to be variable using this criteria are indicated with a “v” in Table 2. We note that 6 of the sources are excluded from this analysis as they were only observed once. Thus, the variable sources represent % of the total. The minimum amount of variability found corresponds to a factor of 1.5.
We note that the fraction of variable sources depends upon the region of M31 considered. In the central region, 73% of the sources are variable, while this fraction drops to 58% and 39% in regions 2 and 3, respectively (see Table 7 and Figure 5). One might worry that this apparent trend is an artifact of the variation in PSF and/or diffuse background with off axis angle. The average number of background counts per source in regions 1 and 2 is , while in region 3 the average is 12. These background counts could mask small variations in source flux. In order to determine the effect of the variable PSF, we used MARX 555http://space.mit.edu/ASC/MARX/ to simulate this effect. The maximum and minimum intensity images of the 24 variable sources found in region 1 were re-projected to random positions within region 3. The observed background (with Poisson noise) was included. We then re-computed S for these sources, and find that the average change from the original numbers is . This indicates that the measurement of variability is robust.
If a source is faint, the fractional error of its flux will be larger than that of brighter sources. Therefore, a larger fractional change in flux is required to satisfy . If the fractional change in flux is independent of the source luminosity, Eqn. 1 will be biased against finding faint sources with . Given that regions 2 and 3 have a larger proportion of faint sources than region 1, part of the apparent deficit in variable sources in regions 2 and 3 may be to this bias. This possible bias against faint sources can be removed by simply excluding faint sources from consideration. Figure 5 shows the fraction of X-ray variables in each of the regions, computed for three progressively higher low luminosity cutoffs (the first being the detection limit). Limiting ourselves to sources with , we see that that the fraction of variables in region 3 is still lower than that in regions 1 and 2, but that region 2 now has the highest fraction of variables. At the highest cutoff that still gives a reasonable number of sources ( ), region 3 still has a smaller fraction of variables than region 2. Given that the luminosity distribution is similar in these two regions (see § 4 for details) the smaller fraction of variables in region 3 appears to be an intrinsic property of these sources.
Previous observations may be consistent with this apparent trend. For example, by comparing ROSAT observations to Einstein observations made 10 years earlier, PFJ93 found that % of the X-ray sources in the central region were variable. By comparing two XMM-Newton observations separated by six months Osborne et al. (2001) found that % of the sources in the central were variable.
We have also discovered 12 bright transients which are indicated with a “t” in Table 2. We define a bright transient as follows: i) the source has and ii) the source is found in at least one observation with a luminosity of erg s-1 and is not detected (ie, the counts at the source location are below the detection threshold) in at least one other observation. Note that the luminosity limit covers typical outburst luminosities of soft X-ray transients and Be/X-ray binaries in our Galaxy.
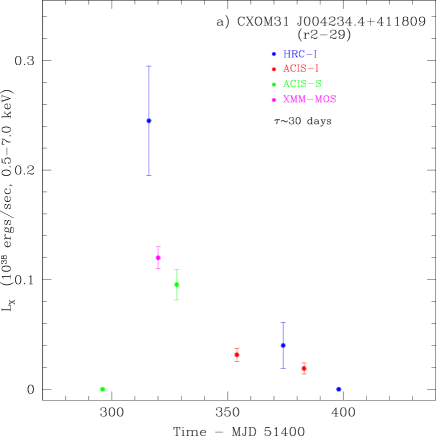
One important transient was missed by this analysis because it had a peak luminosity below our “bright transient” threshold during the eight ACIS-I observations considered here. This object is XMMU J004234.1+411808 (= CXOM31 J004234.4+411809 = r2-29), which Osborne et al. (2001) and Trudolyubov, Borozdin, & Priedhorsky (2001) suggest is an X-ray nova. Observations with the HRC-I (OBSIDs 273, 275, and 276), the ACIS-S (OBSIDs 309 and 310) and XMM-Newton (Osborne et al. 2001) allow us to reconstruct the lightcurve (Figure 6a), showing that this object had a peak erg s-1 and an exponential decay with a day e-folding time. This source increases the number of bright transients discovered in the last two years within the central region of M31 to 13.
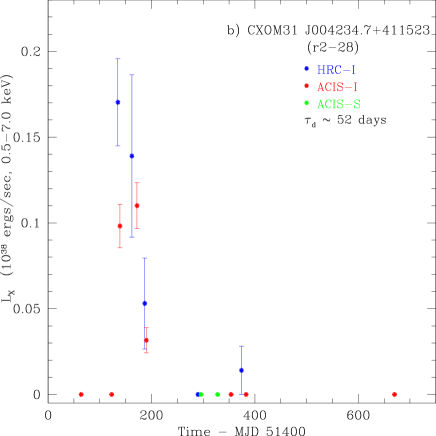
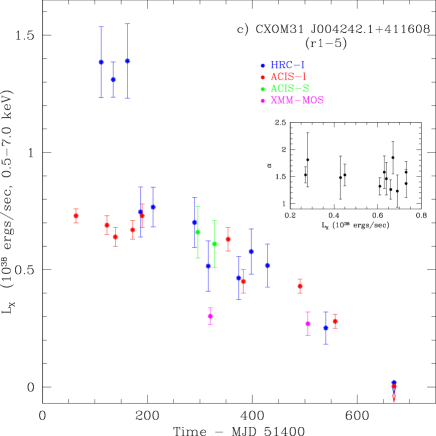
Two of these transients show typical lightcurves with a fast rise followed by an exponential decay (r2-29 and r2-28; see Figure 6a,b) like those seen in our Galaxy (Chen, Shrader & Livio 1997). A different sort of behavior is shown by the transient discovered with Chandra in the first observation (r1-5; Garcia et al. 2000a), which remained in outburst for more than one year and finally turned off in 2001 June (Figure 6c). We note that Figure 6 includes data from the HRC-I and ACIS-S which we do not analyze herein beyond measuring counting rates and luminosities for these few sources. The temporal variability of the 13 transients and other sources will be described on a future paper which will fully utilize the HRC and ACIS data (Kong et al., in preparation).
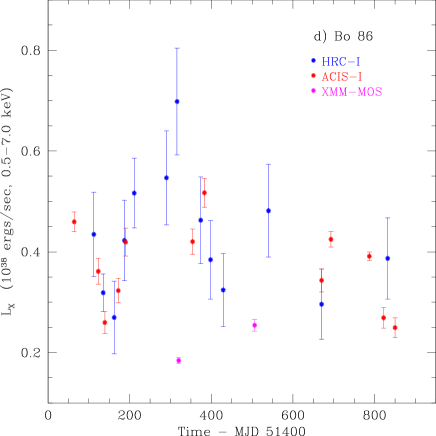
One source, while not a bright transient, deserves special mention because of it’s unusual long-term variability. Source r3-44 (Figure 6d) is in the M31 globular cluster Bo86 and shows a possible day modulation. This is reminiscent of the Galactic source 4U 1820–30 in the globular cluster NGC 6624, which has a 176-d long-term modulation (e.g. Bloser et al. 2000).
3.6 X-ray Spectra and Spectral Variability
We extracted the energy spectra of the brightest 20 sources from the first observation (OBSID 303) and fit them to simple one-component models consisting of absorbed power-law, blackbody and Raymond-Smith (RS) shapes. In this paper we limit ourselves to the spectra as seen in this longest single observation (8.8 ks) because of the complications involved in fitting the spectrum of a source which appears at different detector positions and is observed at differing ACIS temperatures (i.e., with differing detector response matrices). These brightest 20 sources all have detected counts, and are well distributed across the field. They range from within of the nucleus to over distant. Circular extraction regions centered on the source positions were applied and correspond to 90% encircled energy. In order to employ statistics to be used, all spectra were grouped into at least 20 counts per spectral bin.
All the sources were satisfactorily fit with simple absorbed power-law or RS models. Blackbody models gave very poor fits () in most cases, except for sources r3-42, r3-52 and r3-61. Table 8 lists the best fitting parameters determined by the power-law and RS fits to these 20 sources. The power-law photon indices of the 20 sources range from 1 to 3 with a mean of 1.8. The average and minimum RS temperatures (kT keV and kT keV, respectively) are both higher than that of coronal sources (Dempsey et al. 1993), indicating that none of these 20 sources is likely associated with a foreground star.
Source r2-26 was the only one of these twenty with a single-pixel counting rate high enough so that “pile-up” could cause an erroneously hard spectral fit. A fit to all the data for this source finds a rather hard spectrum of . In order to mitigate the effects of pileup we also extracted the spectrum in an annulus around the heavily piled-up core, and find a softer spectrum of (see Table 8). This slope is in good agreement with a fit to all the data using a model which attempts to correct for the effects of pileup (Davis 2001). In addition, a high S/N spectrum obtained from an archival XMM-Newton /PN data (taken on 2000 June 25) also shows similar results, confirming that the correct spectrum of r2-26 is very typical among M31 X-ray sources.
The column density for these 20 sources ranges from effectively zero to cm-2 and has an average value of cm-2. The Galactic absorption along the line of sight to M31 is cm-2 (Dickey & Lockman 1990), indicating that most of these bright sources have some additional local absorption. Figure 7 shows the spectra of the softest () and the hardest () of these sources.
We searched for spectral variability in all of the sources using a method analogous to that described in §3.5, but replacing in equation (1) with HR2. If this newly defined is greater than , the source is identified as a spectral variable and noted as “sv” in Table 2.
Only 12 sources are found to meet our criteria for spectral variability, corresponding to 6% of the total population. This is of course a lower limit, as small changes in the spectra of weak sources are undetectable with the number of counts accumulated in our 40 ks of merged data.
In order to further investigate the nature of the spectral variations, we fit simple spectra to two of the brighter spectral variables. The fits show that as the counting rate increases, the spectrum becomes harder (see Figure 8). This is reminiscent of atoll and Z sources in our Galaxy (see e.g. Hasinger & van dar Klis 1989). The luminosity of these two sources ranges from erg s-1, which is higher than the typical luminosity of atoll sources ( erg s-1). However, this luminosity is similar to that of the Z sources, which are believed to reach the Eddington limit (Psaltis, Lamb, & Miller 1995). The luminosity and spectral changes appear consistent with that seen in Z sources as they move along the “normal branch”. We suggest that these sources are among the first examples of possible extra-galactic Z-sources found (along with LMC X-2, Smale & Kuulkers 2000). Continued monitoring may confirm the nature of these sources by revealing the full Z-shape of the spectral variations observed for galactic Z sources.
4 Luminosity Function
The count rates for sources were converted into unabsorbed 0.3–7.0 keV luminosities by assuming an absorbed power-law model with cm-2 and . This is a median spectrum, as can be seen from Figure 3. The resulting conversion between count rate and luminosity is erg count-1. Luminosities using this conversion are listed in Table 2. The derived luminosities are not very sensitive to the assumed spectral parameters, for example varying from cm-2 and from 1.2 to 2.0 results in a % change in the conversion factor. An upper limit to the error in this conversion factor might be that found by using the thermal bremsstrahlung model of PFJ93, which gives luminosity differences up to 50%. For the brightest 20 X-ray sources, we derived the 0.3–7.0 keV luminosity directly from spectral fits (see §3.6).
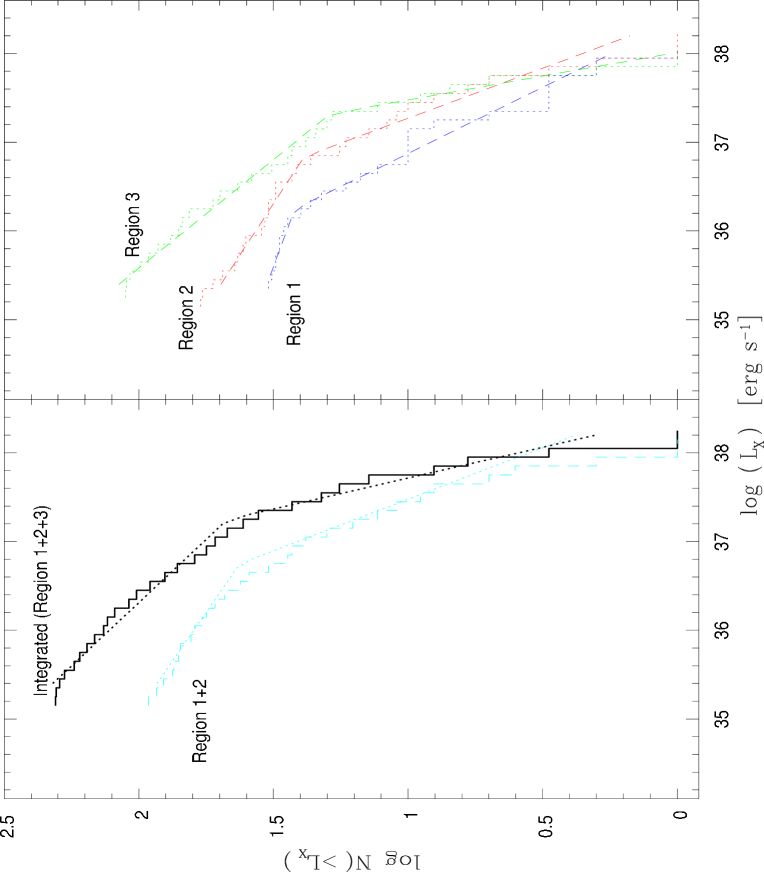
In Figure 8 we plot the cumulative luminosity function (CLF) for all detected sources in the stacked image, and also plot separately the CLFs of the inner bulge (region 1), outer bulge (region 2), disk (region 3), and bulge (regions 1+2 combined). Histograms of the number of sources detected against S/N peak at S/N and fall off below this. Clearly we are incomplete below this level, and therefore limit our measurements of the LFs to sources with S/N. We fitted a broken power-law model to the CLFs using maximum likelihood techniques (Cash 1979) and found the slopes listed in Table 9. The CLF for all sources has a break at , with before the break and after the break. This result is in good agreement with previous ROSAT (PFJ93) and XMM-Newton (Shirey et al. 2001) measurements of the CLF.
The CLF for the inner bulge is significantly different, with a break at a lower luminosity ( ) and a significantly flatter distribution at the faint end. We performed a two-sample Kolmogorov-Smirnov (K-S) test for the luminosity functions of regions 1 and 3 and found that there is only a 3% probability that they are drawn from the same distribution.
In order to test if the flattening of the CLF of the inner bulge is due to incompleteness, we performed simulations using MARX. We assumed that the luminosity function of the sources in the inner bulge is a single power-law that matches the best-fit function above the break () and extends to the faint end, and we generated sources at random positions and luminosities which conformed to this distribution. The diffuse emission (and background) were modeled by taking out all the detected sources, smoothing with a Gaussian and adding Poisson noise. The sources in the simulated observation were detected using the identical method used previously. Detected source counts were converted to luminosity using the same conversion factor. We found that the luminosity function did not show flattening below . A K-S test indicates that the simulated luminosity function is different from the actual one at a confidence level % level. It is therefore likely that the flattening below the break is intrinsic and not due to incompleteness.
We determined the slopes for the CLFs (above) via maximum likelihood fitting to these functions. However, the counts in a CLF are not independent and therefore this will underestimate the errors and may produce a biased best estimate of the slope. In order to more accurately estimate the errors and slopes, we used a maximum likelihood method (e.g. Crawford, Jauncey & Murdoch 1970) to determine the slopes in the differential luminosity functions (DLFs). The slopes determined by this method are shown in Table 9, where we have added one to the differential slopes in order to convert them into the equivalent cumulative slopes.
The slopes above the break seem insensitive to the analysis method. However at the faint end of the LF, below the apparent breaks, the two methods sometimes yield significantly different slopes. This is particularly true in the inner bulge region, where the DLF indicates a much smaller change in slope that we found by the CLF. While the appearance of the LFs (Figure 9) and the results of our MARX simulation (above) indicate the presence of a break to a flatter LF at the lowest fluxes, the DLF suggests that the statistics in the inner bulge region are insufficient to either confirm the presence or constrain the size of a break. However, there are sufficient counts in the full catalog and in the disk region alone to confirm the changes in slope using the DLF. It is worth noting that when fitting the DLFs with a broken power-law model, the luminosity breaks are roughly factor of 2 higher, which is consistent with the results found by Kaaret (2002).
The black holes and neutron stars that power many of the M31 X-ray sources have formed through the evolution of initially massive stars. Because of this, the X-ray LF traces the history of star formation and evolution of these massive stars in binary systems. Breaks in the LF may indicate an impulsive star formation event. As the X-ray binaries age, their average luminosity shifts to lower values and therefore the location of the break may be an indication of how long ago the star formation event occurred (Wu et al. 2002, Kilgard et al. 2002). Luminosity functions which do not show a break may indicate that star formation is still occurring. Chandra observations have measured the breaks in the LFs of several nearby galaxies, e.g. M81 (Tennant et al. 2001), NGC 1553 (Blanton, Sarazin, & Irwin 2001), NGC 4697 (Sarazin, Irwin, & Bregman 2001) and M83 (Soria & Wu 2002), and these breaks have been interpreted as evidence for impulsive star formation. Within M31, we find that the LF of three regions we studied has a break at a different luminosity. The inner bulge has this break at the lowest luminosity, and the luminosity of the break increases monotonically as we go out from the inner bulge. If the breaks do indicate the epochs of star formation events, then these events occurred most recently in the disk of M31 and further back in time as we move towards the nucleus of M31.
As well as the monotonic shift in the break luminosity, there is a monotonic shift in the slopes of the LFs. As we move in towards the nucleus these slopes become progressively flatter. This is somewhat difficult to understand in the context of the discussion above, because the most luminous sources would be expected to have the shortest lifetimes. Loss of these sources as they age would tend to steepen the luminosity function, but we find flatter luminosity functions in the apparently older populations.
It is interesting to compare the LF of these three regions of M31 to those of other galaxies. M31 is not the first galaxy found to show a break in its LF nor is it the first to show different LFs in different regions; both M81 (Tennant et al. 2001) and M83 (Soria & Wu 2002) show similar behavior. In cases where a single slope is fit to the LF (i.e., where there is no clear break) the LFs of early type galaxies and the bulges of spirals tend to be steeper () than those of spiral disks and galaxies with active star forming regions (, e.g., Prestwich 2001; Kilgard et al. 2002; Soria & Kong 2002). The opposite seems to be the case within M31: the disk has a steeper LF than the bulge region. We speculate that this difference may be related to the location of the breaks in the M31 LF, which are at a somewhat lower luminosity than those seen in other galaxies. At these lower luminosities we may be sampling a different class of source, and the steepness of the LF may be due to inclusion of this new class of faint sources rather than a loss of bright sources. We note that there is some evidence that we are sampling a different class of sources as we move out from the bulge because the fraction of sources which show variability appears lower in the disk region. If these sources have an intrinsically steeper LF than bright accreting binaries, then they may be responsible for the steepening of the LFs as we move from the bulge to the disk. One possibility is that these sources are background AGN. The presence of a class of highly cut-off sources in the disk region (Figure 3) supports this possibility. The extra-galactic LF has at the fluxes considered in this paper (see Rosati et al. 2002), so a larger contribution from background sources could explain some of the steepening we observe. A search for optical counterparts to these cut-off sources could test this possibility.
5 Summary
By using a stacked image (39.7 ks) of M31 from Chandra ACIS-I data taken between 1999 and 2001, we have detected 204 X-ray sources in the central region of M31, with luminosity above . Of these 204 sources, we identified 22 globular clusters, 2 supernova remnants, 9 planetary nebula, 9 SSSs and 1 background object. We suggest that an additional 4 source are normal stars based on both their positional coincidence and soft spectra, and another sources may be background AGN based on deep field observations and their hard (possibly absorbed) spectra. We do not detect any OB associations or stellar nova.
We find 10 positional matches with M31 planetary nebula, but expect that of these may be random coincidences. The X-ray luminosity of these sources is an astounding 5 to 7 orders of magnitude higher than planetary nebula in our Galaxy. We suggest that these may not be planetary nebula at all, but analogs to GX 1+4 (i.e., symbiotic stars with a neutron star primary). Optical spectroscopy of these sources could confirm or refute this suggestion.
About 50% of all the detected sources are variable on time scales of months. We also found 13 transients, corresponding to % of the total population. These transients show a variety of lightcurves, including the classical “FRED” (fast rise and exponential decay) with an e-folding decay time of days, an outburst lasting year, and a possible periodicity of days in one case. The first of these behaviors is analogous to X-ray nova in our Galaxy, the last reminiscent of the Galactic globular cluster source 4U 1820-30.
The median energy spectrum of point sources can be represented by a single power-law with a photon index of . There are 9 sources with hardness ratios indicative of SSSs. The spectra of 12 sources are shown to be variable. The spectral variations and luminosity of the brightest of these sources is reminiscent of Galactic Z sources on the normal branch.
The luminosity function of all the X-ray point sources is consistent with the findings of ROSAT and XMM-Newton observations (PFJ93, Su97 and Shirey et al. 2001), with a break at above which the function steepens. We also found that the luminosity functions of three separate regions (roughly corresponding to the inner bulge, outer bulge and disk) are different. In particular, the inner bulge shows a break near and it shifts monotonically to higher luminosities when moving outward from the nucleus to the outer bulge and disk. In addition, the slopes become steeper, indicating that the star formation and evolution histories might be different for the bulge and disk sources. Hence, our Chandra observations reveal different star formation histories even within the central ( kpc) region of M31. Future Chandra and XMM-Newton observations along the disk will definitely improve our knowledge of the star formation history of the whole galaxy.
References
- (1)
- (2) Barmby, P. 2001, PhD thesis, Harvard Univ
- (3)
- (4) Battistini, P., Bonoli, F., Braccesi, A. Federici, L., Fusi Pecci F., Marano, B., & Borngen, F. 1987, A&AS, 67, 447
- (5)
- (6) Berghofer, T.W., Schmitt, J.H.M.M., Danner, R., & Cassinelli, J.P. 1997, A&A 322, 167
- (7)
- (8) Blanton, E.L., Sarazin, C.L., & Irwin, J.A. 2001, ApJ, 552, 106
- (9)
- (10) Bloser, P.F., Grindlay, J.E., Kaaret, P., Zhang, W., Smale, A.P., & Barret, D. 2000, ApJ, 542, 1000
- (11)
- (12) Brandt, W.N., et al. 2001, AJ, 122, 2810
- (13)
- (14) Braun, R., & Walterbos, R.A.M. 1993, A&AS, 98, 327
- (15)
- (16) Cash, W. 1979, ApJ, 228, 939
- (17)
- (18) Chen, W, Shrader, C.R., & Livio, M. 1997, ApJ, 491, 312
- (19)
- (20) Ciardullo, R., Jacoby, G.H., Ford, H.C., & Neill, J.D. 1989 ApJ 339, 53
- (21)
- (22) Crawford, D.F., Jauncey, D.L., & Murdoch, H.S. 1970, ApJ, 162, 405
- (23)
- (24) Davis, J.E. 2001, ApJ, 562, 575
- (25)
- (26) Dempsey, R.C., Linsky, J.L., Schmitt, J.H.M.M., & Fleming, T.A. 1993, ApJ, 413, 333
- (27)
- (28) Dickey, J.M., & Lockman, F.J. 1990, ARA&A, 28, 215
- (29)
- (30) Di Stefano, R., Kong, A.K.H., Garcia, M.R., Barmby, P., Greiner, J., Murray, S.S., & Primini, F.A. 2002, ApJ, 570, 618
- (31)
- (32) d’Odorico, S., Dopita, M.A., & Benvenuti, P. 1980, A&AS, 40, 67
- (33)
- (34) Donato, L., Garzia, S., Gonano, V., & Sostero, G. 2000 IAUC 7516
- (35)
- (36) Dosaj, A. , Garcia, M.R., Forman, W. Jones, C., Kong, A., DiStefano, R., Primini, F.A., & Murray, S.S. 2001 in Proceedings “The High Energy Universe in Sharp Focus”, in press, ASP, eds. S. Vrtilek, E.M. Schegel & L. Kuhi
- (37)
- (38) Fiaschi, M., Di Mille, F., & Cariolato, R. 2001 IAUC 7709
- (39)
- (40) Filippenko, A.V., Chornock, R.T., Coil, A.L., Leonard, D.C., & Li W.D. 2000 IAUC 7272
- (41)
- (42) Ford, H.C. & Jacoby, G. 1978 ApJ, 219, 437
- (43)
- (44) Freeman, P.E., Kashyap, V., Rosner, R., & Lamb, D.Q. 2002 ApJS, 138, 185
- (45)
- (46) Garcia, M.R., Murray, S.S., Primini, F.A., Forman, W.R., McClintock, J.E. & Jones, C. 2000a, ApJ, 537, L23
- (47)
- (48) Garcia, M.R., Murray, S.S., Primini, F.A., McClintock, J.E., & Callanan, P.J. 2000b, IAUC 7498
- (49)
- (50) Garcia, M.R., Murray, S.S., Primini, F.A., Forman, W.R., Jones, C., & McClintock, J.E. 2001a, in proceeding of IAU205, Galaxies at the Highest Angular Resolution (astro-ph/0012387)
- (51)
- (52) Garcia, M., Kong, A., Primini, F., McClintock, J., Murray, S., & Distefano, R. 2001b, ATel, 79
- (53)
- (54) Garcia, M.R, et al. 2002, in preparation
- (55)
- (56) Guerrero, M.A., Chu, Y.-H., Gruendl, R.A., Williams, R.M., & Kaler, J.B. 2001, ApJ, 553, L55
- (57)
- (58) Guerrero, M.A., Chu, Y.-H., & Gruendl, R.A. 2000, ApJS, 129, 295
- (59)
- (60) Johnson, R., Modjaz, M., & Li, W.D. 1999 IAUC 7236
- (61)
- (62) Haiman, Z., et al. 1994, A&A, 286, 725
- (63)
- (64) Harris, D.E., et al. 1993, ”The Einstein Observatory catalog of IPC X-ray sources. Volume 1E: Documentation”, NASA TM 108401, page 121
- (65)
- (66) Hasinger, G., & van der Klis, M. 1989, A&A, 225, 79
- (67)
- (68) Hornschemeier, A.E., et al. 2001, ApJ, 554, 742
- (69)
- (70) Kaaret, P. 2002, to be submitted to ApJ
- (71)
- (72) Kahabka, P. 1999, A&A, 344, 459
- (73)
- (74) Kastner, J.H., Vrtilek, S.D., Soker, N. 2001, ApJ, 550, L189
- (75)
- (76) Kilgard, R.E., Kaaret, P., Krauss M.I., Prestwich A.H., Raley, M.T., Zezas, A. 2002, ApJ, in press (astro-ph/0203190)
- (77)
- (78) Kong, A., Garcia, M., Murray, S., Primini, F., McClintock, J., & Di Stefano, R. 2001, ATel 76
- (79)
- (80) Kong, A.K.H., Garcia, M.R., Primini, F.A., Di Stefano, R., Murray, S.S. 2002, in the Proceedings of the Symposium “New Visions of the X-ray Universe in the XMM-Newton and Chandra Era”, 26-30 November 2001, ESTEC, The Netherlands (ESA SP-488). (astro-ph/0202065)
- (81)
- (82) Li, W.D. 2000, IAUC 7477
- (83)
- (84) Macri, L.M., et al. 2001, ApJ, 549, 721
- (85)
- (86) Magnier, E.A. 1993, PhD Thesis, Massachusetts Institute of Technology
- (87)
- (88) Magnier, E.A., Prins, S., van Paradijs, J., Lewin, W.H.G., Supper, R., Hasinger, G., Pietsch, W., & Truemper, J. 1995, A&AS, 114, 215
- (89)
- (90) Magnier, E.A., Battinelli, P., Lewin, W. H. G., Haiman, Z., van Paradijs, J., Hasinger, G., Pietsch, W., Supper, R., & Truemper, J. 1993 A&A, 278, 36
- (91)
- (92) Modjaz, M., & Li, W.D. 1999 IAUC 7218
- (93)
- (94) Morton, D.C., Andereck, C.D., & Bernard, D.A. 1977, ApJ, 212, 13
- (95)
- (96) Osborne, J.P., et al. 2001, A&A, 378, 800
- (97)
- (98) Prestwich, A.H. 2001, in Proceedings “The High Energy Universe in Sharp Focus”, in press, ASP, eds. S. Vrtilek, E.M. Schegel & L. Kuhi (astro-ph/0108523)
- (99)
- (100) Primini, F., Garcia, M., Murray, S., Forman, W., Jones, C., & McClintock, J. 2000, in proceedings 232 WE-Heraeus Seminar, 22-25 May 2000, Bad Honnef, Germany. Edited by Elly M. Berkhuijsen, Rainer Beck, and Rene A. M. Walterbos. Shaker, Aachen, p. 145-148
- (101)
- (102) Primini, F.A., Forman, W., & Jones, C. 1993, ApJ, 410, 615 (PFJ93)
- (103)
- (104) Psaltis, D., Lamb, F.K., & Miller, G. S. 1995, ApJ, 454, L137
- (105)
- (106) Rosati, P., et al. 2002 ApJ 556, 667
- (107)
- (108) Sarazin, C.L., Irwin, J.A., & Bregman, J.N. 2001, ApJ, 556, 533
- (109)
- (110) Shirey, R., et al. 2001, A&A, 365, L195
- (111)
- (112) Shirey, R. 2001 IAUC 7659
- (113)
- (114) Smale, A.P., & Kuulkers, E. 2000, ApJ, 528, 702
- (115)
- (116) Stagni, R., Buonomo, U., & di Mille, F. 1999, IAUC 7093
- (117)
- (118) Stanek, K.Z., & Garnavich, P.M. 1998, ApJ, 503, L131
- (119)
- (120) Soria, R., & Wu, K. 2002, A&A, 384, 99
- (121)
- (122) Soria, R., & Kong, A.K.H. 2002, ApJL, in press (astro-ph/0203345)
- (123)
- (124) Supper, R., Hasinger, G., Pietsch, W., Trumper, J., Jain, A., Magnier, E.A., Lewin, W.H.G., & van Paradijs, J 1997, A&A, 317, 328 (Su97)
- (125)
- (126) Supper, R., Hasinger, G., Lewin, W.H.G., Magnier, E.A., van Paradijs, J., Pietsch, W., Read, A.M., & Trumper, J. 2001. A&A, 373, 63 (Su01)
- (127)
- (128) Tennant, A.F., Wu, K., Ghosh, K.K., Kolodziejczak, J.J., & Swartz, D.A. 2001, ApJ, 549, L43
- (129)
- (130) Trinchieri, G., & Fabbiano, G. 1991, ApJ, 382, 82
- (131)
- (132) Trudolyubov, S.P., Borozdin, K.N., Priedhorsky, W.C. 2001 ApJ, 563, L119
- (133)
- (134) Wu, K., Tennant, A.F., Swartz, D.A., Ghosh, K.K., & Hunstead, R.W. 2001, ApJ, submitted
- (135)
| Date | Obs ID | Exposure time (s) |
|---|---|---|
| Oct 13 1999 | 303 | 8830 |
| Dec 11 1999 | 305 | 4129 |
| Dec 27 1999 | 306 | 4132 |
| Jan 29 2000 | 307 | 4113 |
| Feb 16 2000 | 308 | 4012 |
| Jul 29 2000 | 311 | 4894 |
| Aug 27 2000 | 312 | 4666 |
| Jun 10 2001 | 1583 | 4903 |
| ID | IAU Name | R.A. | Dec. | Positional | Net | Count Rate | HR1 aaHR1 = (M–S)/(M+S) | HR2 bbHR2 = (H–S)/(H+S) | ccLuminosity in 0.3–7 keV (erg s-1), assuiming an absorbed power-law model with a photon index of 1.7 and cm-2. | Notes |
|---|---|---|---|---|---|---|---|---|---|---|
| (CXOM31) | (h:m:s) | (∘:′:′′) | Error (′′) | Counts | ( s-1) | () | ||||
| r3-110 | J004150.3+411337 | 00:41:50.336 | +41:13:37.16 | 1.7 | 91 | 0.17 | ||||
| r3-109 | J004150.5+412114 | 00:41:50.514 | +41:21:14.66 | 1.8 | 93 | 0.18 | ||||
| r3-81 | J004151.5+411438 | 00:41:51.582 | +41:14:38.29 | 1.1 | 164 | 0.31 | v | |||
| r3-108 | J004155.0+412303 | 00:41:55.010 | +41:23:03.49 | 1.3 | 148 | 0.28 | ||||
| r3-62 | J004204.0+411531 | 00:42:04.083 | +41:15:31.97 | 0.6 | 81 | 0.15 | ||||
| r3-107 | J004204.4+410930 | 00:42:04.435 | +41:09:30.63 | 1.7 | 75 | 0.14 | ||||
| r3-80 | J004205.7+411133 | 00:42:05.710 | +41:11:33.87 | 1.1 | 45 | 0.08 | ||||
| r3-79 | J004207.0+411719 | 00:42:07.097 | +41:17:19.17 | 0.6 | 44 | 0.08 | ||||
| r3-94 | J004207.5+411025 | 00:42:07.500 | +41:10:25.63 | 1.0 | 71 | 0.13 | v | |||
| r3-61 | J004207.6+411815 | 00:42:07.697 | +41:18:15.17 | 0.1 | 1611 | 3.02 | r,v | |||
| r3-93 | J004208.2+411250 | 00:42:08.278 | +41:12:50.92 | 1.0 | 32 | 0.06 | ||||
| r3-60 | J004209.0+412048 | 00:42:09.030 | +41:20:48.42 | 0.3 | 435 | 0.82 | ||||
| r3-59 | J004209.4+411745 | 00:42:09.450 | +41:17:45.63 | 0.2 | 443 | 0.83 | g,r,v | |||
| r3-102 | J004209.6+412008 | 00:42:09.692 | +41:20:08.89 | 1.0 | 19 | 0.04 | ||||
| r3-58 | J004210.2+411509 | 00:42:10.242 | +41:15:09.90 | 0.3 | 148 | 0.28 | r | |||
| r3-57 | J004210.9+411248 | 00:42:10.917 | +41:12:48.05 | 0.4 | 123 | 0.23 | ||||
| r3-78 | J004211.0+410646 | 00:42:11.032 | +41:06:46.95 | 1.3 | 213 | 0.40 | v | |||
| r3-56 | J004211.7+411048 | 00:42:11.711 | +41:10:48.70 | 0.4 | 295 | 0.55 | r | |||
| r3-55 | J004211.9+411648 | 00:42:11.944 | +41:16:48.49 | 0.3 | 154 | 0.29 | v | |||
| r3-54 | J004212.1+411758 | 00:42:12.104 | +41:17:58.86 | 0.1 | 538 | 1.01 | g,r,v | |||
| r3-92 | J004212.7+411244 | 00:42:12.748 | +41:12:44.79 | 1.0 | 20 | 0.04 | ||||
| r3-53 | J004213.0+411628 | 00:42:13.022 | +41:16:28.18 | 0.6 | 30 | 0.06 | v | |||
| r3-52 | J004213.0+411836 | 00:42:13.095 | +41:18:36.73 | 0.1 | 2805 | 5.27 | r,v | |||
| r3-77 | J004214.2+412105 | 00:42:14.273 | +41:21:05.82 | 0.7 | 13 | 0.02 | v | |||
| r3-51 | J004215.0+412122 | 00:42:15.029 | +41:21:22.04 | 0.6 | 15 | 0.03 | ||||
| r3-50 | J004215.0+411234 | 00:42:15.089 | +41:12:34.23 | 0.1 | 1017 | 1.91 | r,v,sv | |||
| r3-49 | J004215.2+411802 | 00:42:15.216 | +41:18:02.25 | 0.5 | 81 | 0.15 | ||||
| r3-48 | J004215.4+412032 | 00:42:15.428 | +41:20:32.27 | 0.3 | 205 | 0.39 | r | |||
| r3-47 | J004215.6+411721 | 00:42:15.649 | +41:17:21.11 | 0.1 | 783 | 1.47 | r,v | |||
| r3-106 | J004215.7+412216 | 00:42:15.772 | +41:22:16.18 | 1.4 | 21 | 0.04 | v | |||
| r3-76 | J004216.0+411552 | 00:42:16.066 | +41:15:52.91 | 0.6 | 16 | 0.03 | v | |||
| r3-75 | J004216.5+411610 | 00:42:16.540 | +41:16:10.55 | 0.7 | 15 | 0.03 | ||||
| r3-91 | J004216.8+411856 | 00:42:16.886 | +41:18:56.89 | 1.0 | 17 | 0.03 | ||||
| r3-46 | J004216.9+411508 | 00:42:16.997 | +41:15:08.54 | 0.3 | 114 | 0.21 | v,t | |||
| r3-45 | J004218.3+411223 | 00:42:18.319 | +41:12:23.53 | 0.1 | 2011 | 3.78 | r,v | |||
| r3-44 | J004218.6+411401 | 00:42:18.612 | +41:14:01.69 | 0.1 | 2428 | 4.56 | g,r,v,sv | |||
| r3-90 | J004218.9+412004 | 00:42:18.937 | +41:20:04.38 | 0.7 | 17 | 0.03 | ||||
| r3-74 | J004219.6+412154 | 00:42:19.657 | +41:21:54.07 | 0.7 | 38 | 0.07 | g | |||
| r3-89 | J004220.3+411313 | 00:42:20.313 | +41:13:13.98 | 0.8 | 15 | 0.03 | ||||
| r3-101 | J004220.3+410824 | 00:42:20.368 | +41:08:24.78 | 1.4 | 34 | 0.06 | ||||
| r3-43 | J004221.0+411808 | 00:42:21.075 | +41:18:08.55 | 0.3 | 88 | 0.17 | v,t | |||
| r3-42 | J004221.4+411601 | 00:42:21.460 | +41:16:01.32 | 0.1 | 1447 | 2.72 | r,v | |||
| r3-41 | J004221.5+411419 | 00:42:21.513 | +41:14:19.54 | 0.2 | 155 | 0.29 | v | |||
| r3-40 | J004222.3+411333 | 00:42:22.394 | +41:13:33.99 | 0.1 | 986 | 1.85 | r,v | |||
| r3-88 | J004222.6+412234 | 00:42:22.619 | +41:22:34.92 | 0.9 | 31 | 0.06 | ||||
| r3-39 | J004222.9+411535 | 00:42:22.919 | +41:15:35.14 | 0.04 | 2959 | 5.56 | r,v | |||
| r3-73 | J004222.9+410738 | 00:42:22.958 | +41:07:38.21 | 0.8 | 129 | 0.24 | ||||
| r3-38 | J004223.1+411407 | 00:42:23.152 | +41:14:07.49 | 0.1 | 699 | 1.31 | r,v | |||
| r2-57 | J004224.1+411733 | 00:42:24.157 | +41:17:33.58 | 0.4 | 16 | 0.03 | ||||
| r2-52 | J004224.1+411535 | 00:42:24.187 | +41:15:35.84 | 0.3 | 27 | 0.05 | v | |||
| r2-45 | J004225.1+411340 | 00:42:25.112 | +41:13:40.40 | 0.1 | 207 | 0.39 | r | |||
| r2-36 | J004226.0+411915 | 00:42:26.019 | +41:19:15.27 | 0.1 | 494 | 0.93 | g,r,v | |||
| r3-87 | J004226.1+412552 | 00:42:26.152 | +41:25:52.74 | 1.0 | 431 | 0.81 | r | |||
| r3-37 | J004227.6+412048 | 00:42:27.619 | +41:20:48.69 | 0.7 | 25 | 0.05 | ||||
| r3-36 | J004228.1+410959 | 00:42:28.167 | +41:09:59.84 | 0.1 | 1170 | 2.20 | v | |||
| r2-35 | J004228.2+411222 | 00:42:28.268 | +41:12:22.76 | 0.04 | 2865 | 5.38 | r,v,sv | |||
| r3-111 | J004228.8+410434 | 00:42:28.867 | +41:04:34.98 | 1.0 | 1783 | 3.35 | r | |||
| r2-44 | J004230.2+411653 | 00:42:30.244 | +41:16:53.41 | 0.2 | 15 | 0.03 | ||||
| r2-43 | J004230.9+411910 | 00:42:30.943 | +41:19:10.32 | 0.2 | 32 | 0.06 | ||||
| r2-34 | J004231.1+411621 | 00:42:31.123 | +41:16:21.74 | 0.02 | 2409 | 4.52 | r,v,sv | |||
| r2-33 | J004231.2+411939 | 00:42:31.232 | +41:19:39.19 | 0.1 | 608 | 1.14 | g,r,v | |||
| r2-51 | J004231.2+412008 | 00:42:31.271 | +41:20:08.30 | 0.3 | 25 | 0.05 | ||||
| r3-86 | J004231.9+412306 | 00:42:31.976 | +41:23:06.19 | 1.0 | 27 | 0.05 | ||||
| r2-32 | J004232.0+411314 | 00:42:32.057 | +41:13:14.24 | 0.04 | 1487 | 2.79 | r,sv | |||
| r2-55 | J004232.5+411545 | 00:42:32.515 | +41:15:45.62 | 0.3 | 12 | 0.02 | ||||
| r2-31 | J004232.7+411310 | 00:42:32.726 | +41:13:10.77 | 0.1 | 306 | 0.57 | v | |||
| r2-30 | J004233.8+411619 | 00:42:33.884 | +41:16:19.88 | 0.05 | 362 | 0.68 | r,v | |||
| r3-35 | J004234.1+412150 | 00:42:34.147 | +41:21:50.23 | 0.3 | 134 | 0.25 | ||||
| r2-29 | J004234.4+411809 | 00:42:34.439 | +41:18:09.60 | 0.1 | 39 | 0.07 | v,t | |||
| r2-28 | J004234.7+411523 | 00:42:34.771 | +41:15:23.32 | 0.1 | 165 | 0.31 | v,t | |||
| r2-27 | J004235.1+412006 | 00:42:35.199 | +41:20:06.09 | 0.1 | 385 | 0.72 | r,v | |||
| r2-42 | J004236.5+411350 | 00:42:36.592 | +41:13:50.20 | 0.2 | 39 | 0.07 | f | |||
| r3-100 | J004237.9+410526 | 00:42:37.940 | +41:05:26.07 | 1.8 | 69 | 0.13 | ||||
| r2-26 | J004238.5+411603 | 00:42:38.581 | +41:16:03.80 | 0.01 | 7749 | 14.55 | r,v,sv | |||
| r2-54 | J004238.7+411526 | 00:42:38.770 | +41:15:26.44 | 0.3 | 12 | 0.02 | ||||
| r2-25 | J004239.5+411428 | 00:42:39.529 | +41:14:28.52 | 0.1 | 287 | 0.54 | r,v | |||
| r1-15 | J004239.9+411547 | 00:42:39.986 | +41:15:47.68 | 0.02 | 1100 | 2.07 | p,r,v,sv | |||
| r2-24 | J004240.1+411845 | 00:42:40.199 | +41:18:45.38 | 0.1 | 316 | 0.59 | v | |||
| r2-23 | J004240.5+411355 | 00:42:40.524 | +41:13:55.33 | 0.1 | 18 | 0.03 | v | |||
| r2-22 | J004240.6+411327 | 00:42:40.644 | +41:13:27.30 | 0.04 | 716 | 1.34 | r,v | |||
| r3-34 | J004240.6+411032 | 00:42:40.688 | +41:10:32.32 | 0.5 | 74 | 0.14 | g,v | |||
| r3-33 | J004240.9+412216 | 00:42:40.912 | +41:22:16.58 | 0.7 | 22 | 0.04 | f | |||
| r3-85 | J004241.0+410701 | 00:42:41.016 | +41:07:01.24 | 1.1 | 31 | 0.06 | ||||
| r3-32 | J004241.0+411101 | 00:42:41.061 | +41:11:01.72 | 0.7 | 10 | 0.02 | ||||
| r1-32 | J004241.4+411523 | 00:42:41.433 | +41:15:23.94 | 0.1 | 130 | 0.25 | g,v | |||
| r3-31 | J004241.6+412106 | 00:42:41.644 | +41:21:06.02 | 0.3 | 142 | 0.27 | v | |||
| r1-31 | J004242.0+411532 | 00:42:42.076 | +41:15:32.18 | 0.1 | 90 | 0.17 | v | |||
| r1-5 | J004242.1+411608 | 00:42:42.160 | +41:16:08.42 | 0.01 | 2779 | 5.22 | v,t | |||
| r2-53 | J004242.1+411914 | 00:42:42.171 | +41:19:14.20 | 0.4 | 8 | 0.02 | ||||
| r2-21 | J004242.3+411445 | 00:42:42.327 | +41:14:45.54 | 0.05 | 545 | 1.02 | r,v | |||
| r1-14 | J004242.4+411553 | 00:42:42.464 | +41:15:53.82 | 0.02 | 772 | 1.45 | p,r,v | |||
| r1-30 | J004242.5+411659 | 00:42:42.515 | +41:16:59.59 | 0.1 | 70 | 0.13 | r | |||
| r2-20 | J004242.7+411455 | 00:42:42.710 | +41:14:55.63 | 0.1 | 41 | 0.08 | v | |||
| r1-13 | J004242.9+411543 | 00:42:42.985 | +41:15:43.26 | 0.03 | 600 | 1.13 | r | |||
| r3-99 | J004243.0+410830 | 00:42:43.050 | +41:08:30.48 | 1.1 | 24 | 0.04 | ||||
| r1-24 | J004243.1+411640 | 00:42:43.192 | +41:16:40.31 | 0.1 | 55 | 0.10 | p,v | |||
| r2-19 | J004243.3+411319 | 00:42:43.303 | +41:13:19.48 | 0.1 | 166 | 0.31 | f | |||
| r1-12 | J004243.7+411632 | 00:42:43.739 | +41:16:32.60 | 0.02 | 620 | 1.16 | r,v | |||
| r1-28 | J004243.7+411514 | 00:42:43.793 | +41:15:14.54 | 0.1 | 16 | 0.03 | v | |||
| r1-29 | J004243.7+411629 | 00:42:43.796 | +41:16:29.39 | 0.1 | 72 | 0.14 | r | |||
| r1-27 | J004243.8+411611 | 00:42:43.848 | +41:16:11.37 | 0.1 | 39 | 0.07 | v | |||
| r1-23 | J004243.8+411604 | 00:42:43.856 | +41:16:04.05 | 0.04 | 174 | 0.33 | v,t | |||
| r1-11 | J004243.8+411629 | 00:42:43.883 | +41:16:29.97 | 0.03 | 273 | 0.51 | r,v,t | |||
| r1-33 | J004244.0+411604 | 00:42:44.079 | +41:16:04.23 | 0.1 | 13 | 0.02 | v | |||
| r1-22 | J004244.2+411614 | 00:42:44.283 | +41:16:14.25 | 0.1 | 71 | 0.13 | r | |||
| r1-10 | J004244.3+411608 | 00:42:44.351 | +41:16:08.90 | 0.03 | 287 | 0.54 | r,v | |||
| r1-21 | J004244.3+411605 | 00:42:44.355 | +41:16:05.56 | 0.04 | 197 | 0.37 | p,r,v | |||
| r1-9 | J004244.3+411607 | 00:42:44.365 | +41:16:07.65 | 0.03 | 286 | 0.54 | r,v,t | |||
| r3-30 | J004244.4+411157 | 00:42:44.404 | +41:11:57.90 | 0.2 | 209 | 0.39 | v | |||
| r1-8 | J004244.6+411618 | 00:42:44.667 | +41:16:18.28 | 0.04 | 234 | 0.44 | r | |||
| r3-29 | J004244.8+411137 | 00:42:44.844 | +41:11:37.76 | 0.1 | 1306 | 2.45 | r,v | |||
| r2-18 | J004244.8+411739 | 00:42:44.895 | +41:17:39.82 | 0.1 | 185 | 0.35 | ||||
| r1-26 | J004245.0+411523 | 00:42:45.073 | +41:15:23.30 | 0.1 | 111 | 0.21 | p | |||
| r2-17 | J004245.0+411407 | 00:42:45.092 | +41:14:07.13 | 0.1 | 106 | 0.18 | r | |||
| r1-4 | J004245.1+411621 | 00:42:45.109 | +41:16:21.90 | 0.02 | 908 | 1.70 | r,v | |||
| r2-16 | J004245.2+411722 | 00:42:45.219 | +41:17:22.49 | 0.1 | 308 | 0.58 | v,t | |||
| r1-20 | J004245.2+411611 | 00:42:45.226 | +41:16:11.31 | 0.1 | 125 | 0.24 | v | |||
| r1-7 | J004245.5+411608 | 00:42:45.586 | +41:16:08.79 | 0.04 | 164 | 0.31 | v | |||
| r3-72 | J004245.7+412434 | 00:42:45.751 | +41:24:34.46 | 0.8 | 50 | 0.09 | ||||
| r1-19 | J004245.9+411619 | 00:42:45.996 | +41:16:19.77 | 0.1 | 105 | 0.20 | v,t | |||
| r2-15 | J004246.0+411736 | 00:42:46.067 | +41:17:36.35 | 0.1 | 48 | 0.09 | g,v | |||
| r1-18 | J004246.1+411543 | 00:42:46.144 | +41:15:43.37 | 0.1 | 88 | 0.17 | r | |||
| r3-28 | J004246.9+412119 | 00:42:46.912 | +41:21:19.65 | 0.3 | 79 | 0.15 | ||||
| r1-3 | J004246.9+411615 | 00:42:46.963 | +41:16:15.76 | 0.02 | 934 | 1.75 | r,v | |||
| r1-2 | J004247.1+411628 | 00:42:47.167 | +41:16:28.65 | 0.01 | 2600 | 4.88 | p,r,v,sv | |||
| r3-27 | J004247.2+411157 | 00:42:47.232 | +41:11:57.75 | 0.3 | 84 | 0.16 | v | |||
| r3-26 | J004247.8+411052 | 00:42:47.863 | +41:10:52.42 | 0.5 | 23 | 0.04 | ||||
| r1-17 | J004247.8+411623 | 00:42:47.865 | +41:16:23.19 | 0.05 | 138 | 0.26 | v | |||
| r1-25 | J004247.8+411549 | 00:42:47.888 | +41:15:49.85 | 0.1 | 26 | 0.05 | ||||
| r1-6 | J004247.8+411533 | 00:42:47.891 | +41:15:33.04 | 0.02 | 1002 | 1.88 | r | |||
| r3-25 | J004248.5+412523 | 00:42:48.501 | +41:25:23.10 | 0.3 | 574 | 1.08 | r,v | |||
| r1-1 | J004248.5+411521 | 00:42:48.528 | +41:15:21.31 | 0.01 | 3360 | 6.31 | r,v,sv | |||
| r1-16 | J004248.7+411624 | 00:42:48.715 | +41:16:24.64 | 0.05 | 144 | 0.27 | v | |||
| r3-84 | J004248.9+412406 | 00:42:48.970 | +41:24:06.87 | 0.8 | 59 | 0.11 | v | |||
| r2-41 | J004249.1+411742 | 00:42:49.141 | +41:17:42.25 | 0.2 | 15 | 0.03 | ||||
| r2-14 | J004249.2+411816 | 00:42:49.233 | +41:18:16.26 | 0.1 | 322 | 0.60 | r,v | |||
| r3-98 | J004249.3+410635 | 00:42:49.389 | +41:06:35.69 | 1.1 | 37 | 0.07 | ||||
| r3-24 | J004249.9+411108 | 00:42:49.991 | +41:11:08.64 | 0.5 | 38 | 0.07 | ||||
| r2-40 | J004250.2+411813 | 00:42:50.228 | +41:18:13.11 | 0.3 | 11 | 0.02 | ||||
| r2-56 | J004250.4+411556 | 00:42:50.476 | +41:15:56.15 | 0.3 | 12 | 0.02 | p | |||
| r3-71 | J004250.7+411033 | 00:42:50.732 | +41:10:33.58 | 0.7 | 28 | 0.05 | g | |||
| r3-70 | J004251.5+412633 | 00:42:51.539 | +41:26:33.58 | 1.0 | 80 | 0.51 | ||||
| r2-39 | J004251.6+411302 | 00:42:51.633 | +41:13:02.65 | 0.2 | 46 | 0.09 | ||||
| r2-50 | J004252.2+411735 | 00:42:52.281 | +41:17:35.02 | 0.2 | 22 | 0.04 | ||||
| r2-49 | J004252.5+411835 | 00:42:52.526 | +41:18:35.24 | 0.3 | 12 | 0.02 | ||||
| r2-12 | J004252.5+411540 | 00:42:52.528 | +41:15:40.20 | 0.03 | 918 | 1.72 | r,v | |||
| r2-13 | J004252.5+411854 | 00:42:52.528 | +41:18:54.75 | 0.02 | 3943 | 7.40 | r,v | |||
| r2-38 | J004252.6+411328 | 00:42:52.621 | +41:13:28.72 | 0.2 | 13 | 0.02 | ||||
| r3-69 | J004253.6+412553 | 00:42:53.656 | +41:25:53.56 | 0.7 | 188 | 0.35 | r,s | |||
| r2-11 | J004254.9+411603 | 00:42:54.937 | +41:16:03.46 | 0.02 | 3282 | 6.16 | r,v,sv | |||
| r2-10 | J004255.1+411836 | 00:42:55.186 | +41:18:36.33 | 0.1 | 179 | 0.34 | r,v | |||
| r3-23 | J004255.3+412556 | 00:42:55.394 | +41:25:56.60 | 0.3 | 1011 | 1.90 | r,v | |||
| r2-9 | J004255.6+411835 | 00:42:55.628 | +41:18:35.44 | 0.1 | 108 | 0.20 | g,r,v | |||
| r2-8 | J004256.9+411844 | 00:42:56.914 | +41:18:44.37 | 0.1 | 286 | 0.54 | v,t | |||
| r3-22 | J004257.9+411104 | 00:42:57.932 | +41:11:04.59 | 0.1 | 1646 | 3.09 | r | |||
| r2-7 | J004258.3+411529 | 00:42:58.335 | +41:15:29.46 | 0.1 | 487 | 0.91 | r,v | |||
| r2-59 | J004258.6+411200 | 00:42:58.621 | +41:12:00.14 | 0.6 | 15 | 0.03 | ||||
| r2-58 | J004259.0+411158 | 00:42:59.093 | +41:11:58.75 | 0.6 | 14 | 0.03 | ||||
| r3-97 | J004259.1+412613 | 00:42:59.160 | +41:26:13.76 | 1.2 | 130 | 0.24 | ||||
| r2-48 | J004259.5+411242 | 00:42:59.558 | +41:12:42.26 | 0.3 | 41 | 0.08 | ||||
| r2-6 | J004259.6+411919 | 00:42:59.672 | +41:19:19.72 | 0.04 | 1678 | 3.15 | g,r,v,sv | |||
| r2-5 | J004259.8+411606 | 00:42:59.881 | +41:16:06.01 | 0.03 | 1356 | 2.55 | g,r,v | |||
| r2-37 | J004301.1+411351 | 00:43:01.119 | +41:13:51.69 | 0.2 | 65 | 0.12 | r | |||
| r2-47 | J004301.7+411814 | 00:43:01.716 | +41:18:14.98 | 0.2 | 15 | 0.03 | v | |||
| r3-96 | J004301.7+411052 | 00:43:01.754 | +41:10:52.63 | 0.8 | 15 | 0.03 | ||||
| r2-46 | J004301.8+411726 | 00:43:01.821 | +41:17:26.78 | 0.3 | 12 | 0.02 | f | |||
| r3-68 | J004302.4+411203 | 00:43:02.421 | +41:12:03.71 | 0.9 | 17 | 0.03 | ||||
| r2-4 | J004302.9+411522 | 00:43:02.955 | +41:15:22.82 | 0.04 | 1430 | 2.69 | g,r,v | |||
| r3-21 | J004303.0+412042 | 00:43:03.036 | +41:20:42.54 | 0.3 | 84 | 0.16 | p | |||
| r3-20 | J004303.1+411015 | 00:43:03.167 | +41:10:15.18 | 0.2 | 284 | 0.53 | r | |||
| r2-3 | J004303.2+411528 | 00:43:03.241 | +41:15:28.00 | 0.04 | 1249 | 2.35 | r,v,t | |||
| r3-19 | J004303.3+412122 | 00:43:03.309 | +41:21:22.42 | 0.1 | 632 | 1.19 | g,r,v | |||
| r2-2 | J004303.8+411805 | 00:43:03.890 | +41:18:05.23 | 0.05 | 1174 | 2.21 | g,r,v,sv | |||
| r2-1 | J004304.2+411601 | 00:43:04.264 | +41:16:01.62 | 0.1 | 249 | 0.47 | v | |||
| r3-83 | J004306.6+412243 | 00:43:06.696 | +41:22:43.82 | 0.9 | 27 | 0.05 | e | |||
| r3-67 | J004306.8+411912 | 00:43:06.801 | +41:19:12.26 | 0.6 | 32 | 0.06 | ||||
| r3-18 | J004307.5+412020 | 00:43:07.550 | +41:20:20.09 | 0.2 | 195 | 0.37 | g,v | |||
| r3-95 | J004307.8+412418 | 00:43:07.816 | +41:24:18.16 | 1.2 | 33 | 0.06 | ||||
| r3-17 | J004308.6+411248 | 00:43:08.687 | +41:12:48.30 | 0.2 | 320 | 0.60 | r | |||
| r3-16 | J004309.8+411901 | 00:43:09.869 | +41:19:01.22 | 0.2 | 396 | 0.74 | r,v,t | |||
| r3-15 | J004310.6+411451 | 00:43:10.665 | +41:14:51.55 | 0.04 | 4432 | 8.32 | g,r,v | |||
| r3-14 | J004311.3+411809 | 00:43:11.391 | +41:18:09.76 | 0.5 | 43 | 0.08 | ||||
| r3-13 | J004313.2+411813 | 00:43:13.250 | +41:18:13.96 | 0.3 | 103 | 0.19 | v | |||
| r3-12 | J004313.9+411712 | 00:43:13.986 | +41:17:12.19 | 0.8 | 22 | 0.04 | ||||
| r3-112 | J004314.3+410725 | 00:43:14.323 | +41:07:25.42 | 0.8 | 1051 | 1.97 | g,r | |||
| r3-11 | J004314.3+411651 | 00:43:14.344 | +41:16:51.31 | 0.6 | 42 | 0.08 | ||||
| r3-105 | J004314.5+412513 | 00:43:14.585 | +41:25:13.66 | 1.5 | 62 | 0.12 | g | |||
| r3-10 | J004315.4+411125 | 00:43:15.499 | +41:11:25.00 | 0.6 | 77 | 0.14 | g,r | |||
| r3-9 | J004316.1+411841 | 00:43:16.165 | +41:18:41.73 | 0.3 | 166 | 0.31 | v | |||
| r3-8 | J004318.8+412018 | 00:43:18.851 | +41:20:18.52 | 0.6 | 85 | 0.16 | v | |||
| r3-66 | J004320.9+411852 | 00:43:20.922 | +41:18:52.62 | 0.7 | 18 | 0.03 | ||||
| r3-7 | J004321.1+411751 | 00:43:21.136 | +41:17:51.19 | 0.4 | 194 | 0.37 | p,r,v | |||
| r3-104 | J004321.5+411558 | 00:43:21.510 | +41:15:58.34 | 1.0 | 19 | 0.04 | ||||
| r3-82 | J004322.2+411258 | 00:43:22.283 | +41:12:58.67 | 1.0 | 16 | 0.03 | ||||
| r3-65 | J004324.1+411314 | 00:43:24.148 | +41:13:14.34 | 0.9 | 28 | 0.05 | ||||
| r3-6 | J004324.9+411728 | 00:43:24.957 | +41:17:28.33 | 0.5 | 101 | 0.19 | ||||
| r3-5 | J004326.0+411935 | 00:43:26.026 | +41:19:35.88 | 0.4 | 34 | 0.06 | ||||
| r3-4 | J004326.3+411756 | 00:43:26.328 | +41:17:56.87 | 0.8 | 22 | 0.04 | ||||
| r3-64 | J004326.3+411910 | 00:43:26.376 | +41:19:10.82 | 1.0 | 82 | 0.15 | ||||
| r3-63 | J004327.8+411829 | 00:43:27.871 | +41:18:29.83 | 0.6 | 258 | 0.48 | r,s | |||
| r3-103 | J004329.1+410749 | 00:43:29.116 | +41:07:49.11 | 2.6 | 1387 | 2.60 | r | |||
| r3-3 | J004332.4+411041 | 00:43:32.460 | +41:10:41.66 | 0.4 | 1419 | 2.66 | ||||
| r3-2 | J004334.4+411323 | 00:43:34.410 | +41:13:23.72 | 0.4 | 994 | 1.87 | r,v | |||
| r3-1 | J004337.2+411443 | 00:43:37.269 | +41:14:43.07 | 0.4 | 2264 | 4.25 | g,v |
Note. — e: Extragalactic objects; f: Foreground stars; g: GC; p: PN; r: ROSAT HRI sources; s: SNR; v: Variables; sv: Spectral variables; t:transients
| Object | Catalogs | Searching | |||
|---|---|---|---|---|---|
| type | radius (′′) | ||||
| X-ray | ROSAT HRI (PFJ93) | 6 | 77 | 9.5 | 67 |
| GC | Ba87, Magnier (1993), and Barmby (2001) | 3 | 23 | 2.25 | 22 |
| SNR | DO80, BW83, and Ma95 | 10 | 2 | 1 | 2 |
| PN | Ford78, Ci89 | 3 | 11 | 5 | 9 |
| OB Assoc. | Magnier et al. 1993 | 3 | 0 | 0.25 | 0 |
| Nova | IAUC | 3 | 0 | 0.25 | 0 |
| Extragalactic | NED and SIMBAD | 3 | 1 | 1 | 1 |
| Stars | Ha94 and SIMBAD | 0.8 | 29 | 21.25 | 4 |
Note. — : Number of all possible matches; : Number of matches by accident; : likely number of true matches.
References. — Ba87: Battistini et al. 1987; DO80: d’Odorico, Dopita, & Benvenuti (1980); BW83: Braun & Walterbos (1993); Ma95: Magnier et al. (1995); Ford78: Ford & Jacoby (1978); Ci89: Ciardullo et al. (1989); Ha94: Haiman et al. (1994)
| ID | Chandra | Type | Identification | Radial |
|---|---|---|---|---|
| Name | Offset (′′) | |||
| r3-59 | CXOM31 J004209.4+411745 | GC | mita140 | 1.0 |
| r3-54 | CXOM31 J004212.1+411758 | GC | Bo78,mita153 | 2.1,0.9 |
| r3-44 | CXOM31 J004218.6+411401 | GC | Bo86,mit164 | 1.1,0.7 |
| r3-74 | CXOM31 J004219.6+412154 | GC | mita165,166 | 0.8,0.7 |
| r2-36 | CXOM31 J004226.0+411915 | GC | Bo96,mita174 | 1.6,1.2 |
| r2-33 | CXOM31 J004231.2+411939 | GC | Bo107,mita192 | 0.8,0.9 |
| r2-42 | CXOM31 J004236.5+411350 | Star | Ha94(238126) | 0.1 |
| r1-15 | CXOM31 J004239.9+411547 | PN | Ford17 | 2.9 |
| r3-34 | CXOM31 J004240.6+411032 | GC | Bo123,mita212 | 2.9,0.8 |
| r3-33 | CXOM31 J004240.9+412216 | Star | Ha94(278717) | 0.6 |
| r1-32 | CXOM31 J004241.4+411523 | GC | mita213 | 1.5 |
| r1-14 | CXOM31 J004242.4+411553 | PN | Ford4 | 2.9 |
| r1-24 | CXOM31 J004243.1+411640 | PN | Ford322 | 0.6 |
| r2-19 | CXOM31 J004243.3+411319 | Star | Ha94(235849) | 0.5 |
| r1-21 | CXOM31 J004244.3+411605 | PN | Ford316 | 2.9 |
| r1-33 | CXOM31 J004244.0+411604 | 1.6 | ||
| r1-26 | CXOM31 J004245.0+411523 | PN | Ford21 | 0.8 |
| r2-15 | CXOM31 J004246.0+411736 | GC | PB-in7 | 0.7 |
| r1-2 | CXOM31 J004247.1+411628 | PN | Ford13 | 1.0 |
| r2-56 | CXOM31 J004250.4+411556 | PN | Ford462 | 0.5 |
| r3-71 | CXOM31 J004250.7+411033 | GC | mita222,PB-in2 | 0.5,1.2 |
| r3-69 | CXOM31 J004253.6+412553 | SNR | DO80(13) | 6.0 |
| r2-9 | CXOM31 J004255.6+411835 | GC | Bo138 | 2.5 |
| r2-6 | CXOM31 J004259.6+411919 | GC | Bo143 | 1.7 |
| r2-5 | CXOM31 J004259.8+411606 | GC | Bo144 | 2.2 |
| r2-46 | CXOM31 J004301.8+411726 | Star | Ha94(261262) | 0.6 |
| r2-4 | CXOM31 J004302.9+411522 | GC | Bo146 | 1.9 |
| r3-21 | CXOM31 J004303.0+412042 | PN | Ford201 | 2.4 |
| r3-19 | CXOM31 J004303.3+412122 | GC | Bo147,mita240 | 2.5,1.3 |
| r2-2 | CXOM31 J004303.8+411805 | GC | Bo148 | 2.5 |
| r3-83 | CXOM31 J004306.6+412243 | EO | MLA93(686) | 0.9 |
| r3-18 | CXOM31 J004307.5+412020 | GC | Bo150,mita246 | 2.8,1.1 |
| r3-15 | CXOM31 J004310.6+411451 | GC | Bo153,mita251 | 1.9,0.4 |
| r3-112 | CXOM31 J004314.3+410725 | GC | Bo158 | 2.3 |
| r3-105 | CXOM31 J004314.5+412513 | GC | Bo159,mita258 | 1.4,0.9 |
| r3-10 | CXOM31 J004315.4+411125 | GC | mita260 | 0.9 |
| r3-7 | CXOM31 J004321.1+411751 | PN | Ford209 | 1.7 |
| r3-63 | CXOM31 J004327.8+411829 | SNR | DO80(15) | 5.1 |
| r3-1 | CXOM31 J004337.2+411443 | GC | mita299 | 0.6 |
Note. — Bo–Battistini et al. (1987); mita–Magnier (1993); Ford–Ford78, Ci89; PB–Barmby (2001); MLA–SIMBAD
| ID | Chandra Name | ROSAT HRI | Radial |
|---|---|---|---|
| Identification | Offset (′′) | ||
| r3-61 | CXOM31 J004207.6+411815 | PF93(4) | 0.5 |
| r3-59 | CXOM31 J004209.4+411745 | PF93(5) | 2.0 |
| r3-58 | CXOM31 J004210.2+411509 | PF93(6) | 1.6 |
| r3-56 | CXOM31 J004211.7+411048 | PF93(7) | 1.0 |
| r3-54 | CXOM31 J004212.1+411758 | PF93(8) | 2.1 |
| r3-52 | CXOM31 J004213.0+411836 | PF93(9) | 1.5 |
| r3-50 | CXOM31 J004215.0+411234 | PF93(10) | 2.9 |
| r3-48 | CXOM31 J004215.4+412032 | PF93(11) | 0.8 |
| r3-47 | CXOM31 J004215.6+411721 | PF93(12) | 1.5 |
| r3-45 | CXOM31 J004218.3+411223 | PF93(14) | 1.5 |
| r3-44 | CXOM31 J004218.6+411401 | PF93(15) | 1.2 |
| r3-42 | CXOM31 J004221.4+411601 | PF93(17) | 1.5 |
| r3-40 | CXOM31 J004222.3+411333 | PF93(18) | 1.5 |
| r3-39 | CXOM31 J004222.9+411535 | PF93(20) | 1.5 |
| r3-38 | CXOM31 J004223.1+411407 | PF93(21) | 1.7 |
| r2-45 | CXOM31 J004225.1+411340 | PF93(22) | 1.2 |
| r2-36 | CXOM31 J004226.0+411915 | PF93(23) | 1.6 |
| r3-87 | CXOM31 J004226.1+412552 | PF93(24) | 0.9 |
| r2-35 | CXOM31 J004228.2+411222 | PF93(25) | 2.4 |
| r3-111 | CXOM31 J004228.8+410434 | PF93(26) | 3.5 |
| r2-34 | CXOM31 J004231.1+411621 | PF93(27) | 1.5 |
| r2-33 | CXOM31 J004231.2+411939 | PF93(28) | 0.8 |
| r2-32 | CXOM31 J004232.0+411314 | PF93(29) | 1.6 |
| r2-30 | CXOM31 J004233.8+411619 | PF93(32) | 5.5 |
| r2-27 | CXOM31 J004235.1+412006 | PF93(34) | 1.0 |
| r2-26 | CXOM31 J004238.5+411603 | PF93(35) | 1.5 |
| r2-25 | CXOM31 J004239.5+411428 | PF93(36) | 1.8 |
| r1-15 | CXOM31 J004239.9+411547 | PF93(37) | 1.7 |
| r2-22 | CXOM31 J004240.6+411327 | PF93(38) | 1.5 |
| r2-21 | CXOM31 J004242.3+411445 | PF93(39) | 0.8 |
| r1-14 | CXOM31 J004242.4+411553 | PF93(41) | 2.1 |
| r1-30 | CXOM31 J004242.5+411659 | PF93(40) | 1.4 |
| r1-13 | CXOM31 J004242.9+411543 | PF93(42) | 2.0 |
| r1-12 | CXOM31 J004243.7+411632 | PF93(43) | 0.5 |
| r1-11 | CXOM31 J004243.8+411629 | 3.4 | |
| r1-29 | CXOM31 J004243.7+411629 | 3.7 | |
| r1-10 | CXOM31 J004244.3+411608 | PF93(44) | 1.0 |
| r1-9 | CXOM31 J004244.3+411607 | 1.9 | |
| r1-21 | CXOM31 J004244.3+411605 | 3.9 | |
| r1-22 | CXOM31 J004244.2+411614 | 5.1 | |
| r1-8 | CXOM31 J004244.6+411618 | PF93(47) | 1.2 |
| r1-4 | CXOM31 J004245.1+411621 | 5.1 | |
| r3-29 | CXOM31 J004244.8+411137 | PF93(45) | 1.7 |
| r2-17 | CXOM31 J004245.0+411407 | PF93(46) | 1.9 |
| r1-3 | CXOM31 J004246.9+411615 | 2.7 | |
| r1-18 | CXOM31 J004246.1+411543 | PF93(48) | 4.1 |
| r1-2 | CXOM31 J004247.1+411628 | PF93(50) | 1.7 |
| r1-6 | CXOM31 J004247.8+411533 | PF93(52) | 1.8 |
| r3-25 | CXOM31 J004248.5+412523 | PF93(53) | 2.6 |
| r1-1 | CXOM31 J004248.5+411521 | PF93(54) | 1.9 |
| r2-14 | CXOM31 J004249.2+411816 | PF93(55) | 1.0 |
| r2-12 | CXOM31 J004252.5+411540 | PF93(58) | 1.3 |
| r2-13 | CXOM31 J004252.5+411854 | PF93(57) | 1.2 |
| r3-69 | CXOM31 J004253.6+412553 | PF93(59) | 1.8 |
| r2-11 | CXOM31 J004254.9+411603 | PF93(60) | 1.8 |
| r3-23 | CXOM31 J004255.3+412556 | PF93(61) | 0.2 |
| r2-9 | CXOM31 J004255.6+411835 | PF93(62) | 2.5 |
| r2-10 | CXOM31 J004255.1+411836 | 4.3 | |
| r3-22 | CXOM31 J004257.9+411104 | PF93(64) | 3.2 |
| r2-7 | CXOM31 J004258.3+411529 | PF93(65) | 1.6 |
| r2-6 | CXOM31 J004259.6+411919 | PF93(66) | 1.6 |
| r2-5 | CXOM31 J004259.8+411606 | PF93(67) | 2.2 |
| r2-37 | CXOM31 J004301.1+411351 | PF93(68) | 2.7 |
| r2-4 | CXOM31 J004302.9+411522 | PF93(70) | 1.9 |
| r2-3 | CXOM31 J004303.2+411528 | 4.3 | |
| r3-20 | CXOM31 J004303.1+411015 | PF93(71) | 1.5 |
| r3-19 | CXOM31 J004303.3+412122 | PF93(72) | 2.5 |
| r2-2 | CXOM31 J004303.8+411805 | PF93(73) | 2.5 |
| r3-17 | CXOM31 J004308.6+411248 | PF93(74) | 3.7 |
| r3-16 | CXOM31 J004309.8+411901 | PF93(75) | 2.1 |
| r3-15 | CXOM31 J004310.6+411451 | PF93(76) | 1.9 |
| r3-112 | CXOM31 J004314.3+410725 | PF93(77) | 2.3 |
| r3-10 | CXOM31 J004315.4+411125 | PF93(78) | 3.9 |
| r3-7 | CXOM31 J004321.1+411751 | PF93(79) | 2.3 |
| r3-63 | CXOM31 J004327.8+411829 | PF93(80) | 1.7 |
| r3-103 | CXOM31 J004329.1+410749 | PF93(81) | 2.3 |
| r3-2 | CXOM31 J004334.4+411323 | PF93(82) | 5.6 |
| Region | HR1 | HR2 |
|---|---|---|
| Inner bulge | ||
| Outer bulge | ||
| Disk |
| Region | Detected | Number of | Fraction | Number of | Fraction | Number of | Fraction |
|---|---|---|---|---|---|---|---|
| sources | variables | spectral variables | transients | ||||
| Inner bulge | 33 | 24 | 73% | 3 | 9% | 5 | 15% |
| Outer bulge | 59 | 34 | 58% | 7 | 12% | 5 | 8.5% |
| Disk | 106 | 42 | 39% | 2 | 2% | 3 | 2.8% |
Note. — 6 sources are excluded in the disk region as they were in the field in only one observation; the actual total detected sources in this region is 112.
| Power-law | Raymond-Smith a | ||||||||
|---|---|---|---|---|---|---|---|---|---|
| Source | Flux b | Flux b | |||||||
| ID | ( cm-2) | ( cm-2) | (keV) | ||||||
| r1-1 | 0.8/36 | 1.38 | 0.8/36 | 1.32 | |||||
| r1-5 | 0.9/31 | 1.25 | 0.9/31 | 1.22 | |||||
| r2-3 | 1.2/31 | 0.49 | 1.5/13 | 0.37 | |||||
| r2-5 | 0.9/11 | 0.58 | 1.0/11 | 0.52 | |||||
| r2-6 | 0.7/12 | 0.45 | 0.9/12 | 0.44 | |||||
| r2-11 | 1.4/30 | 0.96 | 1.5/30 | 0.94 | |||||
| r2-13 | 1.0/33 | 1.31 | 1.0/33 | 1.29 | |||||
| r2-26 | 1.0/62 | 3.42 | 1.3/62 | 3.07 | |||||
| r2-26d | 0.8/22 | 3.07 | 0.8/22 | 3.00 | |||||
| r2-32 | 0.6/12 | 0.49 | 0.0 c | 0.7/12 | 0.48 | ||||
| r2-34 | 1.5/13 | 0.60 | 1.5/13 | 0.57 | |||||
| r2-35 | 1.0/22 | 0.89 | 1.0/22 | 0.88 | |||||
| r3-15 | 0.9/40 | 1.62 | 0.9/40 | 1.60 | |||||
| r3-16 | 1.0/12 | 0.50 | 1.1/12 | 0.46 | |||||
| r3-22 | 0.7/13 | 0.51 | 0.7/13 | 0.45 | |||||
| r3-39 | 0.7/18 | 0.80 | 0.8/18 | 0.76 | |||||
| r3-42 | 0.5/11 | 0.65 | 0.6/11 | 0.46 | |||||
| r3-44 | 1.2/23 | 0.90 | 1.1/23 | 0.87 | |||||
| r3-45 | 1.0/19 | 0.79 | 1.6/19 | 0.51 | |||||
| r3-52 | 0.8/26 | 2.05 | 1.1/26 | 1.05 | |||||
| r3-61 | 1.0/13 | 0.70 | 0.9/13 | 0.67 | |||||
Note. — All quoted uncertainties are 90% confidence.
| Region | Cumulative aaFixed at solar abundence | Differential bbUnabsorbed flux in 0.5–10 keV ( ) | ||||
|---|---|---|---|---|---|---|
| cc hit the minimum value of 0 allowed by XSPEC | ddPile-up corrected | Break | ccPower-law slope below the break | ddPower-law slope above the break | ||
| ( ) | ||||||
| Inner bulge | ||||||
| Outer bulge | ||||||
| Bulge | ||||||
| Disk | ||||||
| Integrated | ||||||
Note. — All quoted uncertainties are 90% confidence.