11email: wkollat@uni-sw.gwdg.de 22institutetext: Department of Astronomy and McDonald Observatory, University of Texas at Austin, Austin, TX 78712, USA
Geometry and Kinematics in the Central Broad-Line Region of a Seyfert 1 Galaxy
We recorded spectra of the highly variable Seyfert 1 galaxy Mrk 110 in a variability campaign with the 9.2m Hobby-Eberly Telescope at McDonald Observatory in order to study the detailed line profile variations of the broad emission lines. Here we show that only an AGN model predicting the formation of the broad H line emission in the wind of an accretion disk matches the observed 2-D variability pattern. Furthermore, we derive an improved mass of the central supermassive black hole of from the H velocity-delay map.
Key Words.:
Accretion disks – Line: profiles – Galaxies: Seyfert – Galaxies: individual: Mrk 110 – Galaxies: nuclei – (Galaxies:) quasars: emission lines1 Introduction
In the central regions of active galactic nuclei (AGN) broad emission lines are generated. These emission lines are emitted in a photoionized gas at distances of light days to light months from a central supermassive black hole. But many details of the innermost AGN region where the broad emission lines originate are unknown. We do not know the geometry of the line emitting clouds: are they distributed spherically, in a disk geometry, or biconically? Different kinematic models of the clouds are conceivable: radial inflow or outflow motions including accelerated outflow, turbulent/chaotic velocity fields, or (randomly oriented) Keplerian orbits.
The response of variable broad emission lines to continuum variations can provide information on size and geometry of the BLR in AGN. Especially the compilation of velocity-delay diagrams of variable emission line profiles is extremely valuable. But, very homogeneous data sets obtained with high S/N are needed for constructing such diagrams. The ionizing flux of the active galaxies to be analyzed should be highly variable. Furthermore, the spectra have to be acquired over periods of many months with sampling rates of the order of days. So far only preliminary results of velocity-delay maps of other galaxies exist because of insufficient S/N ratio of the data. Velocity-delay maps have been derived for the Balmer lines in NGC 5548 (Kollatschny & Dietrich kollatschny96 (1996)) and NGC 4593 (Kollatschny & Dietrich kollatschny97 (1997)) and for the CIV1550 line in NGC 5548 (Done & Krolik done96 (1996)) and NGC 4151 (Ulrich & Horne ulrich96 (1996)). The CIV1550 line is often hampered by very strong central absorption and blended with the HeII1640 line. Here we present velocity-delay maps of the H line in Mrk 110.
2 Observations and data analysis
We have chosen Mrk 110 as our first target of a thorough variability campaign with the 9.2m Hobby-Eberly Telescope (HET) at McDonald Observatory. From earlier campaigns we knew the extreme continuum and line intensity variations in this galaxy (Bischoff & Kollatschny bischoff99 (1999), Peterson et al. peterson98 (1998)). We took 26 spectra of this narrow-line Seyfert 1 galaxy between 1999 November 13 and 2000 May 14. All observations were made under identical conditions with exactly the same instrumentation at the HET. The spectra cover the wavelength range from 4200Å to 6900Å with a resolving power of 650 at 5000Å . We reduced the data in a homogeneous way with IRAF reduction packages. In most cases we yielded a S/N 100 per pixel in the continuum. Details of the campaign and reduction procedure are published in Kollatschny et al. (kollatschny01 (2001), hereafter Paper I).
3 Results and Discussion
3.1 Geometry and kinematics
In Paper I we verified an ionization stratification in the broad-line region of Mrk 110. The integrated emission line intensities showed different delays with respect to continuum variations. The cross-correlation of the integrated H light curve with the continuum light curve yielded a mean radius of 24.2 light days of the H emitting region.
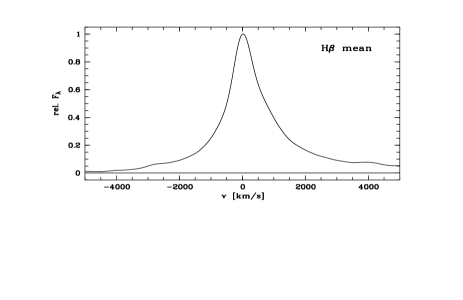
In this paper we discuss H line profile variations of our Mrk 110 variability campaign. The H line is the strongest undisturbed emission line in the spectra. Furthermore it is arranged close to our primary internal flux calibrator [OIII]5007. The redshifted H line is heavily contaminated by atmospheric absorption. The normalized mean H profile of our spectra is shown in Fig. 1 in velocity space.
We generated light curves from various H velocity segments ( = 200 km/s). Light curves of the optical continuum, of the H line center as well as blue and red H line wing segments are shown in Fig. 2.
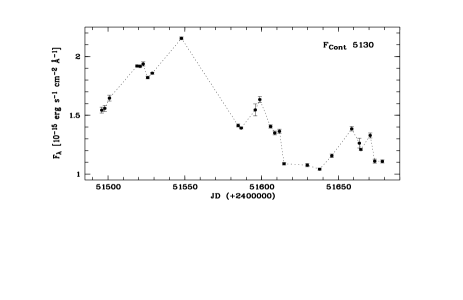
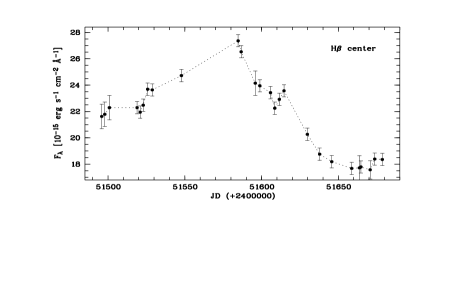
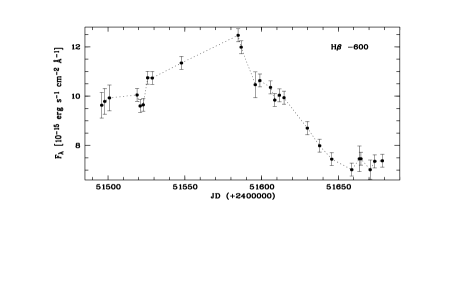
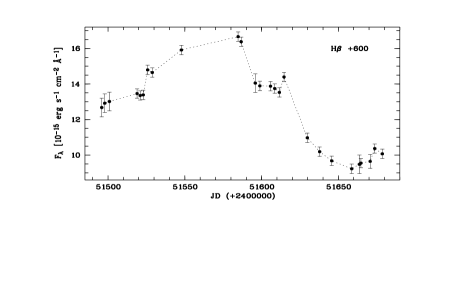
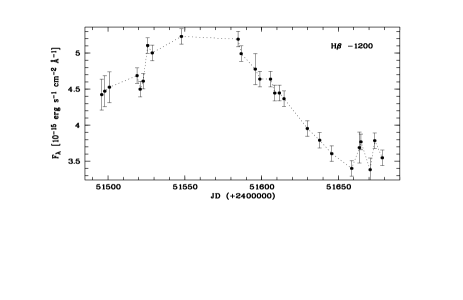
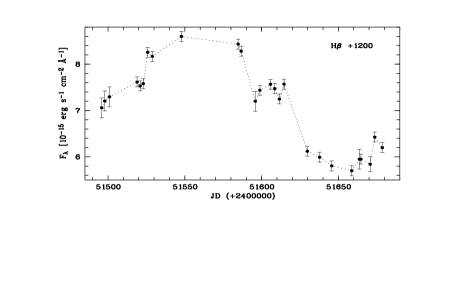
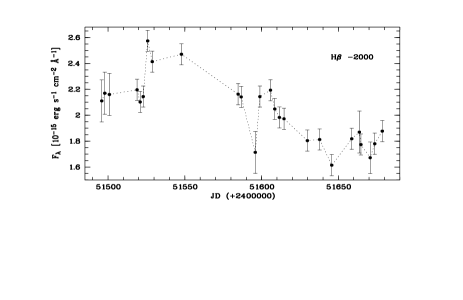

The light curves of individual line segments are noteworthy different. On the other hand light curves of the corresponding red and blue line segments differ less.
We computed cross-correlation functions (CCF) of all H line segment light curves with the 5100Å continuum light curve (for details see Paper I). The light curve of the central line segment shows the largest delay. The outer line wings segments respond much faster to continuum variations than the inner ones. We derived from the cross-correlation functions a delay map of all H line segments ( = 200 km/s) which is shown in Fig. 3 in gray scale. Contours of the correlation coefficient are overplotted.
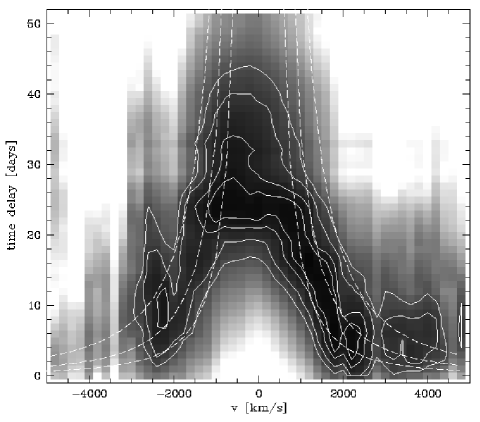
This 2-D CCF shows some clear trends. The outer red and blue H line wings respond almost symmetrically to continuum variations with a delay of about five days only. Towards the line center the delay is getting systematically longer until up to about 30 days at the line center. Tests made with different H velocity binning ( = 100 – 400 km/s) gave qualitatively the same results.
The 2-D CCF(,) is mathematically very similar to a 2-D response function (Welsh welsh01 (2001)). Comparing our observed velocity-delay pattern with model calculations (Perez et al. perez92 (1992); Welsh & Horne welsh91 (1991); O’Brien et al. obrien94 (1994)) we can cut down a lot of simple kinematical models of the BLR in Mrk 110. Both H line wings show the shortest delay with respect to the continuum and react nearly simultaneously. Therefore we can rule out radial inflow or outflow motions – including biconical outflow. Due to the fact that no short delays are observed at the center one can furthermore rule out spherical BLR models with chaotic virial velocity field or randomly oriented Keplerian orbits. On the other hand, a Keplerian disk BLR model fulfills exactly the observed velocity-delay pattern: the faster response of both line wings compared to the center. There are further pieces of evidence from theoretical considerations (Collin-Souffrin et al. collin88 (1988), Emmering et al. emmering92 (1992)) and from the observational side (Elvis elvis00 (2000), Vestergaard et al. vestergaard00 (2000), Hutchings et al. hutchings01 (2001)) for a disk-like configuration of the broad-line region.
The 2-D CCF pattern follows the computed orbital velocities (Fig. 3). This demonstrates that the line emitting gas is gravitationally bound which is required for calculating a central black hole mass in AGN.
A slightly faster and stronger response of the red line wing compared to the blue wing - as seen in Fig. 3 - is predicted in the disk-wind model of the BLR of Chiang & Murray (chiang96 (1996)). These authors computed in detail frequency-resolved response functions of broad emission lines from the surface of an accretion disk in the presence of a radiatively driven wind. Their accretion disk-wind model matches our observations of Mrk 110 regarding to the blue-red-asymmetry. The correlation of the red H wing with the continuum light curve is 5% stronger than that of the blue wing (Fig. 3). The blue H wing ( = [–2000,–500] km/s) lags the red wing ( = [+500,+2000] km/s) by days.
Furthermore, Murray & Chiang (murray97 (1997)) demonstrated that a Keplerian disk with disk wind can produce single-peaked broad emission lines as normally seen in most AGN.
3.2 SMBH mass
Black hole masses based on reverberation studies of integrated emission line intensity variations have been estimated for about three dozens active galaxies (Wandel et al. wandel99 (1999), Kaspi et al. kaspi00 (2000)) under the assumption that the emission line clouds are gravitationally bound. The mean distance of the line emitting clouds and their velocity dispersion derived from the mean width of the rms emission line profiles (FWHM) are needed for computing a central black hole mass (Koratkar & Gaskell koratkar91 (1991)):
We derived in Paper I the central black hole mass in Mrk 110 from the widths and delays of the integrated emission lines to M= . The velocity-delay map provides an improved method to determine the central mass; it is shown in Fig. 3 together with computed escape velocities for central masses of 0.5, 1.0, and 2.0 . The escape velocities have been calculated with the formula given above where is the CCF time delay and =c the corresponding distance. The observed delays of the resolved H line wings between 800 and 2000 km/s point to a central mass of in Mrk 110. This black hole mass determination derived from the H line profile matches that from the integrated line intensity variations within the error limits and is an independent confirmation.
But, one has to keep in mind that in both cases there are systematic uncertainties in the mass determination (Krolik krolik01 (2001)). Most important, if the inclination angle is unknown the derived mass is only a lower limit. The observed velocity-delay map does not drop down near the line center (Fig. 3) as expected from model calculations of edge-on disk models (Welsh & Horne welsh91 (1991); O’Brien et al. obrien94 (1994)). This is a hint for a small inclination angle of the disk in Mrk 110.
4 Summary and Outlook
We demonstrated that the formation of the broad H line emission in the wind of an accretion disk matches our observed 2-D variability pattern in Mrk 110. We expect the general picture will be confirmed in future variability campaigns on other galaxies that broad emission lines in AGN are formed in the wind of an accretion disk. Therefore, the difference between Seyfert 1 and Seyfert 2 galaxies might be connected with the existence of such an accretion disk wind only.
Acknowledgements.
WK thanks the UT Astronomy Department for warm hospitality during his visit and W.F. Welsh and R. Robinson for many discussions on this subject. Part of this work has been supported by the Deutsche Forschungsgemeinschaft, DFG grant KO 857/24 and DAAD.References
- (1) Bischoff, K., & Kollatschny, W. 1999, A&A, 345, 49
- (2) Chiang, J., & Murray, N. 1996, ApJ, 466, 704
- (3) Collin-Souffrin, S., Dyson, J.E., McDowell, J.C., & Perry J.J. 1988, MNRAS, 232, 539
- (4) Done, C., & Krolik, J.H. 1996, ApJ, 463, 144
- (5) Elvis, M. 2000, ApJ, 545, 63
- (6) Emmering, R.T., Blandford, R.D., & Shlosman, I. 1992, ApJ, 385, 460
- (7) Hutchings, J.B., Kriss, G.A., Green R.F. et al. 2001, ApJ, 559, 173
- (8) Kaspi, S., Smith, P.S., Netzer, H. et al. 2000, ApJ, 533, 631
- (9) Kollatschny, W., & Dietrich, M. 1996, A&A, 314, 43
- (10) Kollatschny, W., & Dietrich, M. 1997, A&A, 323, 5
- (11) Kollatschny, W., Bischoff, K., Robinson, E.L., Welsh, W.F., & Hill, G.J. 2001, A&A, 379, 125 (Paper I)
- (12) Koratkar, A., & Gaskell, M. 1991, ApJ, 370, L61
- (13) Krolik, J. H. 2001, ApJ, 551, 72
- (14) Murray, N., & Chiang, J. 1997, ApJ, 474, 91
- (15) O’Brien, P.T., Goad, M.R., & Gondhalekar, P.M., 1994, MNRAS, 268, 845
- (16) Perez, E., Robinson, A., & de la Fuente, L. 1992, MNRAS, 256, 103
- (17) Peterson, B.M., Wanders, I., Bertram, R., et al. 1998, ApJ, 501, 82
- (18) Ulrich, M.-H., & Horne, K. 1996, MNRAS, 283, 748
- (19) Vestergaard, M., Wilkes, B.J., & Barthel, P.D. 2000, ApJ, 538, L103
- (20) Wandel, A., Peterson, B.M., & Malkan, M.A. 1999, ApJ, 526, 579
- (21) Welsh, W.F., & Horne, K. 1991, ApJ, 379, 586
- (22) Welsh, W.F. 2001, in: Peterson et al. (eds.): Probing the Physics of AGN, ASP Conf.Ser. 224, p.123