On the X-ray source luminosity distributions in the bulge and disk of M31: First results from XMM-Newton survey.
Abstract
We present luminosity distributions for the X-ray sources detected with XMM-Newton in the bulge and disk of the Andromeda Galaxy (M31). The disk is clearly lacking the brighter sources which dominate X-ray emission from the bulge. This is the first convincing evidence for a difference between bulge and disk X-ray populations in M31. Our results are in good qualitative agreement with the luminosity distributions for low- and high-mass X-ray binaries recently obtained by Grimm et al.(2001) for our Galaxy. This confirms that X-ray population of the disk of M31 is dominated by fainter HMXB sources, while the bulge is populated with brighter LMXBs.
1. INTRODUCTION
Multiple observations of external galaxies starting with Einstein have shown convincingly that the X-ray emission of normal spirals similar to our own Milky Way is dominated by X-ray binaries (Fabbiano (1995)). An X-ray binary contains either a neutron star or a black hole; it can be classified as low-mass (LMXB) or high-mass (HMXB) according to the spectral type of the companion star. It is well known that in our Galaxy most HMXBs lie in the Galactic plane, while the LMXBs have more spherical distribution with conspicuous concentration towards the Galactic Center. LMXBs and HMXBs demonstrate very similar X-ray spectra in some of their states, therefore difficult to discriminate them in a single spectral observation. Recently Grimm, Gilfanov and Sunyaev (2001) demonstrated the difference between X-ray luminosity distributions of LMXBs and HMXBs in the Milky Way, providing a method for discriminating the two populations in other galaxies.
M31 (the Andromeda Galaxy) is of special importance for extragalactic astronomy because, at a distance of 760 kpc (van der Bergh 2000), it is the closest spiral galaxy to our own. M31 is believed in many respects to be similar to the Milky Way. By observing M31 we can sample hundreds of X-ray sources at a nearly uniform distance and less obscured by interstellar gas and dust than those in the Galaxy due to the favorable orientation of the M31. It is therefore quite interesting to look at the luminosity distributions for various populations of X-ray sources in M31 and compare them with our Galaxy. However, earlier attempts to find the difference between luminosity distributions of X-ray sources in the bulge and disk of M31 were unsuccessful (Trinchieri & Fabbiano (1991)).
In this Letter we report on the difference between the disk and bulge X-ray source populations of M31, as observed with XMM-Newton in the course of the most sensitive X-ray survey of a neighboring galaxy to date.
2. OBSERVATIONS AND DATA ANALYSIS
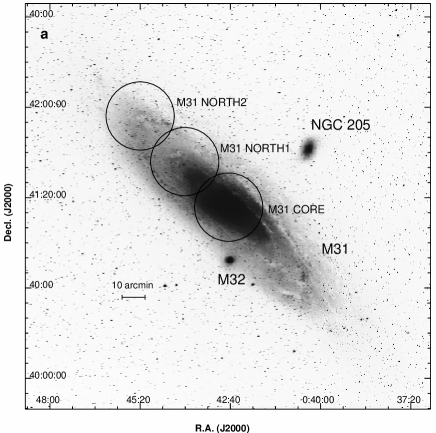
In the following analysis we use data from three XMM-Newton observations of the bulge and galactic disk of M31 (see Table 1, Fig. 1a). The first observation of the central part of M31 (M31 Core; ) was performed on June 25, 2000 Shirey et al. (2001); Osborne et al. (2001). Two regions of the northern part of the galactic disk () were observed with XMM-Newton on January 5 Trudolyubov et al. 2002a (M31 North1 Field) and January 26, 2002 (M31 North2 Field) as a part of the Guaranteed Time Program (PI: K.O. Mason)(Fig. 1). We use data from three European Photon Imaging Camera (EPIC) instruments: two EPIC MOS detectors (Turner et al. (2001)) and the EPIC PN detector (Strueder et al. (2001)). In all observations the EPIC instruments were operated in the full window mode ( diameter FOV) with the medium optical blocking filter.
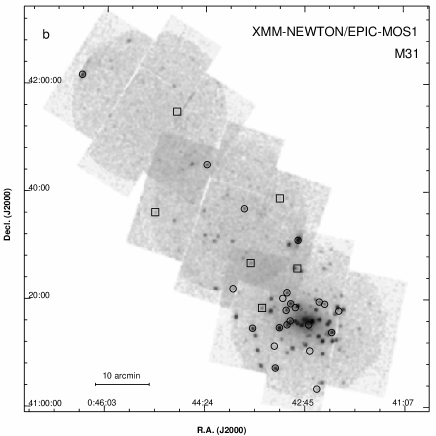
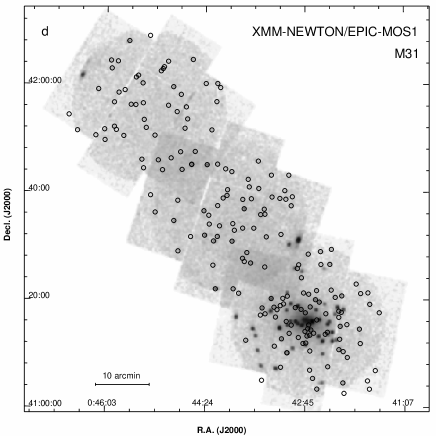
We reduced EPIC data with the XMM-Newton Science Analysis System (SAS v 5.2)111See http://xmm.vilspa.esa.es/user. Images in celestial coordinates with a pixel size of 2 have been accumulated in the keV energy band from both MOS and PN detectors. The resulting images for the EPIC-MOS1 instrument are shown in Figure 1b,c,d. Sources were detected with a program based on the wavelet decomposition algorithm, set at detection threshold. We expect errors in the source position determination to be dominated by residual systematic errors of order .
We detected 230 point X-ray sources above a level of significance. We cross-identified the detected X-ray objects with catalogs of globular cluster candidates and supernova remnants (Battistini et al. (1987); Barmby & Huchra (2001); Blair et al. (1981); Magnier et al. (1995)), based on a positional coincidence of (Fig. 1b). Four sources were identified with foreground objects and excluded from the analysis. Due to source confusion in the central part of the galaxy sources located within the central were also excluded.
To estimate energy fluxes and spectra, we used an extraction radius of (depending on the distance of the source from the telescope axis) and subtracted as background the spectrum of adjacent source-free regions. We corrected the count rates for the vignetting of the XMM telescope, based on the Current Calibration Files provided with SAS. The EPIC count rates were converted into energy fluxes using analytical fits to the spectra of brighter sources. Detailed spectral analysis for individual sources will be presented elsewhere. For faint sources we estimated energy fluxes with Web-PIMMS 222See heasarc.gsfc.nasa.gov/Tools/w3pimms.html assuming an absorbed simple power law spectral shape with photon index and an equivalent absorbing column of cm-2 (Galactic value for the direction to M31).
3. RESULTS AND DISCUSSION
Altogether we detected 230 X-ray sources in the three fields of M31: 118 sources in the Core and 112 in the North1 and North2 fields. These include unidentified background and foreground sources, as discussed below. The properties of the individual sources are presented elsewhere (Shirey et al. (2001); Osborne et al. (2001); Trudolyubov et al. 2002b ). Here we discuss the source populations and their luminosity distributions. We have noticed that the brightest X-ray sources are concentrated towards the center of M31, while the fainter ones are distributed much more uniformly (Fig. 1c,d). Furthermore, we have mentioned that all remaining bright sources in North1 and North2 fields can be identified with globular clusters (Fig.1b). Our data prove, for the first time, that M31 resembles our Galaxy in the distribution of its X-ray source populations (i.e. LMXBs and HMXB) (see Fig.1 in (Grimm et al. (2001))).
3.1. Luminosity distributions of X-ray sources
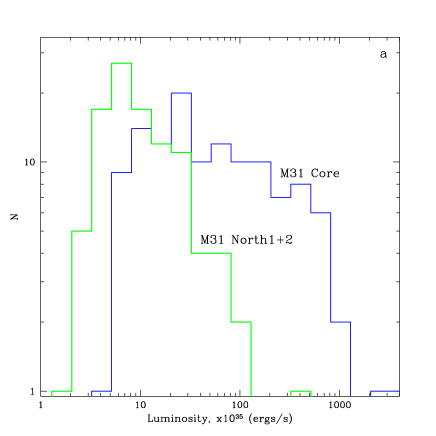
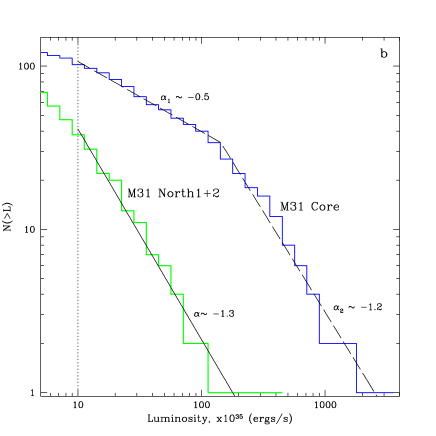
We have built differential and cumulative luminosity distributions of the detected X-ray sources for the central part of M31, and the combined North1 and North2 fields assuming a distance of 760 kpc (Fig. 2). In order to minimize the contribution from non-disk X-ray population, the sources identified with globular clusters were excluded from the North1/North2 sample. Taking into account the sensitivity as a function of off-axis distance, the different exposure times, and the effect of diffuse X-ray emission (in the M31 Core field), we estimate a flux completeness limit of our sample as ergs s-1 (indicated by the dotted line in Fig. 2b).
Some of the objects in the M31 fields must be background and foreground sources lying outside M31 (i.e. background AGN, and Galactic K and M stars). Based on Chandra and XMM-Newton deep field results Giacconi et al. (2001); Hasinger et al. (2001), one might expect to detect background AGN in each field with an apparent luminosity around ergs s-1. The total number of unidentified foreground Galactic stars could be sources per field Shirey et al. (2001). Correction for such background/foreground objects would flatten the faint end of the cumulative luminosity distribution (below ergs s-1), but would not significantly modify the higher luminosity part of the distribution.
As it is clearly seen from both panels of Fig. 2, the population of the northern disk regions of M31 is dominated by relatively faint objects with luminosities below ergs s-1. The overall shape of the cumulative luminosity distribution (Fig. 2b) can be presented with a simple power law function with an index of 333We fitted unbinned cumulative luminosity distributions using a maximum likelihood method. for luminosities above ergs s-1. There is some indication for a flattening of the distribution at lower luminosities (Fig. 2b), which can be attributed to the incompleteness of our sample at the faint end.
In contrast to the northern disk regions, bright X-ray sources contribute significantly to the population in the central region of M31 (Fig. 2a). The shape of both cumulative and differential luminosity distributions for the central region of M31 (Blue histograms in Fig. 2) indicate the presence of a brake at around ergs s-1. We fit the unbinned cumulative distribution with a broken power law (Fig. 2b). For source luminosities between and ergs s-1, we obtain a power law index of , while for the higher luminosities the power law index is . There is again some flattening of the cumulative distribution towards the faint source end (Fig. 2b), probably caused by the incompleteness of our sample. These results for the M31 Core field are in general agreement with previous studies of the central part of M31 (Primini et al. (1993); Supper et al. (2001); Shirey et al. (2001); Kong et al. (2002)).
3.2. Comparison with previous results
Studies of the luminosity distributions began as soon as individual X-ray sources in nearby galaxies were resolved (see Fabbiano 1995 for a review of early results). More sensitive surveys with ROSAT and Chandra significantly increased the number of sources detected (see Read, Ponman & Strickland (1997) for ROSAT and Fabbiano (2001) for Chandra review). Most previous studies, however, differ from our present work in two important aspects: (i) for most external galaxies, sensitivity limits were above or around 1037 erg/s, while in our case we are able to study in detail population of sources between 51035 and 1037 erg/s; (ii) previous studies of luminosity distributions in M31 (Trinchieri & Fabbiano (1991); Kong et al. (2002)) were restricted to the central . Since the inner region of M31 () is dominated by the bulge and spheroid populations, the disk population was not well sampled in previous surveys. Our results, however, can be directly compared to the luminosity distributions for Galactic sources obtained by Grimm et al. (2001). The comparison shows that the luminosity function which we obtain for the core region is close to the luminosity function of LMXBs in our Galaxy: both distributions have a characteristic “knee” at a few ergs s-1 and can be described by a broken power law or a cut-off power law models. The luminosity distribution for the two northern fields of M31 resembles the luminosity function for Galactic HMXBs: both have a power law-like form with a slope steeper than that of the corresponding M31 bulge/Galactic LMXB luminosity distributions; the M31 disk/Galactic HMXB distributions terminate at much lower luminosities ( ergs s-1) than M31 bulge/Galactic LMXB luminosity distributions ( ergs s-1). We conclude therefore that the population of fainter X-ray sources we found in disk of M31 is probably dominated by the HMXBs, while the bulge region inside 15 is dominated by LMXBs by analogy with the Milky Way. Our results confirm that, as in Milky Way and other nearby galaxies, the younger population of HMXBs in M31 is typically less luminous than the older populations of LMXBs and globular clusters (see also Helfand & Moran 2001 for a discussion of HMXB luminosities). In our study we see no evidence that the brightest sources in M31 are associated with young populations; in fact, we see the opposite effect. This is in contrast to Soria Wu (2002), who invoke a population of bright young binaries to explain a large number of high luminosity objects observed in the starburst galaxies. That effect can be probably attributed to the differences in the galaxy type and ranges of X-ray luminosities under study.
4. CONCLUSIONS
We analyzed XMM-Newton data for the three M31 fields and detected a total of 230 point-like sources. We built luminosity distributions separately for the bulge (inner 15) and disk regions. A striking difference between the bulge and disk populations has been demonstrated for the first time. We report on the discovery of lower luminosity population in the disk of M31. Comparison of our results with the luminosity function obtained by Grimm et al. (2001) for the Milky Way allows us to conclude that lower-luminosity population in the disk is probably dominated by HMXBs, and that the luminosity distributions of X-ray sources in the bulge and disk of M31 are similar to the corresponding parts of our Galaxy.
5. ACKNOWLEDGEMENTS
We have used data obtained with XMM-Newton satellite. XMM-Newton is an ESA science mission with instruments and contributions directly funded by ESA Member States and the USA (NASA). We are grateful to the personnel of the XMM-Newton Science Operations Centre at VILSPA, Spain for satellite operations and expedited data preparation for scientific analysis. We are thankful to our colleagues from PV data analysis team for a fruitful collaboration in earlier analysis of M31 PV observations (Shirey et al. (2001); Osborne et al. (2001)). We are especially indebted to M.Watson, PI of M31 PV program.
References
- Barmby & Huchra (2001) Barmby, P., & Huchra, J.P. 2001, ApJ, 122, 2458
- Battistini et al. (1987) Battistini, P., et al., 1987, AAS, 67, 447
- Blair et al. (1981) Blair, W. P., Kirshner, R. P., Chevalier, R. A. 1981, ApJ, 247, 879
- Fabbiano (1995) Fabbiano, G. 1995, in X-ray Binaries, ed. W. H. G. Lewin, J. Van Paradijs, E. P. J. van den Heuvel (Cambridge: Cambridge Univ. Press), 390
- Fabbiano (2001) Fabbiano, G. 2001, Vulcano Workshop on Galaxy and Cluster Evolution, 14-18 May 2001, Vulcano, Italy (astro-ph/0109391)
- Giacconi et al. (2001) Giacconi, R., Rosati, R., Tozzi, P., Nonino, M., Hasinger, G., Norman, C., Bergeron, J., Borgani, S., Gilli, R., Gilmozzi, R., Zheng, W. 2001, ApJ, 551, 624
- Grimm et al. (2001) Grimm, H.-J., Gilfanov, M., & Sunyaev, R. 2001, submitted to AA, (astro-ph/0109239)
- Hasinger et al. (2001) Hasinger, G., Altieri, B., Arnaud, M. et al. 2001, AA, 365, L45
- Helfand & Moran (2001) Helfand, D.J., & Moran, E.C. 2001, ApJ, 554, 27
- Kong et al. (2002) Kong, A.K.H., Garcia, M.R., Primini, F.A., DiStefano, R., & Murray, S.S. 2002, Symp. ”New Visions of the X-ray Universe in the XMM-Newton and Chandra Era”, 26-30 November 2001, ESTEC, The Netherlands, (astro-ph/0202065)
- Magnier et al. (1995) Magnier, E.A., Prins, S., van Paradijs, J. et al. 1995, AAS, 114, 215
- Osborne et al. (2001) Osborne, J. P., Borozdin, K. N., Trudolyubov, S. P., Priedhorsky, W. C., Soria, R., Shirey, R., Hayter, C., La Palombara, N., Mason, K., Molendi, S., Paerels, F., Pietsch, W., Read, A. M., Tiengo, A., Watson, M. G., West, R. G. 2001, AA, 378, 800 (O01)
- Primini et al. (1993) Primini, F. A., Forman, W., & Jones, C., 1993, ApJ, 410, 615
- Read et al. (1997) Read, A. M., Ponman, T. J., & Strickland, D. K. 1997, M.N.R.A.S., 286, 626
- Shirey et al. (2001) Shirey, R., Soria, R., Borozdin, K., Osborne, J. P., Tiengo, A., Guainazzi, M., Hayter, C., La Palombara, N., Mason, K., Molendi, S., Paerels, F., Pietsch, W., Priedhorsky, W., Read, A. M., Watson, M. G., West, R. G., 2001, AA, 365, L195
- Soria & Wu (2002) Soria, R., Wu, K. 2002, AA, 384, 99
- Strueder et al. (2001) Strueder, L. et al., 2001, A&A, L18
- Supper et al. (2001) Supper, R., Hasinger, G., Lewin, W. H. G., Magnier, E. A., van Paradijs, J., Pietsch, W., Read, A. M., & Truemper, J. 2001, AA, 373, 63
- Trinchieri & Fabbiano (1991) Trinchieri, G., & Fabbiano, G., 1991, ApJ, 382, 82
- (20) Trudolyubov, S., Priedhorsky, W., Borozdin, K., Mason, K., & Cordova, F. 2002a, IAU Circ. 7798
- (21) Trudolyubov, S., Borozdin, K., & Priedhorsky, W., et al. 2002b, in preparation
- Turner et al. (2001) Turner, M. et al., 2001, A&A, 365, L27
- van den Bergh (2000) van den Bergh, S. 2000, The Galaxies of the Local Group, Cambridge University Press, Cambridge
| Date, UT | , UT | Field | Obs. ID | RA (J2000)a | Dec (J2000)a | Exp.(MOS)b | Exp.(PN)b |
|---|---|---|---|---|---|---|---|
| (h:m:s) | (h:m:s) | (d:m:s) | (s) | (s) | |||
| 25/06/2000 | 10:44:42 | M31 Core | 0112570401 | 00:42:43.0 | 41:15:46.1 | 34835 | 31021 |
| 05/01/2002 | 06:28:31 | M31 North1 | 0109270701 | 00:44:01.0 | 41:35:57.0 | 56810 | 49568 |
| 26/01/2002 | 16:51:03 | M31 North2 | 0109270301 | 00:45:20.0 | 41:56:09.0 | 32193 | 27982 |
-
a
– coordinates of the center of the field of view
-
b
– instrument exposure used in the analysis