A Her X-1 Turn-On: Using the pulse profile to probe the outer edge of an accretion disk
Abstract
The X-ray binary pulsar Her X-1 shows a wide variety of long and short term variabilities in the X-ray light curve. The 35 d variability of the source is interpreted as the influence of a warped, inclined, and twisted accretion disk periodically covering the line of sight to the central neutron star. In 1997 September we observed the “turn-on” of a 35 d cycle with the Rossi X-ray Timing Explorer (RXTE). Spectral analysis reveals that during early phases of the turn-on the overall spectrum is composed of X-rays scattered into the line of sight plus heavily absorbed X-rays. This interpretation is consistent with the variation of the pulse profile observed at the same time. The overall shape of the pulse profile is not changing, but towards earlier phases of the turn-on the pulse signature is steadily “washed out”. This behavior can be understood as an influence of scattering and absorption due to the presence of the accretion disk rim. Using a Monte Carlo code we simulate the influence of both processes on a time variable, beamed emission characteristic, similar to the pulse profile of Her X-1. By comparing the results of the simulation with the observed profiles we determine the amount of scattered radiation, absorbed radiation, and the size of the scattering region.
keywords:
stars: individual (Hercules X-1) – X-rays: stars – stars: neutron – Accretion, accretion disks1 Introduction
Her X-1/HZ Her is a X-ray binary system consisting of a neutron star Her X-1 and its optical companion HZ Her. The system rotates with a 1.7 d orbital period around their common center of mass. The X-ray light curve of Her X-1 shows strong variability on many time scales: e.g. 1.24 s pulsations originating in the rotational period of the neutron star, or the 35 day intensity variation caused by a precessing, inclined, warped, and twisted accretion disk (see [\astroncitePetterson1975, \astronciteSchandl & Meyer1994]).
During the 35 day cycle the X-ray intensity shows strong variation, with two maxima in intensity called the “main-on” and the “short-on”. This intensity variation is caused by periodic covering of the neutron star by the outer (main-on) or the inner edge (short-on) of the accretion disk. The “turn-on” marks the beginning of the main-on and therefore the beginning of the 35 day cycle. During the turn-on the outer edge of the accretion disk steadily opens the line of sight to the neutron star. While the outer accretion disk rim moves out of the line of sight, the observed X-ray intensity steadily increases, until it reaches the maximum after about 2-3 days. Fig. 1 shows the X-ray light curve of a complete turn-on observed in 1997 September with RXTE PCA. In this paper we present preliminary results of our combined spectral and temporal analysis, and resulting simulated pulse variation over the turn-on.

2 Turn-on light curve and spectral analysis
The complete X-ray light curve observed with RXTE is shown in Fig. 1. During the turn-on the observed flux steadily increases until its maximum in orbit 31. Around MJD 50704.8 and MJD 50705.3 an anomalous dip, a pre-eclipse dip, and at MJD 50705.5 an eclipse occurred. For our spectral modeling and pulse analysis we ignored the times of the dips (orbit. 10–14) and the time of the eclipse (orbit 19–22) because our spectral model is not applicable during these times. The numbers in the top panel of Fig. 1 identify individual RXTE orbits starting from 00 to 31.
As presented earlier (e.g., [\astronciteKuster et al.1999]), a spectral analysis and an analysis of the pulse profile reveals that,
-
•
the spectral evolution during the turn-on can be described by a combination of direct, absorbed, and scattered radiation,
-
•
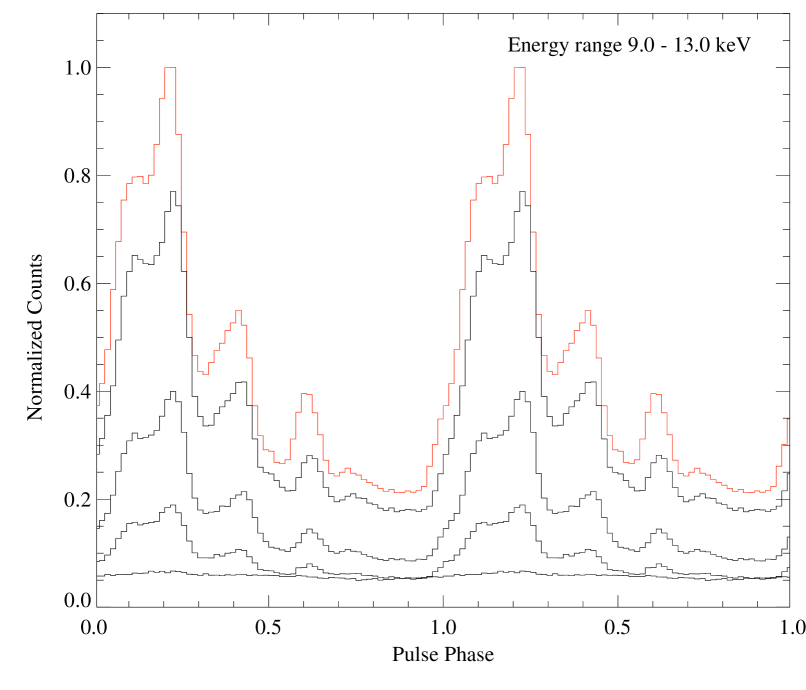
the intrinsic shape of the pulse profile is not changing over the time of the turn-on, but the pulse signature is steadily washed out towards the beginning of the turn-on (see Fig. 2), and
-
•
the pulse profile and the spectrum at the end of the turn-on (later than orbit 30) shows no significant signature of absorbed or scattered radiation.
These results are in agreement with earlier observations of e.g. [*]mkuster-C1:davison77a, [*]mkuster-C1:becker77a, or [*]mkuster-C1:parmar80a, who found the contribution of two components to the overall observed X-ray spectrum: a “scattered” component and a “absorbed” component. The origin for the scattered component is generally interpreted (e.g. [\astronciteMihara et al.1991]) as the influence of an extended, ionized accretion disk corona at a distance of cm. Recent observations with XMM-Newton’s RGS show strong indication for the presence of an accretion disk corona in Her X-1 as well ([\astronciteBurwitz et al.2002]). The “absorbed” spectral component is attributed to the influence of the outer accretion disk rim partially obscuring the central emission region.
3 Simulating pulse variation


Taking the results from the spectral analysis into account, we can assume that the variation of the pulse profile at the beginning of the turn-on is caused by scattering and photoelectric absorption in the medium covering the line of sight to the neutron star (the outer accretion disk rim and corona). Furthermore we can assume that at the end of the turn-on, when the accretion disk rim has moved out of the line of sight, the pulse profile represents an unaffected emission characteristic. Thus we can use the pulse profile observed in, e.g., orbit 30 as a template and investigate the effects of a scattering and absorbing corona on the pulse shape depending on and the size of the scattering region.
For our simulations we used a Monte Carlo code developed at our Institute, assuming simplified slab geometry and taking into account Compton scattering, photoelectric absorption, and fluorescent line emission. As a result we obtain the Green’s function as a function of =, the thickness of the slab , and the energy band, and angle-dependent photon spectra of photons leaving the slab. We simulated for two cases, a fully ionized corona and a neutral corona. The total Green’s function for a partially ionized corona can then be calculated as , where a is the fraction of ionization. For we used determined by the spectral analysis. With a variable for we can then use this simulated Green’s function to calculate modified pulse profiles an observer located at infinity would see according to:
| (1) |
where is the intensity of the template pulse profile at time . Finally we perform a minimization fit of simulated to observed pulse profiles for each single RXTE orbit shown in Fig 1. As an example, the result of the fit for orbit 08 is given in Fig. 4. All four energy bands were fitted simultaneously. By combining this procedure with a spectral analysis based on a partial covering model (see [\astronciteKuster et al.1999]), we are able to separate the amount of scattered and absorbed radiation from purely scattered radiation, and determine the thickness of the corona as well as the uncertainties, respectively.
4 Results
Preliminary results of our pulse analysis are shown in Fig. 3. The crosses in Fig. 3 show the evolution of neutral density deduced from the spectral analysis. As reported earlier by us ([\astronciteKuster et al.2001]), is increasing at the beginning of the turn-on and starts to decline orbit 05. This behavior can be understood due to an additional flux contribution of a scattering corona which comes important at high densities and thus dominates the spectrum during early phases of the turn-on. The diamonds in Fig. 3 show the results we get from our pulse profile analysis. This can be attributed to the flux contribution of a scattering corona moving slowly out of the line of sight to the neutron star.
Acknowledgements.
This work is partially funded from DLR grant 50 0x0002 and NATO grant PST CLG975254.References
- [\astronciteBrainerd & Lamb1987] Brainerd, J., Lamb, F.K. 1987, ApJ, 317, L33
- [\astronciteBecker et al.1977] Becker, R.., Boldt, E.A., Holt, S.S. 1977, ApJ, 214, 879
- [\astronciteBurwitz et al.2002] Burwitz, V. , Dennerl, K., Predehl, P., Stelzer, B., this volume
- [\astronciteDavison & Fabian1977] Davison, P.J.N., Fabian, A.C. 1977, Mon. Not. R. Astron. Soc., 178, 1P
- [\astronciteGiacconi et al.1973] Giacconi, R., Gursky, H., Kellog, E. et al. 1973, ApJ, 184, 227
- [\astronciteKuster et al.1999] Kuster, M., Wilms, J., Blum, S. et al. 1999, Astro. Lett. Com., 38, 161
- [\astronciteKuster et al.2001] Kuster, M., Wilms, J., Blum, S. et al. 2001, AIP. Conf. Proc., 599, 706
- [\astronciteKylafis & Klimis1987] Kylafis, N.D., Klimis, G.S., 1987, ApJ, 323, 678
- [\astronciteKylafis & Phinney1989] Kylafis, N.D., Phinney, E.S., 1989, NATO ASI, C262, 731
- [\astronciteLightman et al.1981] Lightman, A.P., Lamb, D.Q., Rybicki, G.B. et al 1981, ApJ, 248, 738
- [\astronciteMihara et al.1991] Mihara, T., Ohashi, T., Kasuo, M., 1991, Publ. Astron. Soc. Jpn., 43, 501
- [\astronciteParmar et al.1980] Parmar, A.N., Sanford, P.W., Fabian, A.C. 1980, Mon. Not. R. Astron. Soc., 192, 311
- [\astroncitePetterson1975] Petterson, J.A. 1975, ApJ, 201, L61
- [\astronciteSchandl & Meyer1994] Schandl, S., Meyer, F., 1994, A&A, 289, 149
- [\astronciteTananbaum et al.1972] Tananbaum H. 1972, ApJ 174, L143