The Outer Atmosphere of the M-type Supergiant Orionis: K i 7699Å Emission
Spatially-resolved high-resolution long-slit spectra of Betelgeuse’s circumstellar shell are described for a spectral window centered on the 7699Å resonance line of neutral potassium. The K i emission from resonance fluorescent scattering of photospheric photons which is mapped out to 50 arcsec from the star is approximately spherically symmetric with a brightness decreasing as , where is the radial distance from the star. Our measurements together with the earlier theoretical interpretation by Rodgers & Glassgold suggest that the mass loss rate is about 2 y-1. The K i emission is far from homogeneous: intensity inhomogeneities are seen down to the seeing limit of about 1 arcsec and the velocity resolution of about 2 km s-1. There is clear evidence for a thin shell of 50 arcsec radius. This is identified with the weaker circumstellar absorption component known as S2. Estimates are made of the density of K atoms in this shell ( cm-3).
Key Words.:
Stars: circumstellar matter; Stars: individual: Betelgeuse; Stars: supergiants; Stars: winds, outflows1 Introduction
Massive stars may evolve to become red supergiants prior to death by supernova explosion. Since mass lost by the red supergiant may dictate the time and form of the explosion and also the nucleosynthetic contribution of the massive star to the chemical evolution of the Galaxy, studies of mass loss by red supergiants are of great interest. Mass loss rates are not yet calculable from an ab initio theory. Although measurements of the mass loss rates are available from a variety of observations of the gas and dust in the circumstellar winds, uncertainties remain large. One factor that is often a contributor to the uncertainties is an assumption that the stellar surface, circumstellar shell and the wind are spherically symmetric. Observations are beginning to reveal that supergiants do not recognize fully this simplifying assumption.
Direct observational tests of the assumption are most easily executed on the nearest red supergiants. In the case of Betelgeuse ( Orionis), the nearest of these stars, departures from spherical symmetry have been extensively noted. At ultraviolet, visible, and near-infrared wavelengths, observations have shown the presence of ‘bright spots’ on or near the stellar surface (cf. Gilliland & Dupree 1996; Buscher et al. 1990; Young et al. 2000). Such spots that change with time are generally attributed to hot rising convective cells, as predicted by Schwarzschild (1975) and recently shown by Freytag (2002) in 3D hydrodynamical simulations (the hot spots appear occasionally over downdrafts), but an alternative origin has been proposed (Gray 2000). Comparison of ultraviolet and radio brightness temperatures led Lim et al. (1998) to conclude that strong temperature inhomogeneities extend to at least several stellar radii above the surface. The measured radio brightness temperature at 6cm of about 1400K corresponding to a height of about 7 stellar radii is in good agreement with the temperature of about 1200K derived by Justtanont et al. (1999) from infrared ground state fine structure lines of Si ii and Fe ii. Temperatures derived from ultraviolet spectra are much higher at these heights implying that cold and warm gas coexist at the same heights above the stellar surface (Lim et al. 1998). Recently, Harper, Brown, & Lim (2001) have constructed a semiempirical model for the inner shell extending from the photosphere to about 40 stellar radii (about 2 arcsec). It is not unlikely that the inhomogeneities detected in ultraviolet and radio observations persist to greater heights and into the stellar wind.
Dust in the shell close to the star has been resolved by infrared interferometry and direct imaging, and detected far from the star by the polarization that scattering of dust grains introduces. Infrared emission at about 11 m from silicate dust grains comes from an extended region of several arcsec with an inner shell radius of 1 to 2 arcsec (cf. Sloan, Grasdalen, & LeVan 1993; Danchi et al. 1994; Bester et al. 1996; Rinehart, Hayward & Houck 1998; Sudol et al. 1999). Undoubtedly, dust - cooler grains - extends to greater distances but has yet to be resolved by far-IR imaging. Extended emission in IRAS images was noted by Stencel, Pesce, & Hagen (1988) and Young, Phillips, & Knapp (1993a, 1993b). Warm and cold dust is observable by the photospheric light that grains scatter. This scattered light is separable from light scattered by the Earth’s atmosphere and the telescope by its polarization: the polarization vector is tangential to the radius vector. McMillan and Tapia (1978) following a suggestion by Jura and Jacoby (1976) detected the polarized scattered light from Betelgeuse’s shell. Additional measurements were made by Le Borgne, Mauron, and Leroy (1986) who show that the number density of dust grains declines roughly as the inverse-square of the radial distance from the star for distances of 10 to 90 arcsec.
Circumstellar gas as detected by blue-shifted absorption lines was observed and analyzed by Weymann (1962) who provided indirect evidence that the shell extended to great distances from the star. Direct evidence in the case of the visual binary Herculis for a very extended shell off this M supergiant was presented by Deutsch (1956) who found circumstellar lines in the spectrum of the visual companion to the supergiant. Weymann’s inferences about the shell size were compatible with the direct lower limit to the outer shell radius from Deutsch’s observation. Observations of H i 21 cm emission from Betelgeuse have shown that gas extends to about 1 minute of arc from the star (Bowers & Knapp 1987).
Betelgeuse’s circumstellar shell was resolved spatially by Bernat & Lambert (1975) who detected fluorescent emission in the K I 7699Å resonance line at angular distances of 2 - 4 arcsec from the star. Subsequent observations extended the detections of the 7699Å emission to about 60 arcsec from the star and provided evidence for some departures from spherical symmetry and for structures in the shell (Bernat & Lambert 1976; Bernat et al. 1978; Honeycutt et al. 1980; Mauron et al. 1984; Mauron 1990). Emission in the Na D lines was detected by Mauron & Querci (1990), Mauron (1990), and Mauron & Guilain (1995). The most remote (from the star) manifestation of the circumstellar shell is the parsec-sized bow shock reported by Noriega-Crespo et al. (1997) from IRAS images at 60 and 100 m. Emission detected from an arc with a mean radius of 6 minutes of arc is attributed to material confined by the interstellar medium’s ram pressure.
In this paper, we present and analyse a new series of observations of K i 7699Å emission obtained with a long slit at a resolving power of about 110,000 or 2.6 km s-1 with the slit placed at various impact parameters from the star and position angles around the star, and at several epochs. Our combination of spectral and spatial resolution was not achieved by earlier studies of the K i emission. We derive afresh the radial dependence of the K i emission and rediscuss the principal conclusion - the mass loss rate - that has been previously drawn from the radial dependence. A novel result of our observations is the discovery of clumps in the emission and, hence, in the neutral gas in the shell and wind. Some of these inhomogeneities are unresolved both spatially in our seeing-limited observations and also kinematically at the limit of about 2 km s-1.
2 Observations and Reductions
Betelgeuse was observed in 1994 February, March, and November with the W.J. McDonald Observatory’s Harlan J. Smith 2.7m reflector and its coudé spectrograph. The latter was used with an echelle grating and an interference filter to separate the order providing the K i 7699Å line. The slit length was varied with a majority of the observations taken with a length of 10 to 100 arcsec. The slit width was almost always set at 0.55 arcsec. Spectra were recorded by a Tektronix 512 X 512 CCD over a bandpass of about 17Å. Standard reduction procedures were applied to correct for the bias and pixel-to-pixel variations. The wavelength scale was set using Th-Ar lamp spectra.
During each observing session, several on-star spectra were recorded with a very short slit length. Off-star spectra were then collected with longer slit lengths. In general, the star was not included in the slit; inclusion limited the exposure time beyond which the starlight saturated a portion of the CCD chip. Since the field at the coudé focus rotates, exposure times were kept short to minimize smearing of emission inhomogeneities; typically, exposure times were 10 minutes or less. For capturing emission far from the star, a few exposures as long as 30 minutes were made. Relative spectrophotometry was attempted; observations were terminated in partly cloudy skies. The stellar flux was measured by opening the slit to its maximum width when all the visible image was contained within the slit. A guider maintained the star’s position relative to the slit to an accuracy of about 0.5 arcsec.
Our reduction techniques were adapted directly from those described earlier (Plez & Lambert 1994). In short, the spectrum at a given location off the star is presumed to be a composite of emission from the gas down the line of sight through the shell at that point and starlight scatter in the Earth’s atmosphere and the telescope. We assume that the latter contribution may be represented by a scaled version of an on-star spectrum. Fig. 1 provides an example of a raw off-star spectrum and the spectral image after subtraction of the photospheric scattered light.
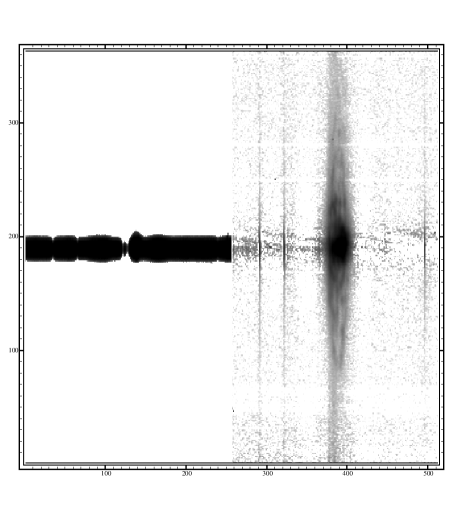
For positions of the slit near the star (a few arcsec), the photospheric scattered contribution largely dominates over the light scattered by the shell. This makes the subtraction difficult, as the imperfectly removed background spectrum shows in Fig. 1. The terrestrial O2 lines appear weakly in emission in the image after subtraction. This is due to the difference in illumination across the slit when the star is on one side of the slit. For spectra taken very near the star, we could improve subtraction of the photospheric component by shifting the spectra by less than half a pixel in the dispersion direction. Slight changes in airmass between the on-star and off-star exposures may also affect the subtraction of the O2 lines.
The spectrum after subtraction of the scattered light is a velocity-position map of the emission. Rows of pixels parallel to the dispersion give the spectrum at different points in the shell. The radial distance of a point from Betelgeuse may be calculated from the impact parameter (3 arcsec in this case) and the distance in seconds of arc from the point on the slit of closest approach to the star. The orientation of the slit was derived from the hour angle of the observation. A thin uniform shell of outwardly flowing and fluorescing K i atoms appears as an ellipse in such a velocity-position map. Such an elliptical looking feature is evident in Fig. 1. The extent of the ellipse along the slit is set by the radius of the shell and the impact parameter. The maximum width of the ellipse is directly related to the expansion velocity and impact parameter; the width vanishes when the impact parameter equals the shell’s radius.
Several assumptions underlie our reductions. The recorded off-star spectrum results from a convolution of the light from points around a position on the slit with the seeing profile. A deconvolution of the observed spectra to obtain the true spectrum at a point is impossible given the varying seeing conditions. We assume that the dominant contaminant is scattered starlight with a spectrum represented by the on-star spectrum. The on-star spectrum is itself, however, not devoid of signatures of circumstellar K i absorption and emission at 7699Å. In particular, there is strong blue-shifted absorption introduced by the potassium atoms along the line of sight to the star. At some level, this absorption is weakened by emission from the immediate environs of the star. Certainly, the angular diameter of the stellar photosphere of about 0.05 arcsec is considerably smaller than the smallest aperture (0.55 x 0.55 arcsec) used for the on-star spectra. There is no obvious way to retrieve the true stellar spectrum from the data. A predicted photospheric profile could be used but this would not account for the fact that much of the shell absorption probably occurs close to the star. In view of the low inferred intensity (relative to the stellar scattered light) and the steep gradient of the emitted light from the shell, we suggest that our simple reduction technique is adequate.
Our assumption that the circumstellar shell’s contribution is solely emission in the K i line ignores a contribution from the dust grains that scatter photospheric light. This scattered light from different locations in the shell will be Doppler-shifted by different amounts off the (assumed) radially-flowing dust grains, i.e., the scattered light will be a smeared version of the photospheric spectrum. Optical depth due to dust is small and multiple scattering of photons may be neglected. Circumstellar gas is flowing out at a velocity of about 10 km s-1. If the dust and gas are well coupled, the Doppler shifts imposed on light scattered by dust grains will amount to a line broadening of less than about 10 km s-1. Since the intrinsic widths of the photospheric lines exceed this value, it will be difficult to distinguish the dust-scattered contribution from that scattered by our atmosphere and telescope. Such a distinction is especially hard to achieve with our spectra in which the K i line is the sole strong line. Perhaps, the isolation of the dust-scattered component can be made using a region richer in deep absorption lines. It may be necessary to exploit the polarization of the scattered light to effect a clear isolation of the dust-scattered light. We assume that the dust makes a negligible contribution to the total scattered light.
Our interpretations are based on the assumption that the K i emission results from fluorescence and not from radiative recombination or collisional excitation. Calculations using densities and temperatures expected of the stellar wind fully support this assumption.
3 An Asymmetric and Clumpy Shell
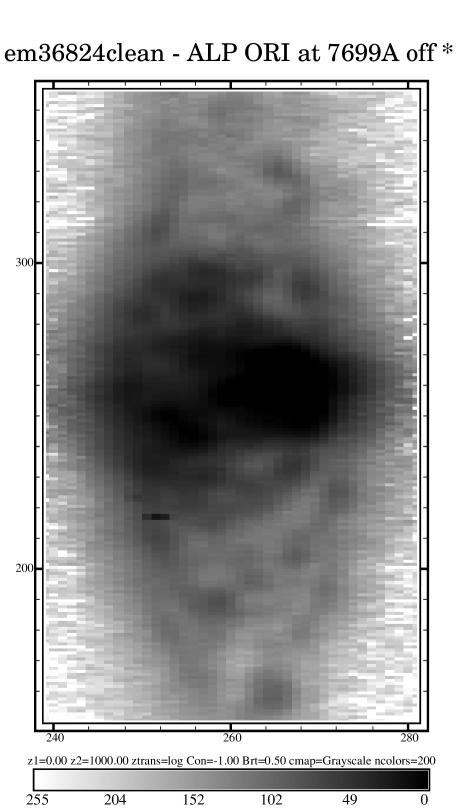
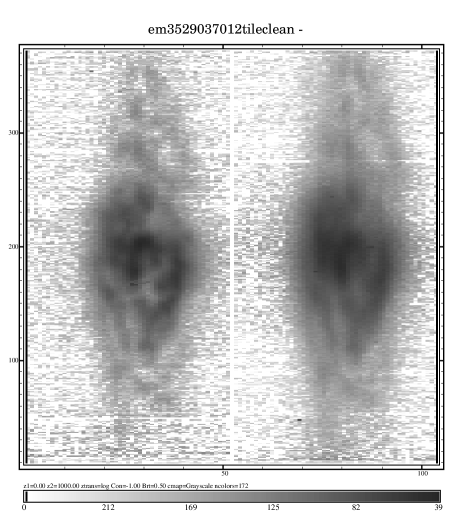
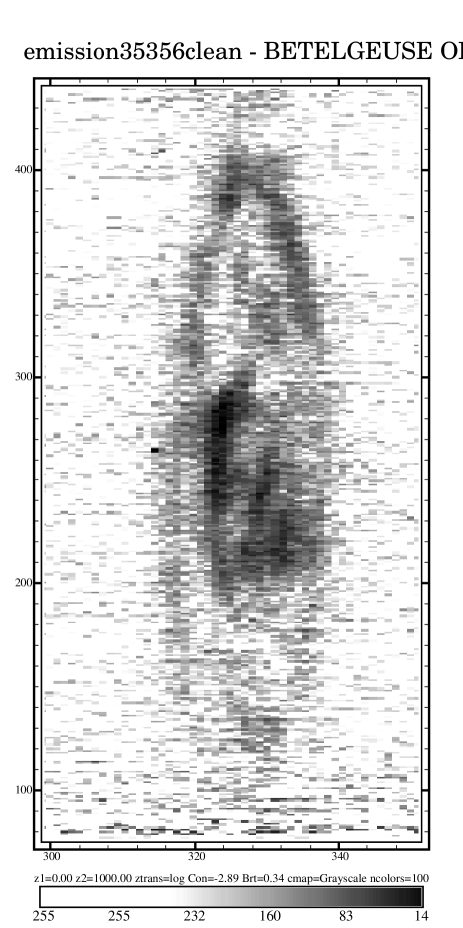
Inspection of the reduced spectra shows that the circumstellar envelope as traced by the K i emission about the star is not completely spherically symmetric. A particularly striking feature of the velocity-position maps is the appearance of clumps at scales extending down to the spatial and spectral resolution of our observations. This degree of clumpiness has not been revealed by previous observations. Sample velocity-position maps are shown in Fig. 2, 3 and 4 for slit positions at increasingly larger distances from the star illustrate these departures from spherical symmetry which we discuss in detail below. These Figures also show that the maximum velocity extent of a velocity-position map is not greatly different for small and large impact parameters.
3.1 Radial Dependence of the K i Emission and Mass Loss Rate
By azimuthal averaging to the maximum extent possible for a given sequence of observations, it is possible to determine the mean radial dependence of the emission intensity integrated over the line profile. This was done only for exposures obtained under good photometric conditions. The intensity of the scattered light at the radial distance is written as . We scale the intensity to the measured stellar flux measured with the very wide slit. was measured by integrating the on-star spectrum flux over the whole spectral interval (512 pixels corresponding to 17.24Å). This total flux was then divided by the wavelength range and the integration time. The resulting is thus expressed in counts per Å per second. Note that Mauron et al. (1984) used a similar definition in averaging the flux over 20Å, while Mauron (1990), Honeycutt et al. (1980), and Bernat et al. (1978) used the photospheric flux in 1Å centered on 7699Å. There are a number of sources of uncertainty affecting the determination of the photospheric flux and in the ratio, mostly because of possible loss of photons intercepted by the slit jaws, and changes of transparency and seeing conditions between exposures. The derived normalized intensity of the K i emission, , is shown in Fig. 5 for impact parameters out to 50 arcsec from the star. The mean profile is consistent with a power law of slope -2.36 0.03 (least-square fit to the data).

Perhaps, one should fit the data with a two component model: a slope of -2.59 0.2 out to 7 arcsec and of 2.55 0.07 beyond 10 arcsec but brighter by a factor of 1.4.
Our measured slope is equal within the uncertainties to that reported earlier by Honeycutt et al. (1980) who gave the slope as -2.65 0.2 from average measurements in the four principal quadrants at radial distances of about 10 to 50 arcsec. Estimates of the intensity of the scattered light are similarly in good agreement: we obtain at 20 arcsec from the star, and Honeycutt et al. reported a value of . The agreement is less satisfactory with Mauron et al. (1984) who reported a slope of -3.5 0.8 from measurements spanning distances of 20 to 55 arcsec but the intensity at 20 arcsec () is consistent with other measurements. Mauron’s (1990 - see also Mauron & Querci 1990) measurements at 5 to 8 arcsec are similarly a little higher in intensity than our mean values. Although the differences could be due to changes in the efficiency of fluorescence, the density of potassium atoms in the shell, and other physical factors, we think it more likely that they reflect observational errors encurred in the surface photometry. As noted by Mauron (1990), earlier results by Bernat et al. (1978) gave much higher intensities for the emission close to the star than are now reported: e.g., Bernat et al. found at about 3 arcsec but our value is 10-3.1. This large difference is unlikely to be due to changing conditions at the stellar surface or in the shell but reflects the difficulty of making photometric measurements of a faint light source close to a bright star with a detector (a vidicon) with a non-linear response.
A calculation of the stellar mass loss rate from the radial dependence of the 7699Å emission has been discussed previously, notably by Rodgers & Glassgold (1991). Although the observations may provide reliable estimates of the run of the density of potassium atoms, an estimate of the mass loss rate calls for knowledge the degree of ionization of potassium, the depletion of potassium onto dust grains, excitation of the atoms (fluorescence vs radiative recombination, for example) in the shell, and radiative transfer through the shell. We assume the shell to be optically thin to the resonance photons, a conclusion that is not contradicted by the ratio of emission in the two resonance lines (Mauron & Querci 1990). Here, we adopt the recipes provided by Rodgers & Glassgold and adjust their derived mass loss rate to our measured intensities.
The slope of the versus relation is, if spherical symmetry is assumed, directly related to the radial dependence of the number density of neutral potassium atoms. Additional assumptions include uniform illumination of the atoms by the photosphere, and a shell that is optically thin to the 7699Å photons. It is then readily shown that a relation provides an intensity dependence (Bernat 1976; Gustafsson et al. 1997). If neutral potassium atoms are conserved in a radial outflow, their density dependence follows and follows a power law of slope 3. Conversely, the observed slope of -2.36 indicates a density dependence with a slope of -1.36. Our observed slope is in good agreement with the value of -2.33 corresponding to the model by Rodgers & Glassgold. The difference between their prediction and the slope of -3 predicted for a uniform shell with conservation of potassium atoms is due to their introduction of ionization of potassium atoms in the shell by chromospheric ultraviolet photons. Glassgold & Huggins (1986) and Rodgers & Glassgold (1991) discuss in detail the run of the neutral potassium fraction. The ionizing chromospheric radiation field is not much shielded in the envelope and decreases as . The electron fraction, set constant in Glassgold & Huggins model, increases slightly outwards in Rodgers & Glassgold’s more detailed model resulting in a gradient of the electron density which is shallower than . The recombination coefficient increases with distance as a result of the temperature decrease. The neutral fraction thus increases with distance from the star in the inner shell. At large distances out from the star where ionization of potassium atoms is controlled by the interstellar radiation field, the slope of must steepen. This steepening is visible beyond about 30 arcsec in our data on Fig. 5, although at first sight masked by the detached shell S2 (see Sec. 3.2.2). The slope increase (to about -4.2) is consistent with Rogers and Glassgold (1991) model.
Following Gustafsson et al. (1997) we write:
where is the angular distance from the star in arcsec, is the oscillator strength of the line, is the number density of scattering atoms in cm-3, is the distance to the star in parsec, and is the distance along the line of sight in cm. Assuming a power law of the form: , with the number density at cm, the integral is readily calculated and yields: , with a constant depending on the value of . From our observations we derive . Adopting a distance of 140 pc for Betelgeuse from its Hipparcos parallax of mas, we find the number density of scattering atoms to be (K i) = 6.0 cm-3.111Gray (2000) has remarked that the accuracy of the Hipparcos parallax may be seriously underestimated because it assumes that the centroid of the stellar image remained fixed relative to the stellar disk over the period of observations; a bright spot midway between disk center and the stellar limb and contributing 25% of the light could cause the centroid to shift by half the parallax.
The column density of neutral K atoms along the line of sight to the star was derived by Bernat (1977) from the 7699 Å circumstellar absorption line: (K i) cm-2. Integrating our relation for the radial dependence, Bernat’s column density is reached by integrating from infinity to an inner radius = . This is a plausible value for the inner radius. To halve the column density requires . To double for , which makes no sense. In short, our derived radial dependence for the density of potassium atoms is consistent with the column density derived from the absorption line.
For this reason and because our observed slope for is equal to that predicted by Rodgers & Glassgold, we use the ratio of our observed to their predicted number density versus radial distance directly to correct their mass loss rate. This corresponds to a reduction of their mass loss rate from = y-1 to y-1. The revision is dependent on our value of which rests on an average of the stellar photospheric flux averaged over 17 Å around the potassium line. The stellar flux intercepted by the outflowing gas of the shell is that on the blue wing of the K i line. As already pointed out, we do not have access to the true photospheric spectrum, and the K i line profile can only be guessed at. A rather conservative estimate of a factor of 2 lower flux at line center leads to a mass-loss rate larger by a factor of two. A distance of 200 pc was assumed by Rodgers & Glassgold and Glassgold & Huggins. To correct the mass loss rate to the Hipparcos distance of = 140 pc, we use the scaling given by Mauron & Caux (1992), i.e., the K i brightness at a given angular distance from the star is approximately proportional to . Adoption of = 140 pc instead of 200 pc implies a reduction of by 85 % or y-1. Glassgold & Huggins warn that the accuracy of an derived from K i emission is low (“a factor of some 3 - 5”). Although the subsequent analysis of the temperature profile (Rodgers & Glassgold 1991) may have reduced the uncertainty, a factor of two uncertainty seems likely to be optimistic. The derived rate is dependent too on the assumption of a spherically symmetric shell, an assumption probed observationally in the next section.
This uncertainty could in principle be reduced by observing other emission lines. In light of the higher abundance of Na and using the atomic concentrations predicted by Rodgers & Glassgold’s (1991), the Na D emission is expected to be stronger than that in the K i 7699 and 7665 Å lines. Mauron & Guilain (1995) find that the Na D emission is considerably fainter than expected although other mass losing M stars do show Na D emission stronger than the K i emission. These authors suggest that interstellar absorption is “the simplest explanation, though not completely convincing”. Fortunately, interstellar absorption in the K i lines is observed to be considerably weaker than in the Na D lines.
Betelgeuse has been subjected to numerous investigations of its mass loss rate using a variety of spectroscopic indicators. The K i-based rate may be compared with a couple of determinations using tracers of a major constituent of the shell. Bowers & Knapp (1987) detected 21 cm H i emission to derive y-1 if = 140 pc. Huggins et al. (1994) detected the C i 609 m fine structure line and inferred a mass loss rate also of y-1 for = 140 pc. The close agreement between these results and ours is encouraging but must be largely fortuitous. More recently, Harper et al. (2001) estimated y-1 from absorption features in ultraviolet Fe ii lines.
3.2 Departures from Spherical Symmetry
Azimuthal averaging produces a smooth run of the emission line’s flux with radial distance but masks a fascinating structure of incomplete shells and clumps. This structure is illustrated in Fig. 2, 3, and 4 and additionally in Fig. 6, and 7. Several features of the structure are seen by inspection: the appearance of thin incomplete shells, intense clumps of small spatial extent and velocity dispersion, and lines of sight - particularly far from the star and inside the outermost detected shell - from which no 7699Å emission is detected, and a seemingly sharp boundary to the outermost shell.
The following relations are helpful in discussing the properties of the circumstellar shell. At the assumed distance of 140 pc, 1 second of arc corresponds to a projected distance of 140 AU or a light travel time of about 19 hours. The stellar angular diameter is taken to be 0.044 arcsec (Dyck et al. 1998) or a stellar radius of 3.1 AU. At an expansion velocity of 15 km s-1, gas travels 3.2 AU in 1 year or an angular distance of just 0.02 arcsec.
3.2.1 Temporal Dependence?
Our observations were obtained over several months in 1994. In different observing runs, several successful attempts were made to acquire a series of spectra with the slit set relative to the star at the same positions and orientations. A goal of these observations was to search for changes in the velocity-position maps.
Expected time scales for changes to occur in the wind itself are much longer than a few months (see below). More rapid changes may result from the rise and fall of bright (or dark) spots on the stellar surface. High angular resolution images of Betelgeuse’s disk show a few (1 - 3) bright spots contributing 10 - 20 per cent of the light and changing on a timescale of weeks to months (Wilson, Dhillon, & Haniff 1997). With a light travel time of about a month to a radial distance of about 30", intensity fluctuations of (say) 20 % evolving on a time scale of a month are not going to produce dramatic changes in the fluorescent emission. Were a spectacularly bright spot to occur, a large intensity contrast would be seen in the hemisphere facing the spot. The appearance of shells and especially the presence of clumps cannot be traced to spots on the illuminating photosphere.
Changes in the density of potassium atoms depend on the rates of ionization and recombination. With rates taken from Glassgold & Huggins (1986), we find the timescale for photoionization by the stellar radiation field to be yr where is the distance from the star expressed in arcsec. The recombination timescale is necessarily much longer: yr (or with the temperature dependence of the recombination coefficient taken into account). Except perhaps very close to the star, these estimates show that changes in K i emission occurring on a time scale of a few months are unlikely to be traceable to variations in the photoionizations by the stellar radiation field.
Fig. 3 shows pairs of velocity-position maps taken at the same slit position relative to the star but at 8 months apart. By inspection, there is considerable similarity between the March and November observations for which the impact parameter of the slit was 13 arcsec. Gross structures may be deemed identical. Smaller structures (here dubbed ‘clumps’) show no discernible change in location. Differences in shape of the smaller structures may be attributed to differences in the seeing: the seeing was about 1.2 arcsec for the March observation but about 3 arcsec in November.
Fig. 6 and 7 show similar pairs of velocity-position maps from the March and November runs but with an impact parameter of 21 arcsec.
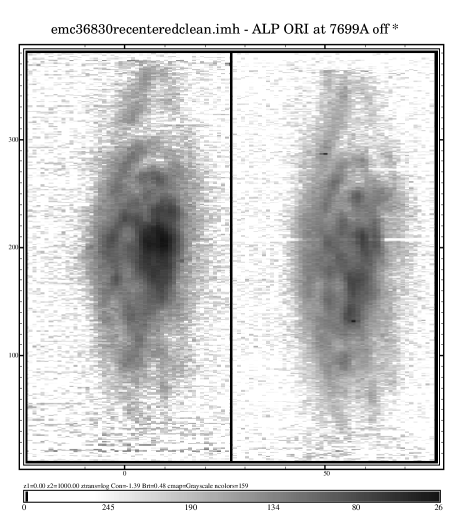
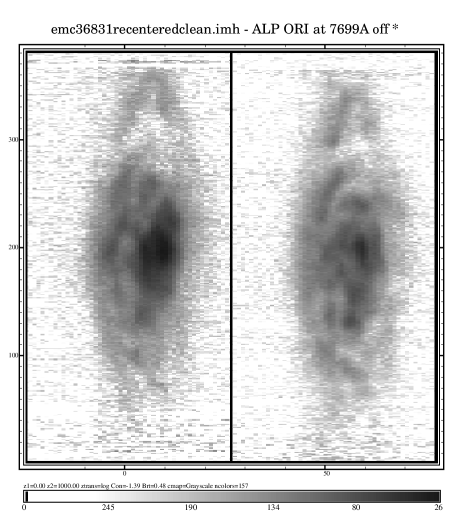
The exposure in Fig. 7 was obtained immediately following that in Fig. 6. In these figures, there is evidence for changes in the smaller structures. Indeed, the March pair of maps clearly differ in the inner parts from the same area in the November maps. Close inspection shows a few differences for clumps in successive maps in March and in November. This is not surprising given that successive maps owing to image rotation at the coudé focus do not sample exactly the same portion of the shell. The telescope was guided on the star and the slit rotates about the star. Changes in position on the sky recorded by a particular pixel can exceed the angular size of some clumps, and, hence, these may appear clearly in one image but not in the next. This instrumental effect increases with increasing impact parameter which may explain in part why changes are more evident in Fig. 6 and 7 than in Fig. 3.
3.2.2 A Distant Spherical Shell
A striking feature of the velocity-position maps with impact parameters greater than about 20 arcsec is the appearance of an elliptical shape for the outermost emission (Fig. 4. Emission is very weak, possibly absent, beyond about 1 minute of arc from the star. Ellipticity of isophotes in the velocity-position map corresponds to a spherically symmetric expanding shell. Geometry of the slit position (at 33 arcsec from the star) and the semi-major axis of the ellipse show that the shell radius is 50 2 arcsec. The maximum velocity width, the ellipse’s semiminor axis, corresponds to an expansion (radial) velocity of 18 2km s-1. Note that the shell is clearly seen in Fig. 5 as the plateau followed by an intensity drop at about 50 arcsec. At that distance from the star, the mean K i density is rapidly decreasing with distance, due to the interstellar UV field (see Fig. 5 and Sec. 3.1), and the shell represents a considerable density enhancement.
The thickness of the shell is 1 to 2 arcsec in position on the sky and is unresolved in velocity, i.e. less than 2.6 km s-1. Non-uniform emission over the spherical shell could result from one or more of several factors: shell ejection occurred preferentially over one hemisphere of the star; the excitation of the shell is non-uniform owing to a bright spot on the stellar disk; the ionisation of potassium atoms is greater over one hemisphere due to a chromospheric enhancement; the shell is plowing into the irregular local interstellar medium and deceleration enhances the local density non-uniformly.
Circumstellar absorption imposed upon the photospheric spectrum is composed of two components in atomic (e.g., K i 7699 Å as shown by Bernat & Lambert [1975] and Goldberg et al. [1975]) and the CO lines by Bernat et al. (1979) who labelled the components S1 and S2 where the former has a higher excitation temperature (200K vs 70K), substantially larger CO and K i column densities and lower expansion velocities. The expansion velocity deduced from the S2 absorption lines (20.2 km s-1 from Goldberg et al., and 13 km s-1 from Bernat et al.) are consistent with our measurement. Note that the absorption line measurements are made relative to photospheric lines but the photospheric velocity is variable. Our measurement is a true expansion velocity, relative to the center-of-mass of the star, independent of the stellar velocity, and of photospheric velocity variations.
Another notable difference between the S1 and S2 components is the very narrow line width of the latter: a Doppler width of 1 km s-1 for S2 but 4 km s-1 for S1 from visual lines (Bernat 1977). The Doppler width for S2 corresponds to a full width at half intensity of 1.7 km s-1, an estimate consistent with the upper limit obtained from our observation of the shell emission. Bernat et al. from a comparison of the collisional and radiative rates for CO excitation inferred that the former dominate and, hence, their excitation temperature was approximately equivalent to the gas kinetic temperature. Reference to a dust shell model (Tsuji 1979) showed a gas temperature of 70 K was achieved at about 55 arcsec from the star, a prediction quite consistent with our observed shell radius.
Judged by velocity of expansion, line width, and shell radius as measured or estimated from the CO lines and our 7699Å velocity-position maps, we identify the circumstellar gas contributing the S2 absorption lines with the outermost thin shell seen in Fig. 4. This identification allows interesting further deductions to be made. In particular, the volume density of CO molecules and neutral K atoms may be estimated from their column density and the shell thickness. The equivalent width of the K i 7699Å S2 line estimated from Goldberg et al. (1975, their Figure 1a) gives a column density N(K i) cm-2 on the assumption that the line is unsaturated. After correction for seeing, the shell’s thickness may be about 1 second of arc. At = 140 pc, a shell thickness of 1 second of arc corresponds to 2 cm. Then, the K i density in the shell is about 6 cm-3. In contrast, Rodgers & Glassgold’s (1991) model predicted a density of (K i) cm-3 at the shell’s distance. This difference is not surprising as the shell by inspection of Fig. 4 is evidently a considerable density enhancement above the gas at smaller and greater distances In addition, the intensity variation around the shell is obvious implying that the cut through the shell to the star that gives the K i absorption line may not be representative of mean conditions in the shell.
If the shell at 55 arcsec is identified with Bernat et al.’s S2 shell, their measured column density (1.2 cm2) translates to a volume density (CO) cm-3. The ratio of the CO and K i column densities suggests a density ratio (CO)/(K i). The elemental abundance ratio in the photosphere is probably a little less than the solar ratio of 2700 on account of a lower C abundance resulting from the first dredge-up. If C has been reduced by about 50%, and K is not depleted onto grains in the wind, the expected elemental ratio in the wind is 1350. The higher ratio in the S2 shell implies, as expected, that K is largely ionized: the fraction of neutral K atoms is provided that most of the C is in CO. Huggins et al.’s (1994) prediction of ionization of C and association into CO through the shell suggests CO accounts for about 20 % of the carbon. Then, 0.003. Rodgers & Glassgold (1991) ‘standard’ model predicts at the radial distance equivalent to 50 arcsec at = 140 pc. This is fair agreement with observation given the various (uncertain) ingredients that enter into both estimates. The mass in the shell amounts to about 10-2 M⊙, at a distance of 140 pc and assuming .
As noted above the S2 shell is not a consequence of a varying photospheric illumination; the light travel time across the shell is only about a day, and the shell is only about 50 light days from the star. In addition, the shell seen in absorption in the 1970s (Goldberg et al. 1975; Bernat et al. 1979) is plausibly identified with the K i emission shell seen in 1994. The simplest explanation for the shell may be that it is mass ejected at a substantially higher than average rate at an earlier time. If the expansion velocity has been constant, gas travelling at 18 km s-1 and now at 50 arcsec from the star was ejected 1900 years ago ( = 140 pc is assumed). A shell thickness of 1 second of arc implies ejection lasted about 40 yr but this is a guess because the velocity of ejection presumably varied too. The shell as it appears in Fig. 4 is not uniformly bright. It is unlikely that the observed contrast around the shell is due to the presence of bright spot on the disk at the time of the observations. A possible explanation is that mass ejection occurred preferentially above a spot 1900 years ago. Stellar rotation (the rotation period of Betelgeuse is at least a few years), could have led to material being ejected into the shell at a variable rate over the lifetime of the spot. There appear to be at least two other shells of moderate completeness which suggests that significant increases in mass loss may occur every several hundred years. Multiple shells were also detected around Cep by Mauron (1997), with a characteristic time scale between two successive increases in mass loss of about one thousand years. Detached shells are also observed around AGB stars, where they are attributed to a Helium shell flash that induces both a mass loss increase and a two-wind interaction due to the increased outflow velocity (Steffen and Schönberner 2000). Clearly, an alternative mechanism must be operating in supergiant stars like Betelgeuse.
Future observations of the K i emission from the shell should be made to search for changes in the S2 shell. Measuring the S2’s expansion will be a challenge: the proper motion expected is a mere 0.03 arcsec per year.
3.2.3 Clumps
A striking feature of our velocity-position maps, especially those acquired in the best seeing is the appearance of clumps or knots of emission; Fig. 3, 6 and 7 show clumps extending in size down to the velocity and spatial resolution of the map. There are locations where clumps appear connected suggesting they are condensations in a sheet or shell. In general, the collection of clumps in many velocity-position maps accounts for more than half of the emitted flux. The impression of elliptical structures is largely gained from gas at large angular distances from the star. Many of our exposures, especially those taken with small impact parameters, were too short to reveal faint distant structures.
These are the first observations of such clumps in Betelgeuse’s wind. Mauron (1997) from long-slit spectra showing K i emission from Cephei reports ‘inhomogeneities’ with an apparent size of 1′′ to 3′′ when the angular resolution was about 0.6′′. In velocity space, Cep’s clumps were unresolved at the moderate resolution of 40 km s-1 of these observations. Since Cep is about 5 times more distant than Betelgeuse, its smallest clumps would appear to be 5 to 10 larger than those we have detected.
There is a hint that the prevalence of clumps is higher close to the star than at the largest distances probed by our spectra. This encourages the speculation that the clumps’ origin may be traceable through the inhomogeneous inner shell (Lim et al. 1998) and chromosphere to the stellar surface. The greater visibility of shells at large distances may be due to the dissolution and merger of clumps at a common distance. Although clumps are seen by fluorescent emission, their shape and size are attributable to an enhanced concentration of potassium atoms in the wind and not to intensity variations over the surface of the illuminating photosphere; a bright photospheric spot will enhance fluorescence over approximately 2 of solid angle not a mere few arcsec. The clumps are probably not regions of reduced ionization of potassium atoms because the characteristic timescale for photoionization is shorter that the expansion timescale (the time required to reach a given angular distance at a constant expansion velocity): it is a factor of 100 faster close to the star and about a factor of 10 at 50 arcsec from the star.
Supposing the clumps represent coherent structures related to the process of mass loss, a change of clump characteristics with radial distance provides information about the clumps’ internal structure. Consider a clump moving radially outwards at velocity with an internal velocity dispersion . Its radial size increases linearly with radial distance out from the star , i.e., / = . Identifying with the sound speed, we estimate = 1 km s-1. Since km s-1, a clump of about 2 arcsec at 10 arcsec from the star would expand to about 5 arcsec at a radial distance of 50 arcsec. In the inner shell, the inter-clump distances are a few arcsec. Then, if dispersion of the clump perpendicular to the radial flow occurs at about 1 km s-1, the clumps at a common distance may well merge after a few tens of arcsec.
Our observations are consistent with this result in that the maximum velocity extent of a velocity-position map is not greatly different for small and large impact parameters.
4 Concluding Remarks
Our study of the K i emission from Betelgeuse’s circumstellar shell reveals new aspects of the shell and its potassium atoms. Spherical symmetry is no more than a rough approximation to the distribution of potassium atoms but the radial distribution of the brightness closely follows the predictions for a model proposed by Rodgers & Glassgold (1991) implying a mass loss rate of about 2 y-1. But the striking result of our study is the presence of clumps of potassium atoms with the smallest clumps being unresolved spatially and kinematically. The clumps likely originate from cool structures close to the star. Observations suggest that they disappear at large distances from the star.
Observations at a site of excellent seeing are to be sought in order to trace the clumps back closer to the star. Other supergiants and giants are observable in both Na D and K i emission, as published reports demonstrate, but the occurrence of clumps in the winds from such stars is as yet unknown. To explore the innermost regions of these shells will require the spatial resolution of a space, or a diffraction limited ground-based telescope. Betelgeuse’s chromosphere has already been explored in the ultraviolet continuum and the Mg ii h and k lines (Uitenbroek, Dupree, & Gilliland 1998). Extension of this work to other lines, and other stars would be rewarding.
Acknowledgements.
We thank N. Mauron and E. Josselin for inspiring discussions of the Betelgeuse shell.References
- (1) Bernat, A.P. 1976, Ph.D. thesis, University of Texas at Austin
- (2) Bernat, A.P. 1977, ApJ, 213, 756
- (3) Bernat, A.P., Hall, D.N.B., Hinkle, K.H., & Ridgway, S.T. 1979, ApJ, 235, L135
- (4) Bernat, A.P., Honeycutt, R.K., Kephart, J.E., Gow, C.E., Sandford, II, M.T., & Lambert, D.L. 1978, ApJ, 219, 532
- (5) Bernat, A.P., & Lambert, D.L. 1975, ApJ, 201, L153
- (6) Bernat, A.P., & Lambert, D.L. 1976, ApJ, 210, 395
- (7) Bester, M., Danchi, W.C., Hale, D., Townes, C.H., Degiacomi, C.G., Mékarnia, D., & Geballe, T.R. 1996, ApJ, 463, 336
- (8) Bowers, P.F., & Knapp. G.R. 1987, ApJ, 315, 305
- (9) Buscher, D.F., Haniff, c.A., Baldwin, J.E., & Warner, P.J. 1990, MNRAS, 245, 7
- (10) Danchi, W.C., Bester, M., Degiacomi, C.G., Greenhill, L.J., & Townes, C.H. 1994, AJ, 107, 1469
- (11) Deutsch, A.J. 1956, ApJ, 123, 310
- (12) Dyck, H.M., van Belle, G.T., & Thomson, R.R. 1998, AJ 116, 981
- (13) Freytag, B. 2002, in Cool Stars, Stellar Systems, and the Sun, 12th Cambridge Workshop, in press.
- (14) Gilliland, R.L., & Dupree, A.K. 1996, ApJ, 463, L29
- (15) Glassgold, A.E., & Huggins, P.J. 1986, ApJ 306, 605
- (16) Goldberg, L., Ramsey, L., Testerman, L., & Carbon, D. 1975, ApJ, 199, 427
- (17) Gray, D.F. 2000, ApJ, 532, 487
- (18) Gustafsson, B., Eriksson, K., Kiselman, D., Olander, N., & Olofsson, H. 1997, A&A, 318, 52
- (19) Harper, G.M., Brown, A., & Lim, J. 2001, ApJ, 551, 1073
- (20) Honeycutt,R.K., Bernat, A.P., Kephart, J.E., Gow, C.E., Sandford, II, M.T., & Lambert, D.L. 1980, ApJ, 239, 565
- (21) Huggins, P.J. 1987, ApJ, 313, 400
- (22) Huggins, P.J., Bachiller, R., Cox, P., & Forveille, T. 1994, ApJ, 424, L127
- (23) Jura, M., & Jacoby, G.H. 1976, Ap Lett, 18, 5
- (24) Justtanont, K., Tielens, A.G.G.M., de Jong, T., Cami, J., Waters, L.B.F.M., & Yamamura, I. 1999, A&A, 345, 605
- (25) Le Borgne, J.F., Mauron, N., & Leroy, J.L. 1986, A&A, 168, 211
- (26) Lim, j., Carilli, C.L., White, S.M., Beasley, A., Marson, R.G. 1998, Nature, 392, 575
- (27) Mauron, N. 1990, A&A, 227, 141
- (28) Mauron, N. 1997, A&A, 326, 300
- (29) Mauron, N., & Caux, E. 1992, A&A, 265, 711
- (30) Mauron, N., Fort, B., Querci, F., Dreux, M., Fauconnier, T., & Lamy, P. 1984, A&A, 130, 341
- (31) Mauron, N., & Guilain, Ch. 1995, A&A, 298, 869
- (32) Mauron, N., & Querci, F. 1990, A&AS, 86, 513
- (33) McMillan, R., & Tapia, S. 1978, ApJ, 226, L87
- (34) Noriega-Crespo, A., van Buren, D., Cao, Y., & Dgani, R. 1997, AJ, 114, 837
- (35) Plez, B., & Lambert, D.L. 1994, ApJ, 425, L101
- (36) Rinehart, S.A., Hayward, T.L., & Houck, J.R. 1998, ApJ, 503, 415
- (37) Rodgers, B., & Glassgold, A.E. 1991, ApJ, 382, 606
- (38) Schwarzschild, M. 1975, ApJ, 195, 137
- (39) Sloan, G.C., Grasdalen. G.L., & LeVan, P.D. 1993, ApJ, 404, 328
- (40) Steffen, M., & Schönberner, D. 2000, A&A, 357, 180
- (41) Stencel, R.E., Pesce, J.E., & Hagen, W. 1988, AJ, 95, 141
- (42) Sudol, J.J., Dyck, H.M., Stencel, R.E., Klebe, D.I., & Creech-Eakman, M.J. 1999, AJ, 117, 1609
- (43) Uitenbroek, H., Dupree, A.K., & Gilliland, R.L. 1998, AJ, 116, 2501
- (44) Wilson, R.W., Dhillon, V.S., & Haniff, C.A. 1997, MNRAS, 291, 819
- (45) Young, J.S., Baldwin, J.E., Boysen, R.C., Haniff, C.A., Lawson, P.R., Mackay, C.D., Pearson, D., Rogers, J., St.-Jacques, D., Warner, P.J., Wilson, D.M.A., & Wilson, R.W. 2000, MNRAS, 315, 635
- (46) Young, K., Phillips, T.G., Knapp, G.R. 1993a, ApJS, 86, 517
- (47) Young, K., Phillips, T.G., Knapp, G.R. 1993b, ApJ, 409, 725
- (48) Weymann, R. 1962, ApJ, 136, 844