MASS AND LIGHT IN THE UNIVERSE11affiliation: This article is based on the third (Wilson, Kaiser, & Luppino, 2001, Ap.J., 556, 601) in a series of papers describing results from an ongoing project whose principle aim is to investigate the cosmic shear pattern caused by gravitational lensing from the large-scale structure of the Universe.
Abstract
We present a weak lensing and photometric study of six fields observed at the 3.6m CFHT telescope using the pixel UH8K CCD mosaic camera. The six fields were chosen to be “blank fields” i.e. representative views of the Universe. The fields were observed for a total of 2 hours each in and , resulting in catalogs containing , galaxies per passband per field. We used color and magnitude to select bright early type galaxies at redshifts . We measured the gravitational shear from faint galaxies in the range from a composite catalog and found a strong correlation with that predicted from the early types if they trace the mass with for a flat () lambda cosmology and for Einstein-de Sitter. We made two-dimensional reconstructions of the mass surface density. Cross-correlation of the measured mass surface density with that predicted from the early type galaxy distribution showed a strong peak at zero lag (significant at the level). We azimuthally averaged the cross- and auto-correlation functions. We concluded that the profiles were consistent with early type galaxies tracing mass on scales of ( at ). We sub-divided our bright early type galaxies by redshift and obtained similar conclusions. These ratios imply ( for Einstein-de Sitter) of closure density.
1 Mass Surface Density Predictions from Luminous Matter and from Lensing
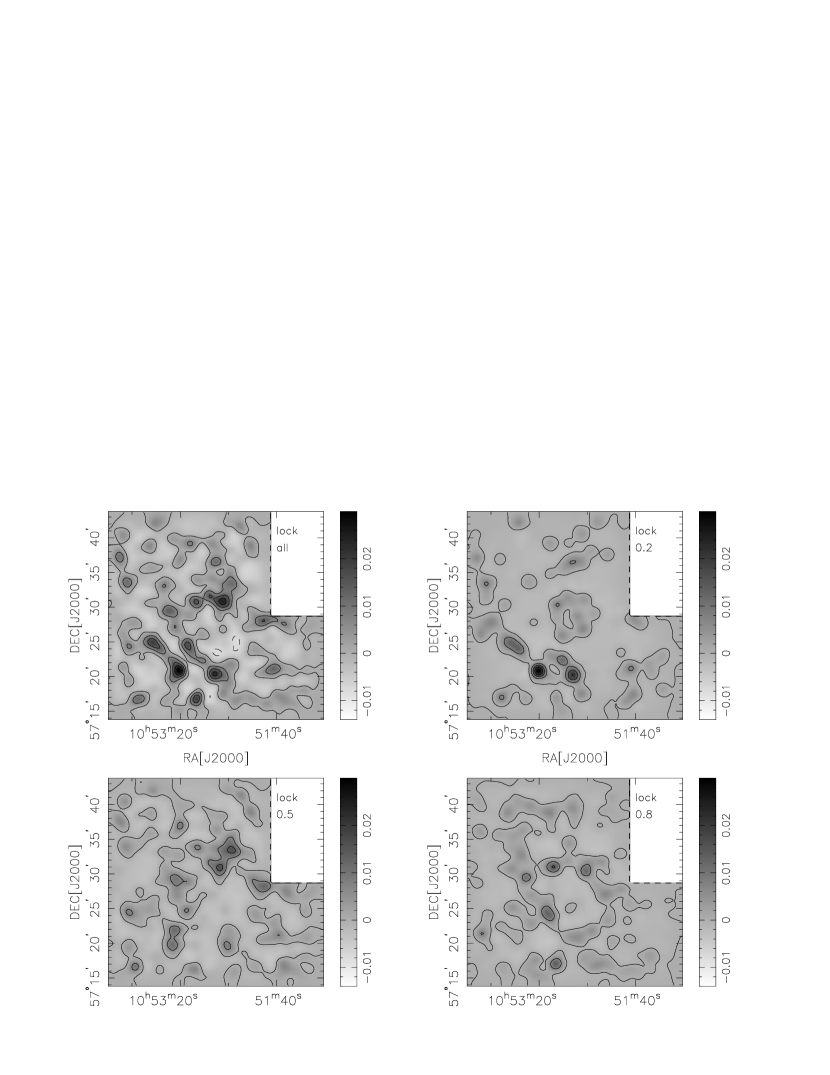
Our analysis differed from other approaches in that we used color and magnitude to reliably select bright early type galaxies at redshifts . We generated predictions of the dimensional mass surface density (where , the physical mass per unit area in units of the critical surface density) from -band galaxy luminosity, assuming a constant . The implicit assumption is that optical early type galaxy luminosity is an unbiased tracer of the mass. We adopted a redshift distribution for the faint source galaxies (needed to calculate ) based on spectroscopic redshifts from Len Cowie’s (ongoing) Hawaii galaxy survey. The upper left panel of Fig. 1 shows the resulting surface mass density -from-light “map” for one of the six fields.
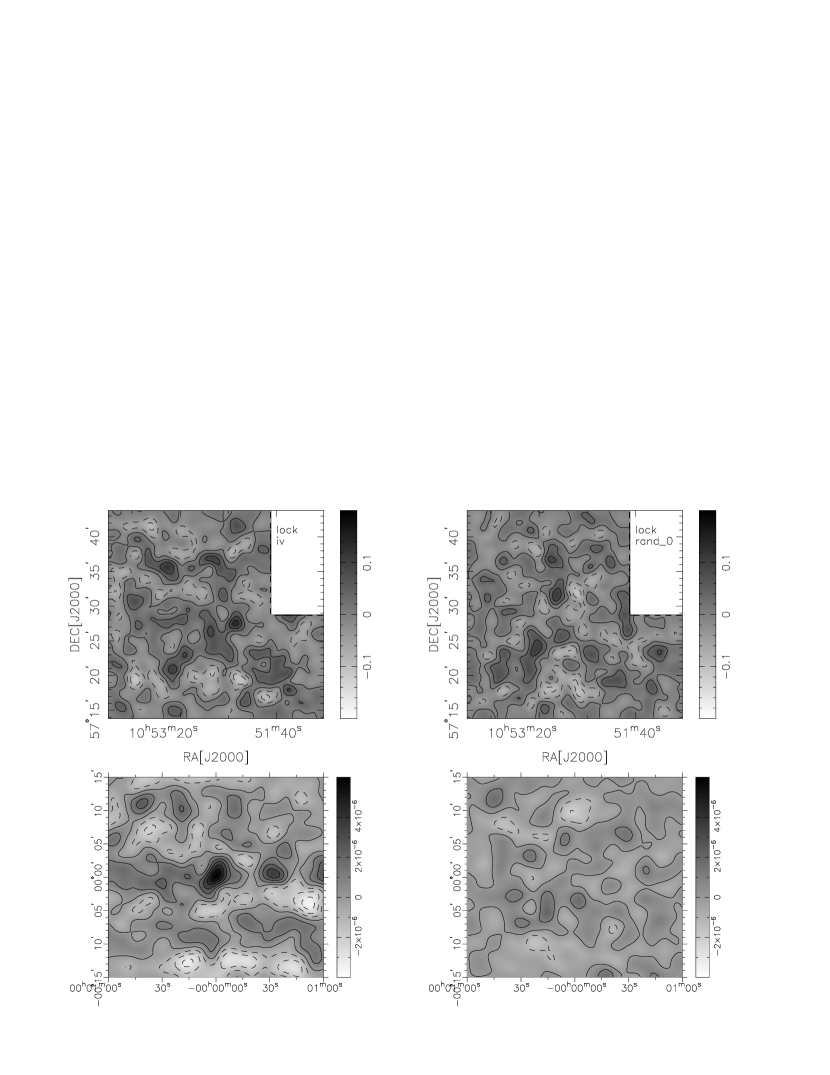
The cross-correlation of light (Fig. 1 upper left) with mass reconstruction (This Fig. upper left) averaged over all six pointings is shown in the lower left panel. The peak at zero lag is significant at the level. The lower right panel shows the lack of correlation, as expected, when the randomized catalog reconstruction (This Fig. upper right) is used instead.
From galaxy shear estimates we also constructed 2D mass surface density reconstructions directly. The upper left panel of Fig. 2 shows the surface density map inferred from lensing for the same field. For comparison, the upper right panel shows the typical (high) level of noise.
In view of the difficulty of measuring mass directly from the maps, and since we have a large area containing many structures, we attempted to better reveal the signal by cross-correlating light and mass. We therefore cross-correlated the luminosity associated with foreground galaxies with the mass inferred from the background galaxy shear estimates. Our aim was firstly to test the hypothesis of a constant mass-to-light ratio which is independent of scale, and also to determine the value of , the constant of proportionality between mass and light.
2 Mass-Light Cross-Correlation, Inferred Mass Density , and Conclusions
Cross-correlation of the measured mass surface density with that predicted from the early type galaxy distribution showed a strong peak at zero lag (significant at the level) as shown in the lower left panel of Fig. 2. That early type galaxy luminosity and total mass show such a strong correlation is our central result. The correlation strength at zero lag implies a for a flat () lambda cosmology and for Einstein-de Sitter.
In order to determine if ratio varies with scale, we then azimuthally averaged the cross- and auto-correlation functions. The cross- and auto- correlation functions had very similar profiles. We concluded that the profiles are consistent with early type galaxies tracing mass on scales of ( at ). We sub-divided our bright early type galaxies by redshift (same as Fig. 1) and obtained similar conclusions.
We then calculated using and where is the measured -band luminosity density of the universe for early type galaxies. We concluded that ( for Einstein-de Sitter) of closure density.
The global density parameter we obtain appears low compared to other estimates. This is not because our early type value is low but because we do not assign the same to late types as to early types. In the scenario we propose, late types are assumed to have very similar luminosities to early types. The difference is that late types have much less mass associated with them and hence their ratio is much lower. The analysis in this paper assumes that they have negligible compared to early types.
In summary, we found that the majority of mass in the Universe is associated with early type galaxies. On scales of (the smoothing scale at ) it appears that their light traces the underlying mass distribution with a constant , depending on cosmology. As with several other recent results our data argues against an universe.