11email: giovanni.carraro@unipd.it
A photometric study of the two poorly known northern open clusters NGC 133 and NGC 1348††thanks: Based on observations carried out at Mt Ekar, Asiago, Italy,††thanks: Photometry is only available in electronic form at the CDS via anonymous ftp to cdsarc.u-strasbg.fr (130.79.128.5 or via http://cdsweb.u-strasbg.fr/cgi-bin/qcat?J/A+A//
We present CCD UBVI observations obtained in the field of the previously unstudied northern open clusters NGC 133 and NGC 1348. We argue that NGC 133 is a heavily contaminated cluster, for which we identify 13 candidate members down to =14.50 mag on the basis of the position in the two-color Diagram . Membership has been checked against proper motions from Tycho 2, whenever available. The cluster turns out to have a reddening E mag, to be pc distant from the Sun, and to have an age less than 10 Myrs. NGC 1348 is a more reddened clusters (E mag) for which we isolate 20 members. The cluster lies at a distance of kpc away from the Sun, and has an age greater than 50 Myrs.
Key Words.:
open clusters and associations:individual : NGC 133 and NGC 1348 - open clusters and associations : general1 Introduction
In this paper we present photometry of two
northern open clusters, namely NGC 133 and NGC 1348,
for which we provide the first CCD study.
Both the clusters appear as weak concentrations
of a small group of bright stars well mixed with
the rich Galactic disk field star population toward
their direction.
This fact renders it difficult to study these objects,
and it is the main reason for which they have been
almost neglected up to now.
NGC 1348 has in fact never studied.
On the other hand, NGC 133
(OCL 296, Lund 17, C0028+60, Trumpler class IV 1p:b)
seems to be an asterism of 5 bright stars.
Evidence has been brought forth by
an early photographic study by Jasevicius (1964, 1970)
that this is not a cluster, but simply a random concentration
of a few bright stars.
In this study we would like to address the issue
of the real nature of these two clusters by means
of deep CCD multicolor photometry, and proper motion
data from Tycho 2 catalog.
This study is part of a long term project aimed
at providing accurate CCD photometry for
northern star clusters at the Asiago Astrophysical
Observatory (Carraro 2002, and references therein).
The plan of this paper is as follows.
In Sect. 2 we briefly present the observations and data reduction.
Sects. 3 to 4 illustrate our results for
NGC 133 and NGC 1348, respectively.
Finally, Sect. 5 draws some conclusions and suggests further lines
of research.
2 Observations and Data Reduction
| Name | ||||
|---|---|---|---|---|
| o : ′ : ′′ | o | o | ||
| NGC 133 | 00:31:12 | +63:22:00 | 120.67 | +0.58 |
| NGC 1348 | 03:34:10 | +51:24:46 | 146.97 | -3.70 |
Observations were carried out with the AFOSC camera at the 1.82 m Copernico telescope of Cima Ekar (Asiago, Italy), in the photometric night of December 18, 2001. AFOSC samples a field in a thinned CCD. The typical seeing was around 2.0 arcsec.
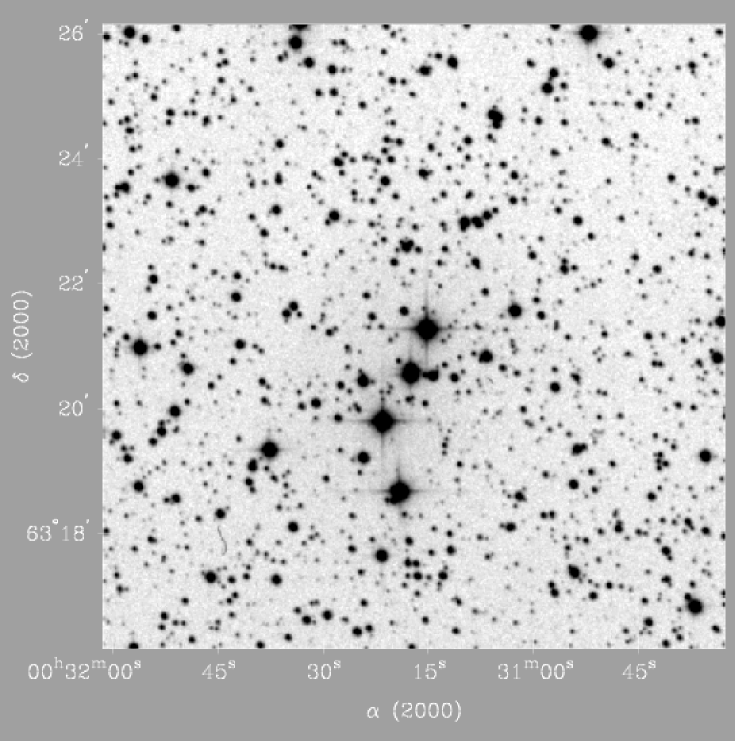
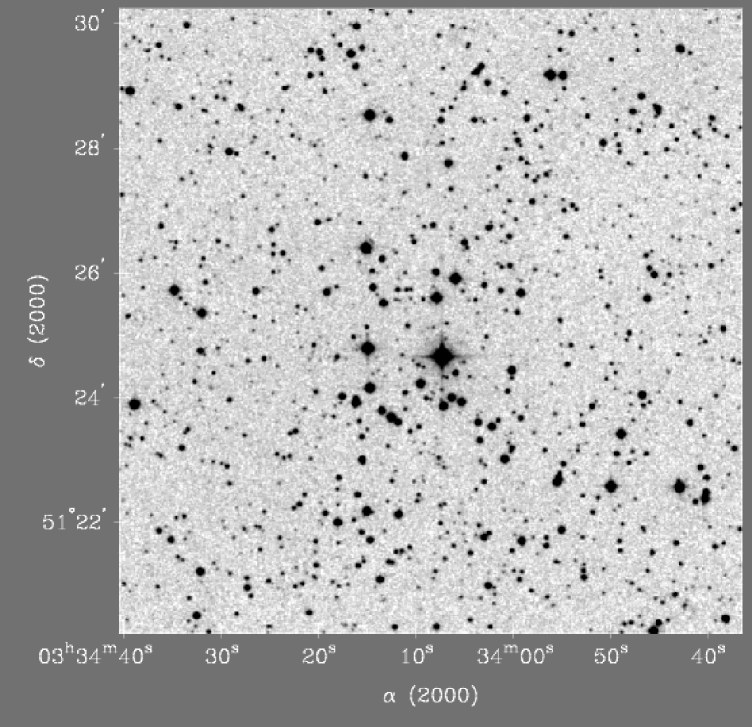
The basic data of the studied objects are summarized in Table 1, whereas the details of the observations are listed in Table 2, where the observed fields are reported together with the exposure times, the typical seeing and the airmass. The covered regions are shown in Figs. 1 and 8, where two XDSS111Second generation Digital Sky Survey, http://cadcwww.dao.nrc.ca/cadcbin/getdss maps are presented for NGC 133 and NGC 1348, respectively. The data has been reduced by using the IRAF222IRAF is distributed by the National Optical Astronomy Observatories, which are operated by the Association of Universities for Research in Astronomy, Inc., under cooperative agreement with the National Science Foundation. packages CCDRED, DAOPHOT, and PHOTCAL. The calibration equations obtained by observing Landolt(1992) SA 93, PG 1047+003, PG 2331+055 and PG 0231+051 fields along the night, are:
where are standard magnitudes, are the instrumental ones, and is the airmass. The standard stars in these fields provide a very good color coverage. For the extinction coefficients, we assumed the typical values for the Asiago Observatory (Desidera et al. 2001). Photometric global errors have been estimated following Patat & Carraro (2001). For the filter, they amount at 0.03, 0.05 and 0.07 at 12.0, 16.0 and 20.0, respectively.
| Field | Filter | Time integration | Seeing | Airmass |
|---|---|---|---|---|
| (sec) | () | |||
| SA 93 | ||||
| 120 | 1.9 | 1.307 | ||
| 60,60 | 2.0 | 1.314 | ||
| 30,30,30 | 2.0 | 1.316 | ||
| 30,30 | 2.0 | 1.319 | ||
| NGC 133 | ||||
| 60 | 2.2 | 1.065 | ||
| 5,10,30 | 2.1 | 1.068 | ||
| 3,10.30 | 2.3 | 1.061 | ||
| 3,10 | 2.3 | 1.067 | ||
| PG 1047+003 | ||||
| 120 | 1.9 | 1.245 | ||
| 60,60 | 2.0 | 1.240 | ||
| 30,30 | 2.0 | 1.250 | ||
| 30,30 | 2.0 | 1.238 | ||
| PG 0231+051 | ||||
| 120 | 1.9 | 1.199 | ||
| 60,60 | 2.0 | 1.239 | ||
| 30,30 | 2.0 | 1.260 | ||
| 30,30 | 2.0 | 1.267 | ||
| PG 2331+055 | ||||
| 120 | 1.9 | 1.109 | ||
| 60,60 | 2.0 | 1.108 | ||
| 30,30 | 2.0 | 1.107 | ||
| 30,30 | 2.1 | 1.107 | ||
| NGC 1348 | ||||
| 180 | 1.8 | 1.028 | ||
| 30,60 | 1.7 | 1.031 | ||
| 15,30 | 1.8 | 1.040 | ||
| 15,30 | 1.8 | 1.030 |
3 NGC 133
NGC 133 is identified by a group of 5 bright stars in a very rich stellar field (see Fig. 1). One of these stars is the binary system BD+6293 (ADS 423A,B), whose component is of spectral type. It is located very low in the Galactic plane, and therefore presumably suffers from severe field star contamination. This cluster was never studied before, but for a photographic survey carried out by Jasevicius (1964,1970). This study however does not report estimates of the cluster fundamental parameters, but the author suggests that there is no cluster in the direction of NGC 133.

3.1 Star counts
According to Lyngå (1987), NGC 133 has a diameter of 7 arcmin, so our study covers the entire cluster region. To infer an estimate of the radius, we derive the surface stellar density by performing star counts in concentric rings around the center of the covered area, and then dividing by their respective surfaces. The final density profile and the corresponding Poisson error bars are depicted in Fig. 2. In the lower panel we take into account all the measured stars, whereas in the upper panel we only consider stars brighter than V = 14. By inspecting the lower panel, one can readily see that the profile decreases smoothly, and the cluster does not appear as a clear concentration. This is probably due to the heavy contamination by faint Galactic field stars. In fact, after selecting only the brightest stars, the cluster emerges more clearly (see upper panel). We estimate a cluster radius of about 2-2.5 arcmin, somewhat lower than the value reported by Lyngå (1987).
| ID | TYC 4019- | Name | [mas/yr] | [mas/yr] | E | ||||||
|---|---|---|---|---|---|---|---|---|---|---|---|
| 1 | 2122 | HIP-2466 | 00:31:14.9 | +63:21:16.9 | 9.501 | 0.339 | -0.083 | 0.494 | 0.02.8 | -0.92.7 | 0.498 |
| 4 | 1038 | BD+6293 | 00:31:17.7 | +63:20:33.0 | 10.837 | 0.404 | 0.332 | 0.456 | -3.13.9 | -2.83.9 | 0.499 |
| 6 | 1038 | BD+6293 | 00:31:17.5 | +63:20:38.8 | 11.572 | 0.426 | 0.405 | 0.530 | 2.23.7 | -1.53.7 | 0.502 |
| 7 | 2326 | 00:31:50.0 | +63:23:54.1 | 12.112 | 0.323 | 0.508 | 1.527 | -7.45.1 | -1.25.3 | 0.540 | |
| 8 | 00:31:02.2 | +63:21:23.9 | 12.444 | 0.568 | 0.493 | 0.968 | 0.548 | ||||
| 10 | 00:31:24.7 | +63:30:27.4 | 12.913 | 0.542 | 0.307 | 0.695 | 0.579 | ||||
| 13 | 00:31:07.2 | +63:20:45.8 | 13.076 | 0.727 | 0.547 | 1.022 | 0.707 | ||||
| 15 | 00:31:49.5 | +63:20:51.9 | 13.343 | 0.485 | -0.005 | 0.782 | 0.614 | ||||
| 20 | 00:31:17.6 | +63:22:33.4 | 14.076 | 0.640 | 0.034 | 1.224 | 0.703 |
3.2 Proper motions
Important information on the kinematics of the luminous stars in and around NGC 133 can be derived from the proper motions available in the Tycho-2 catalogue. The Tycho-2 proper motions are based on the comparison between contemporary mean positions derived from the recent Tycho observations on-board Hipparcos and early-epoch positions observed many decades ago (see Høg et al. 2000 and references therein). Due to the long time-baseline they have rather high precision and therefore directly indicate the long-term mean tangential motions of the stars. We have collected proper motion components for 16 stars in a field of centered in NGC 133. They are shown in the vector point diagram in Fig. 3 together with the errors reported in the Tycho 2 catalog. From this sample we have extracted 8 stars, which seem to crowd in the vector point diagram. By assuming that these stars are likely members, we derive the common mean motion (which we shall assume as the cluster mean motion):
The errors reported in the Tycho 2 catalog amount at more than 2.5 mas/yr, and therefore we conclude that these 8 stars most probably share a common tangential motion since their components deviate less that 1 from the derived mean motion. Therefore in the direction of the object NGC 133 a star cluster seems to be present.


3.3 Color-Magnitude Diagrams
The Color-Magnitude Diagrams (CMDs) for all the stars measured in the direction of NGC 133 are shown in Fig. 4. In panel a) we plot all the stars in the vs plane, where in panel b) the same stars are plotted in the vs plane. For comparison, the photographic CMD by Jasevicius (1964) is presented panel in c). The comparison - in the sense (this study-Jasevicius) - yields:
for 29 common stars.
Clearly, the present study supersedes that of Jasevicius (1964).
The CMDs are not easy to interpret, since most of the stars
are just Galactic disk field stars. This is corroborated
by the CMD in panel d), where a simulation is
presented of the Galactic disk component toward NGC 133.
The simulation has been performed using the TRILEGAL
code (Girardi et al 2002), as calibrated by Groenewegen
et al (2002).
Also from this figure is evident that NGC 133 is a small
group of stars brighter than
above the mean stellar background.


3.4 Two-color diagram and members selection
We derive cluster membership by grouping stars according
to their mean reddening. Individual reddenings have been
computing by means of the usual reddening free parameter
, following the procedure outlined in detail
in Patat & Carraro (2001).
The results are shown in Figs. 5 and 6.
In Fig. 5 we plot all the stars having photometry
in the two-color diagram. The solid line is an empirical
ZAMS from Schmidt-Kaler (1982).
There seem to be two pupulations. One having a mean
reddening E mag, which crowds
close to a ZAMS shifted by E mag (dashed line), and another
one with a much larger reddening. We consider
this latter population as the Galactic disk component,
made of stars placed at different distances, and
with a different amount of absorption. To guide the eye
we have drawn another ZAMS (dotted line) shifted by
E mag. The same conclusion can be drawn by inspecting
Fig. 6, where we show the reddening distribution.
This has a clear peak at E mag, but at the same time
exhibits an hint for a secondary peak at E mag.
However, the statistical significance of this secondary peak is
quite low, and has to be taken as no more than an indication.
An additional confirmation derives from Schlegel et al. (1998)
extinction maps, which in the direction of NGC 133
give mag. By assuming a standard value
of the total to selective absorption ratio , the reddening
toward NGC 133 becomes E mag,
in close agreement with our results.
In conclusion, we would like to argue that the population
of stars having E mag (about 20 stars)
identify the open cluster NGC 133.
Now, we need to compare these findings with the proper motion
data, to check for consistency.
Out of 16 stars which have Tycho 2 proper motions,
we were able to secure photometry
only for 5 (see Table 3). In this Table, we list likely members
derived from the analysis of the two-color diagram brighter than .
The 4 stars with proper motion compatible with the
mean turn out to be also photometric members (see the last entry in
the table reporting the reddening), whereas
the star (Tycho 4019-744), which has
mas/yr, mas/yrs, turns out to
have E, which makes it both a photometric and an astrometric
non-member. This result makes us confindent when using photometrically
selected cluster members.
It is however worth noting that these results have to be confirmed
by extending proper motion measurements to dimmer
magnitudes, and by providing radial velocities of the brightest
stars.
3.5 Hints for NGC 133 distance and age
In Fig. 7 we plot the reddening corrected CMDs for the likely
members stars. In both diagram we have over-imposed the empirical
Schmidt-Kaler (1982) ZAMS, shifted by mag,
which provides a nice fit of the stars distribution.
This implies that NGC 133 is located pc away from the Sun,
where the uncertainty mirrors the difficulty of the fit
due to the almost vertical structure of the MS.
From the location of the stars in the vs plane, we infer that the stars spectral types ranges from to by deriving the absolute colors from the ZAMS at the same position of the stars. This result agrees with the spectral type reported for ADS 423A ( in the present numbering). If the stars having spectral type are still along the MS, we derive an upper limit of 10 Myrs for the age of NGC 133 (Girardi et al. 2000).
4 NGC 1348
This cluster was never studied before. According to Lyngå (1987) it has a diameter of 5′, and the spectral type of the brightest stars is . The region we covered is shown in Fig. 8. NGC 1348 is identified by a weak over-density of stars in a rich stellar field. Unfortunately, proper motions are not available for all the stars in the region of NGC 1348, so we must rely only on photometry to derive cluster members and cluster fundamental parameters.

4.1 Star counts
We performed star counts in concentric rings around the brightest star (1, Tycho 3325-48) in the field, assumed as the cluster center. The number density profile is shown in Fig. 9. The profile decreases gently up to the limit of the covered region, and therefore we suspect that the Lyngå estimate has to be taken as a lower limit of NGC 1348 diameter, which would be at least 10′. Anyway, NGC 1348 appears as a real concentration.

4.2 Color-Magnitude Diagram
The CMDs for all the stars measured in the direction of NGC 1348 is shown in Fig. 10. In the left panel we plot all the stars in the vs plane, where in the middle panel the same stars are plotted in the vs plane. The CMDs are not easy to interpret, since most of the stars are just Galactic disk field stars. This is confirmed by the CMD in the right panel, where a simulation is presented of the Galactic disk component toward NGC 1348. The simulation has been performed using the TRILEGAL code (Girardi et al 2002), as calibrated by Groenewegen et al (2002). From this figure it is evident that NGC 1348 emerges as an overdensity of stars brighter than above the mean stellar background.
4.3 Two-color Diagram and member selection
We follow the same method adopted above for NGC 133 to
derive individual reddenings and membership to the cluster.
The results are shown in Figs. 11 and 12.
In Fig. 11 we plot all the stars having photometry
in the two-color diagram. The solid line is an empirical
ZAMS from Schimdt-Kaler (1982).
There seems to be two populations. One having a mean
reddening E mag, which lies
close to a ZAMS shifted by E mag (dashed line), and another
one with much larger reddening. We consider
this latter population as the Galactic disk component,
made of stars located at different distances, and
with a different amount of absorption. To guide the eye
we have drawn another ZAMS (dotted line) shifted by
E mag. The same conclusion can be drawn by inspecting
Fig. 12, where we show the reddening distribution.
This has a clear peak at E mag, and several
smaller peaks at larger values of the reddening.
We identify NGC 1348 with the group of stars having reddening E mag (about 20 stars).


4.4 Hints for NGC 1348 distance and age
In Fig. 13 we plot the reddening corrected CMDs for the likely
members stars above derived.
In both diagrams we have over-imposed the empirical
Schmidt-Kaler (1982) ZAMS, shifted by mag,
which provides a nice fit to the stellar distribution.
This implies that NGC 1348 is located kpc away from the Sun,
where the uncertainty mirrors the difficulty of the fit
due to the almost vertical structure of the MS.
From the location of the stars in the vs plane, we infer that the stars spectral types ranges from to by deriving the absolute colors from the ZAMS at the same position of the stars. Moreover by inspecting Fig 13, one can readily see that the brighter stars are actually leaving the MS, whereas the stars at - with spectral types in the range - are much probably still on the MS. Therefore we derive a lower limit of 50 Myrs for the age of NGC 1348 (Girardi et al. 2000).

5 Conclusions
We have presented the first multicolor CCD study of
the two poorly known northern open clusters NGC 133 and NGC 1348.
In the case of NGC 1348, no investigation had been carried
out insofar.
Our analysis shows that these objects are two poorly
populated, highly contaminated
clusters. In details, we find that:
-
•
NGC 133 is a 10-15 stars group located about 600 pc from the Sun. We estimate a reddening and a probable age of less than 10 Myrs;
-
•
NGC 1348 is a 20 stars group with a mean reddening , a distance of almost 2 kpc, and an age greater than 50 Myrs.
The results of this study are hampered by the strong field star contamination. Much better constrains on the nature and basic parameters of these clusters can be obtained by enlarging the number of stars with proper motions measurements, and by obtaining radial velocity and spectral classification of the brightest stars.
Acknowledgements.
I deeply thank dr. Saulius Raudeliunas for providing me with a copy of V. Jasevicius papers. The kind night assistance at Asiago Observatory by Gigi Lessio and Silvano Desidera is warmly acknowledged. It is a real pleasure to thank Leo Girardi for his permission to use the TRILEGAL code in advance of publication. This study made use of Simbad and WEBDA catalogs.References
- (1) Carraro, G. 2002, A&A in press (astro-ph/0201251)
- (2) Desidera, S., Fantinel, & D., Giro, E. 2001, AFOSC USER MANUAL
- (3) Girardi, L., Bressan, A., Bertelli, & G., Chiosi, C., 2000, A&AS 141, 371
- (4) Girardi, L. et al., 2002, in preparation
- (5) Groenewegen, M.A.T., Girardi, L., Hatziminaoglou, E., Benoist, C., et al., 2002, A&A, submitted
- (6) Høg, E., Fabricius, C., Makarov, V.V., et al., 2000, A&A, 355, L27
- (7) Jasevicius, V., 1964, Vilnius Obser. Bulletin 13, 1
- (8) Jasevicius, V., 1970, Vilnius Obser. Bulletin 27, 3
- (9) Landolt, A.U. 1992, AJ 104, 340
- (10) Lyngå, G., 1987, Catalog of Open Star Cluster Data, Strasbourg, CDS
- (11) Patat, F., Carraro, G. 2001, MNRAS 325, 1591
- (12) Schlegel, D.J., Finkbeiner, D.P., & Davis, M., 1998, ApJ 500, 525
- (13) Schmidt-Kaler, Th., 1982, Landolt-Börnstein, Numerical data and Functional Relationships in Science and Technology, New Series, Group VI, Vol. 2(b), K. Schaifers and H.H. Voigt Eds., Springer Verlag, Berlin, p.14