The First Orbital Period for a Dwarf Nova in a Globular Cluster: V101 in M5
Abstract
We report the first orbital period determination for a Dwarf Nova (DN) in a globular cluster: V101 in M5 has a period of 5.796 0.036 hours. We derived this period from I-band photometry acquired with the Calypso Observatory High Resolution Camera operating with tip-tilt adaptive optics correction. Observations from the South African Astronomical Observatory in the V-band were also analyzed and exhibit a periodic signal of the same period. This orbital period suggests that V101 has a secondary of mid to late K spectral type with M 0.5. The predicted spectral type is consistent with previous spectral observations in quiescence which show a fairly red continuum. From the observed minimum brightness of V = 22.5, we derive a distance modulus of = 14.3 0.5 to the DN which supports V101’s membership in the globular cluster M5. Measurement of the ellipsoidality effect indicates that the orbital plane of the V101 system is moderately inclined, but not enough to exhibit eclipses.
1 Introduction
Close binaries in globular clusters contain a significant fraction of the total binding energy of the clusters. This makes them critically important in unraveling the dynamical evolution of their host clusters. In order to place constraints on cluster evolution theory, one must determine the binding energy of the binaries in a cluster, i.e. their orbital periods and component masses. Determining the evolutionary states of cluster binaries is also important, and this also demands component masses and periods. The high stellar densities in the cores of many globular clusters, where most of the close binaries reside, make this an observational challenge. UV and X-ray observations have improved our population census of cluster close binaries (Knigge et al. 2002; Grindlay et al. 2001; Pooley et al. 2002), but without knowing the periods of these new binaries we cannot calculate the binding energy they contain or constrain their evolutionary state.
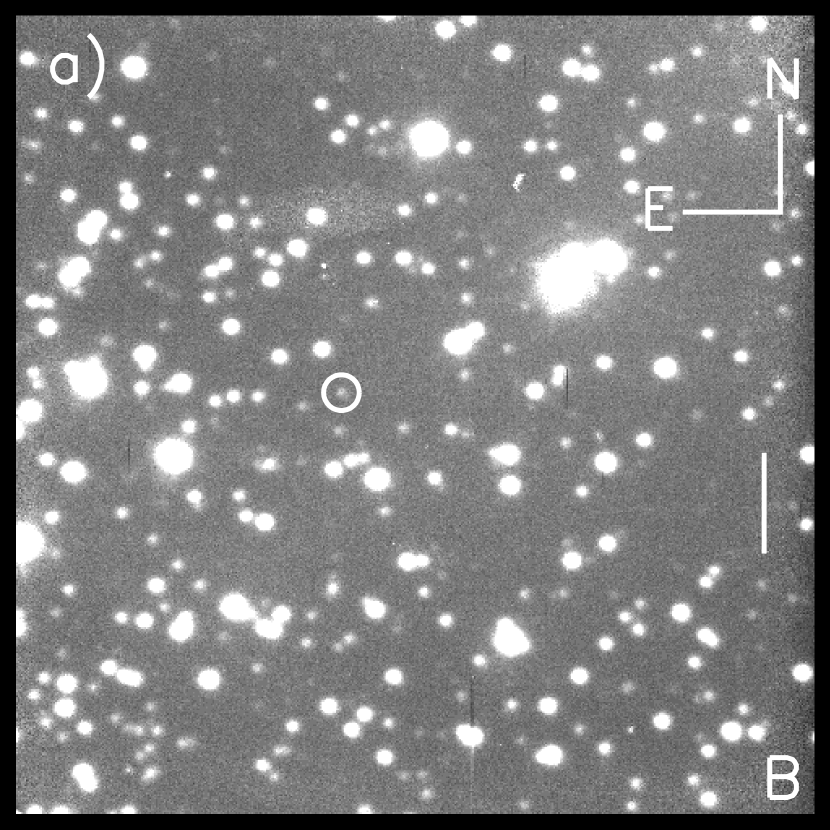
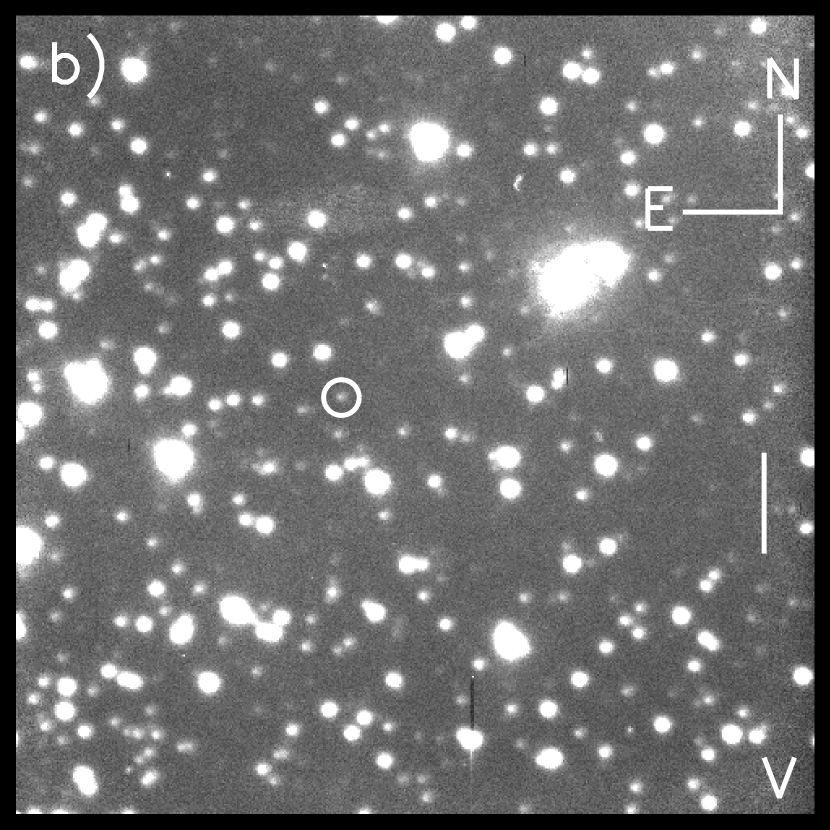
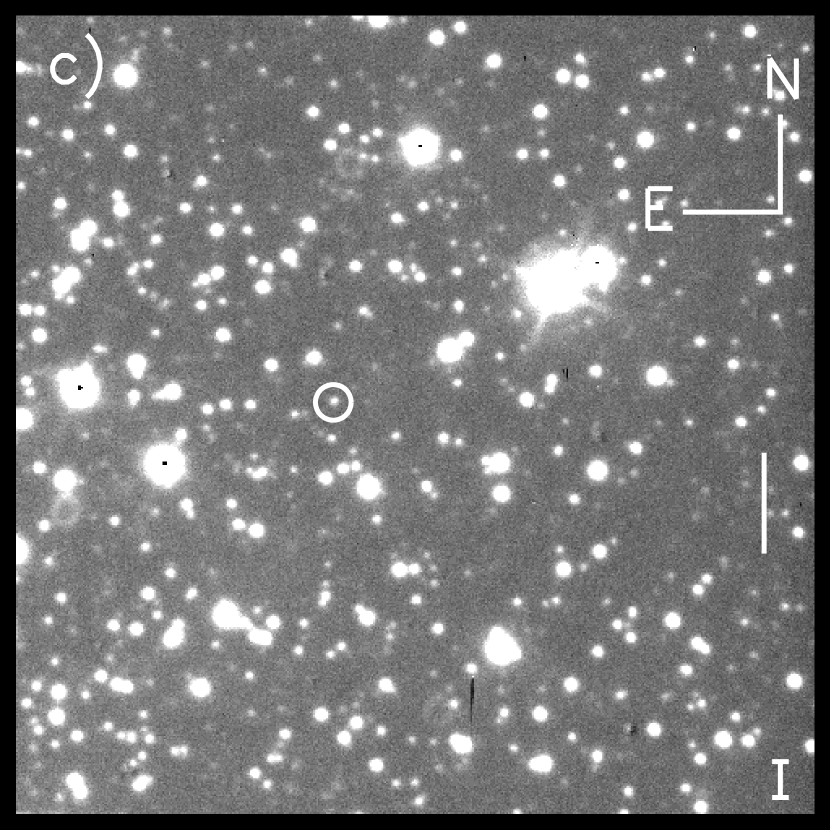
The cataclysmic variable (CV) V101 in the globular cluster M5 has many properties that make it an ideal candidate for period determination. It lies 280” from the center of M5 (10 core radii) and is relatively uncrowded compared to the objects near the core of a globular cluster (see Figure 1c). It is classified as a dwarf nova (DN), a particularly well studied class of CV for which empirical relations exist relating the period to the luminosity, spectral type, and mass of the secondary.
The literature on M5 V101 is not extensive. It was first reported as a possible SS Cyg type variable star by Oosterhoff (1941). He reported seven observations, including two pairs of measurements in outburst separated by 66 days in 1934. Since then Margon, Downes, & Gunn (1981) performed the initial identification of V101 in quiescence and obtained a low resolution spectrum showing strong, broad Balmer and He I emission lines, confirming the identification and the DN classification. Shara, Potter, & Moffat (1987) reported B-band observations in outburst and quiescence and predicted a fairly long orbital period (P 11 hr) based on the minimum observed magnitude (V = 22.5, Kukarkin & Mironov 1970) and the duration and rise and fall time of the outburst. Spectral observations of V101 in outburst were published by Naylor et al. (1989) and showed H- in absorption with a fairly red continuum. They also showed a radial velocity curve covering 1.75 hrs from which they concluded that the orbital period must be longer than twice their sampling interval (P 3.5 hr, see their Figure 2). Shara, Potter, & Moffat (1990) published the highest resolution spectrum to date of V101 in quiescence and noted that the high velocity width of the Balmer lines hinted that the system might be highly inclined and eclipses might be observable.
The possibility of using these eclipses to determine the orbital period for M5 V101 motivated this study. The availability of many nights on the Calypso Observatory 1.2m telescope using the high resolution camera allowed us to achieve the photometric accuracy and time sampling required to determine the orbital period. We now describe the photometric analysis and the method for finding the period and present the physical properties of V101 derived from our observations.
2 Observations
2.1 The Calypso Telescope Observations
Since these are the first scientific results from the Calypso Telescope, we present a brief description of the telescope and camera. A more detailed description will be published elsewhere.
The Calypso Telescope is a 1.2m telescope of Ritchey-Chretien design on a computer controlled altitude-azimuth mounting located on Kitt Peak, Arizona. Two instruments are mounted at the Naysmith foci: a high resolution camera (HRCAM) with tip/tilt adaptive correction and a field of view of 85”, and a non-adaptive camera (WFCAM) with a 10’ field of view. The aperture of the telescope was matched to the atmospheric cell size during the best quartile of seeing at the site allowing the tip/tilt to theoretically correct 87% of the atmospheric distortion on the optical axis. The optical components are figured so that the total wavefront error at the focal plane, including all error budgets, is less than th of a wavelength at 5500Å. The telescope is mounted on a 10.2 meter high pier with an enclosure that rolls completely away, allowing it to operate in the open air. The site is placed so the prevailing winds during the best seeing reach the telescope unhindered by any ground obstruction providing a laminar flow of air over the telescope.
The HRCAM was used for this study of V101. It uses a single Loral 2048 square CCD with 15 pixels. Its native resolution is 0.04” per pixel in order to over-sample the point spread function (PSF) at the best seeing measured at the site of 0.25”. However, the average seeing ranges between 0.6 and 0.8”, as measured in the I-band. Therefore, the CCD was binned 4x4 (giving a pixel size of 0.16”) to better accommodate these atmospheric conditions during the observing campaign. Since the secondary component of V101 was thought to be a late-type main-sequence (M-S) star, we chose the I-band to maximize the chances that ellipsoidal variations would be visible. We used 10 minute exposures back-to-back to allow us to sample the light curve densely enough to detect low amplitude eclipses or ellipsoidal variations. This exposure time gave us a limiting magnitude of I 21.5 under typical conditions. Table 1 presents the log of I-band observations for the Calypso data. Figures 1a - 1c present three finder charts for V101 in the B, V, and I-bands taken with the HRCAM on Calypso.
2.2 South African Astronomical Observatory Observations
Observations taken in 1995 with the TEK4 CCD on the South African Astronomical Observatory (SAAO) 1.9m telescope in the V-band were also analyzed for this study. For five nights, V101 was observed with 15 minute exposures back-to-back over the entire night yielding a limiting magnitude of V 22.7 under typical conditions. Table 1 presents the log of observations for the SAAO V-band data. These observations proved valuable for confirming the orbital period seen in the Calypso data (see below).
3 Reduction and Photometry
All frames were reduced in the standard way to remove instrumental artifacts. In order to minimize the impact of cosmic rays, each image was shifted to a standard reference position and coadded in the following way: first, all images were ordered in time sequence, then a running set of three images was coadded from the beginning to the end of the night incremented by one image at a time. This produced a smoothing of the light curve but kept the time sampling interval at roughly the exposure time of the individual images (plus read time).
The coadded frames were photometered using the APPHOT package in IRAF (Tody, 1986). A set of isolated, well-exposed stars near V101 with low variability ( 0.02 mag) was used to tie all the epochs together onto the same instrumental magnitude system. Calibration was achieved by comparing our instrumental magnitudes with Peter Stetson’s photometry of M5111available at http://cadcwww.dao.nrc.ca/cadcbin/wdb/astrocat/stetson (Stetson, 2000) in the I and V-bands. Due to the small fields of the Calypso and SAAO detectors the calibration was boot strapped to the Stetson standards through intermediate wider-field images taken under photometric conditions. A wide field I-band image of M5 taken with the 8K mosaic camera on the Hiltner 2.4m telescope at the MDM observatory on 01 June 2001 by JDN was used to bootstrap the Calypso photometry. The SAAO photometry was bootstrapped using a V-band image kindly taken for us by Ron Downes with the T1KA camera on the 2.1m telescope at Kitt Peak National Observatory on 28 May 1998. In each case and at each step at least 25 stars were used and a final absolute photometric calibration of better than 0.1 mag was achieved for all photometry. The final calibrated I-band magnitudes are presented in Table 2, and the final calibrated V-band magnitudes are presented in Table 3.
The I-band photometry is summarized in Figure 2 with a single night during quiescence shown in Figure 3 to illustrate a typical night’s I-band light curve. The V-band photometry is summarized in Figure 4 and a single night’s V-band observations during quiescence are shown in Figure 5. Figure 2 shows what may be the beginning of an outburst on JD 2452028 and one well observed outburst rise starting at JD 2452087. Figure 4 shows a decline from outburst to a V magnitude of 22.0 on JD 2449837.
4 Orbital Period Analysis
To derive the orbital period we used the algorithm of Scargle (1982) and Horne & Baliunas (1986), accelerated by the technique described in Press & Rybicki (1989). The calibrated magnitudes were converted to flux units for the period analysis. Residual long term trends were removed by taking each night, calculating the mean flux for the night, and subtracting this mean flux from the individual fluxes from the night.
4.1 Calypso Data
We used all data with errors 0.2 magnitudes to generate the periodogram shown in Figure 6. The most significant peak is at (1/d) = 8.281 0.026 (P = 2.898 0.009 h). The half-width of the periodogram peak at 85% of its peak value was used to derive all frequency error estimates in this paper.
If the periodic signal is due to the ellipsoidality effect (Bochkarev, Karitskaya, & Shakura, 1979) then the period found in the periodogram is half the orbital period because there are two modulations per orbit. In the I-band this would be especially true since the low mass M-S secondary would be prominent. An odd-even effect, where one modulation is deeper than the other, is expected because the two sides of the secondary are unequally luminous either due to gravity darkening or heating by the primary. This, plus the radial velocity curve published by Naylor et al. (1989) which indicates an orbital period 3.5 h, motivated us to explore both the peak frequency from our periodogram and half this frequency: (1/d) = 4.140 0.026 (P = 5.796 0.036 h).
We produced the binned phase diagrams shown in Figures 7 and 8 using the error weighted mean counts within each of 50 phase bins. Figure 8 clearly shows the expected odd-even effect of two unequal modulations per orbital period. We fit both sets of phase data with a periodic function of the form:
| (1) |
where is the phase, and plotted them on the phase data. The reduced of the fit in Figure 7 is 2.15, while that in Figure 8 is 1.25, which supports the longer orbital period.
4.2 SAAO Data
We applied the same techniques to the V-band data taken at the SAAO. We assumed that the orbital modulations would be present during the decline from outburst and used the run of observations from JD 2449833 to JD 2449839. Figure 10 presents the periodogram derived from these data.
While this periodogram is not as clean as the periodogram derived from the Calypso data, its most significant peak at (1/d) = 4.20 0.18 (P = 5.72 0.25 h) does support the 5.796 hour period from the Calypso data. The binned phase diagram using the weighted mean counts within each of 50 phase bins is presented in Figure 11.
5 Interpretation
5.1 The Orbital Period of V101
The phase diagram presented in Figure 8 shows the odd-even phenomenon from the ellipsoidality effect, caused by the changing geometry of the distorted secondary during the orbital cycle and the unequally luminous halves of the secondary. This effect has a small amplitude and only with many observations can the superposed stochastic variations from the accretion process be averaged out.
Figure 2.45 from Warner (1995), showing the observed relationship between spectral type and Porb, places the secondary of V101 in the range of spectral types from K5 to M0. This is consistent with spectral observations published by Margon, Downes, & Gunn (1981), Naylor et al. (1989), and Shara, Potter, & Moffat (1990) which show a red continuum in quiescence.
The phase diagram for the SAAO V-band data presented in Figure 11 shows a modulation of the same period. We expect the secondary to be much fainter in the V-band, since the secondary is of spectral type K5 to M0 with , and so we see only one modulation per orbit, perhaps due to the changing visibility of the primary star or the changing aspect of the accretion disk.
As a further consistency check, we compare the decay from outburst shown in Figure 4 with equation 3.5 from Warner (1995), which relates the outburst decay timescale, , to Porb:
| (2) |
We have overplotted this relation for an orbital period of 5.796 hours on Figure 4 as a dot-dashed line which follows the decline well. This orbital period places V101 well above the period gap for CVs and at the high end of the distribution for CVs above this gap (Warner, 1995).
5.2 The Orbital Inclination of V101
Having a constraint on the spectral type of the secondary allows us to use the light curve to explore the orbital inclination of the system using the tables in Bochkarev, Karitskaya, & Shakura (1979), assuming that the modulations shown in Figure 8 are purely due to the ellipsoidality effect. The fit shown in Figure 8 as the solid line and the average deviation from this fit was used to determine the amplitude of the variation ( mag), the difference between the two minima ( mag), and their corresponding errors.
Knowing that the secondary is a K5 to M0 dwarf constrains the effective temperature which, combined with the filter bandpass and the fact that the envelope of the secondary star is convective, allows us to use Figure 2 from Bochkarev, Karitskaya, & Shakura (1979) to determine the gravity darkening coefficient, 0.4. The limb darkening coefficient is also determined by the effective temperature and using Figure 17.6 from Gray (1976) we get u 0.5. We know that the secondary is filling its Roche lobe so we can set the Roche lobe filling factor to be = 1. We can also assume that the mass ratio, q is in the range 1.6 - 2.3, by using the mass of a K7 dwarf for the secondary star mass, 0.6 M⊙, and assuming the primary star mass, , is in the range 1.0 to 1.4 M⊙ (see § 5.5). Note that the q used by Bochkarev, Karitskaya, & Shakura (1979) is the inverse of that used traditionally in the CV literature where q .
Using these values to examine Table 1 from Bochkarev, Karitskaya, & Shakura (1979) we can constrain the inclination angle, , by to be in the range . Using Table 2 from Bochkarev, Karitskaya, & Shakura (1979) we can constrain the inclination angle by to be in the range . These two constraints overlap in the range and are consistent with the fact that no eclipses are seen.
5.3 The Distance to V101
We can now use the empirical relation between orbital period, , and secondary luminosity, , to determine the distance modulus to V101. Using equation 2.102 from Warner (1995),
| (3) |
we determine the absolute magnitude of the secondary to be M. Figure 2.46 in Warner (1995) shows that the scatter in this relation is about 0.5 magnitudes. From the minimum published V magnitude of 22.5 (Kukarkin & Mironov, 1970) and M, we get a distance modulus of 14.3 0.5, consistent with the distance modulus of M5 of (Sandquist, Bolte, Stetson, & Hesser, 1996).
5.4 The Outburst Period of V101
If the rise seen in Figure 2 on JD 2452028 is indeed the beginning of an outburst, then the two outbursts we observe separated by 60 days with an intervening quiescent period supports the outburst period first proposed by Oosterhoff (1941) of 66 days. Many observations of individual outbursts have been reported (Margon, Downes, & Gunn 1981; Shara, Potter, & Moffat 1987; Naylor et al. 1989). Using these data to examine the periodicity of the outbursts shows that no regular period for the outbursts exists, but a ‘typical’ outburst interval is in the range of 60 to 66 days. This is expected behavior for DN outbursts which don’t exhibit strict periodicity.
5.5 The Mass and Location of V101
A recent mass-spectral type study (Baraffe & Chabrier, 1996) concludes that an M0 star has a mass of 0.6 M⊙. The mass-orbital period relation, equation 2.100 from Warner (1995),
| (4) |
yields 0.58 M⊙ as the secondary mass of a CV with a 5.796 hour period. These are consistent with the 0.6 M⊙ derived earlier from the system luminosity (and type K5-M0) near minimum. The white dwarf mass of V101 must then be 1 M⊙ or so to prevent dynamical mass transfer, implying a system mass in excess of 1.6 M⊙. This system mass is twice that of the main sequence turnoff in M5, which should place V101 in the inner one or two core radii of the cluster.
M5 V101 stubbornly refuses to conform to this logic. It is, in fact, located 10 core radii from the center of M5. What is it doing out there? Perhaps the simplest explanation is dynamics.
Stars lead extremely promiscuous lives in clusters, especially near the centers where stellar densities are highest. Mate swapping is commonplace, as are strong, close encounters between binaries and single stars (e.g. Hurley & Shara 2002). These encounters often lead to the high speed recoils of the emerging binary and single stars. Such a scenario could place V101 far from the core of M5. It also makes the intriguing prediction of the existence of a low mass M dwarf on the opposite side of M5, considerably farther out than 10 core radii, escaping the cluster at high speed.
6 Conclusions
We conclude that the orbital period for V101 is P = 5.796 0.036 h. Using this orbital period to determine a distance modulus yields which supports the membership of V101 in M5. We conclude that the secondary of V101 is a low mass M-S star whose spectral type is in the range K5 to M0. We also conclude that the orbital inclination is high, but not high enough for the system to exhibit eclipses.
References
- Baraffe & Chabrier (1996) Baraffe, I. & Chabrier, G. 1996, ApJ, 461, L51
- Bochkarev, Karitskaya, & Shakura (1979) Bochkarev, N. G., Karitskaya, E. A., & Shakura, N. I. 1979, SvA, 23, 8
- Fabian, Pringle, & Rees (1975) Fabian, A. C., Pringle, J. E., & Rees, M. J. 1975, MNRAS, 172, 15P
- Gray (1976) Gray, D. F. 1976, The Observation and Analysis of Stellar Photospheres (New York: Wiley-Interscience)
- Grindlay, Heinke, Edmonds, & Murray (2001) Grindlay, J. E., Heinke, C., Edmonds, P. D., & Murray, S. S. 2001, Science, 292, 2290
- Hakala, Charles, Johnston, & Verbunt (1997) Hakala, P. J., Charles, P. A., Johnston, H. M., & Verbunt, F. 1997, MNRAS, 285, 693
- Horne & Baliunas (1986) Horne, J. H. & Baliunas, S. L. 1986, ApJ, 302, 757
- Hurley & Shara (2002) Hurley, J. R. & Shara, M. M. 2002, ApJ, in press
- Hut (1984) Hut, P. 1984, ApJS, 55, 301
- Knigge et al. (2002) Knigge, C., Shara, M. M., Zurek, D. R., Long, K. S., & Gilliland, R. L. 2002, to be published in ASP Conf. Ser., Stellar Collisions, Mergers, and their Consequences, astro-ph/0012187
- Kukarkin & Mironov (1970) Kukarkin, B. V. & Mironov, A. V. 1970, AZh, 47, 1211
- Margon, Downes, & Gunn (1981) Margon, B., Downes, R. A., & Gunn, J. E. 1981, ApJ, 247, L89
- Naylor et al. (1989) Naylor, T. et al. 1989, MNRAS, 241, 25P
- Oosterhoff (1941) Oosterhoff, P. T. 1941, Annalen van de Sterrewacht te Leiden, 17, 41
- Pooley et al. (2002) Pooley, D., Lewin, W. H. G., Homer, L., Verbunt, F., Anderson, S. F., Gaensler, B. M., Margon, B., Miller, J., Fox, D. W., Kaspi, V. M., & van der Klis, M. 2002, ApJ, submitted, astro-ph/0110192
- Press & Rybicki (1989) Press, W. H. & Rybicki, G. B. 1989, ApJ, 338, 277
- Sandquist, Bolte, Stetson, & Hesser (1996) Sandquist, E. L., Bolte, M., Stetson, P. B., & Hesser, J. E. 1996, ApJ, 470, 910
- Scargle (1982) Scargle, J. D. 1982, ApJ, 263, 835
- Shara, Potter, & Moffat (1987) Shara, M. M., Potter, M., & Moffat, A. F. J. 1987, AJ, 94, 357
- Shara, Potter, & Moffat (1990) Shara, M. M., Potter, M., & Moffat, A. F. J. 1990, AJ, 99, 1858
- Stetson (2000) Stetson, P. B. 2000, PASP, 112, 925
- Tody (1986) Tody, D. 1986, Proc. SPIE, 627, 733
- Warner (1995) Warner, B. 1995, Cambridge Astrophysics Series, Cambridge, New York: Cambridge University Press, —c1995


| JD | Date | N exp | Comments |
|---|---|---|---|
| 1995 SAAO V-band Data | |||
| 2449833 | 25 Apr | 11 | outburst decline |
| 2449835 | 27 Apr | 21 | outburst decline |
| 2449837 | 29 Apr | 19 | |
| 2449838 | 30 Apr | 18 | |
| 2449839 | 01 May | 16 | |
| 2001 Calypso I-band Data | |||
| 2451988 | 20 Mar | 1 | |
| 2451990 | 22 Mar | 3 | |
| 2451992 | 24 Mar | 1 | |
| 2451994 | 26 Mar | 2 | |
| 2451999 | 31 Mar | 1 | |
| 2452026 | 27 Apr | 27 | |
| 2452028 | 29 Apr | 13 | outburst rise? |
| 2452050 | 21 May | 17 | |
| 2452051 | 22 May | 19 | |
| 2452052 | 23 May | 23 | |
| 2452053 | 24 May | 23 | |
| 2452054 | 25 May | 34 | |
| 2452055 | 26 May | 29 | |
| 2452056 | 27 May | 19 | |
| 2452058 | 29 May | 38 | |
| 2452059 | 30 May | 52 | |
| 2452060 | 31 May | 32 | |
| 2452084 | 24 Jun | 29 | |
| 2452086 | 26 Jun | 3 | |
| 2452087 | 27 Jun | 36 | outburst rise |
| 2452088 | 28 Jun | 23 | outburst rise |
| 2452089 | 29 Jun | 21 | outburst rise |
| 2452090 | 30 Jun | 15 | outburst rise |
Note. — All observations are in quiescence unless otherwise noted.
| Julian Day | I | Error |
|---|---|---|
| (day) | (mag) | (mag) |
| 2451988.938 | 20.34 | 0.03 |
| 2451990.986 | 20.05 | 0.04 |
| 2451990.995 | 20.11 | 0.05 |
| 2451991.002 | 20.17 | 0.06 |
| 2451992.882 | 20.13 | 0.03 |
| 2451994.914 | 20.18 | 0.03 |
| 2451994.925 | 20.24 | 0.03 |
| 2451999.937 | 20.34 | 0.06 |
| 2452026.752 | 19.67 | 0.04 |
| 2452026.760 | 19.93 | 0.04 |
| 2452026.767 | 19.88 | 0.03 |
| 2452026.774 | 19.96 | 0.03 |
| 2452026.781 | 19.92 | 0.03 |
| 2452026.789 | 19.91 | 0.03 |
| 2452026.804 | 19.90 | 0.03 |
Note. — Table 2 is presented in its entirety in the electronic edition of the Astronomical Journal. A portion is shown here for guidance regarding its form and content.
| Julian Day | V | Error |
|---|---|---|
| (day) | (mag) | (mag) |
| 2449833.436 | 19.78 | 0.04 |
| 2449833.447 | 19.81 | 0.04 |
| 2449833.459 | 19.83 | 0.04 |
| 2449833.469 | 19.81 | 0.03 |
| 2449833.500 | 19.82 | 0.04 |
| 2449833.530 | 19.85 | 0.04 |
| 2449833.560 | 19.83 | 0.03 |
| 2449833.573 | 19.83 | 0.04 |
| 2449833.594 | 19.84 | 0.04 |
| 2449833.615 | 19.87 | 0.05 |
| 2449833.634 | 19.90 | 0.05 |
| 2449835.374 | 20.53 | 0.04 |
| 2449835.386 | 20.57 | 0.04 |
| 2449835.397 | 20.67 | 0.04 |
| 2449835.408 | 20.68 | 0.05 |
Note. — Table 3 is presented in its entirety in the electronic edition of the Astronomical Journal. A portion is shown here for guidance regarding its form and content.