Calibration of the Barnes-Evans relation using interferometric observations of Cepheids
Abstract
Direct diameter observations of Cepheid variables are used to calibrate the Barnes-Evans Cepheid surface brightness relation. Fifty-nine separate Cepheid diameter measurements from four different optical interferometers are used to calculate surface brightnesses as a function of magnitude and color. The linear fit to Cepheid surface brightness versus color is in excellent agreement with functions in the literature found using interferometric observations of non-variable giant and supergiant stars (Fouqué & Gieren, 1997). Using these relations the distance is calculated to Cephei, for which an independent distance is known from trigonometric parallax. The distance from the relation in this paper differs from that derived by the previously published relation by 4% but is still marginally within the combined errors. Both distances are well within the errors of the distance derived from trigonometric parallax.
1 Introduction
The distance to the Large Magellanic Cloud (LMC) is of great interest as it is the primary means of calibrating extra-galactic distance scales. One method for determining this distance is to determine the distance to Cepheids within the LMC. The pulsation parallax method, by which angular diameter variations are coupled with linear diameter displacements, is one means by which Cepheid distances are determined.
Whereas radial velocity measurements are used to derive linear diameter changes, angular diameters have, until recently, only been estimated from photometric surface brightness relations (Wesselink, 1969). Recent results from optical interferometry have yielded mean angular diameters for the Cepheids Cephei, Aquilae, Geminorum, and Polaris (Mourard et al., 1997; Nordgren et al., 1999, 2000). Only Geminorum, however, has had its diameter variation measured directly (Lane et al., 2000). Thus, while direct interferometric observations are confined to nearby Galactic Cepheids these observations can be used to calibrate the surface brightness relations necessary for estimating the angular diameters of more distant Cepheids, such as those in the LMC.
1.1 Surface Brightness Relations
Several calibrations of Cepheid surface brightness relations have been used to calculate angular diameters of Cepheids (Wesselink, 1969; Barnes & Evans, 1976; Caccin et al., 1981; Welch, 1994; Laney & Stobie, 1995). The Barnes-Evans relation (Barnes & Evans, 1976) has both optical and infrared versions (Welch, 1994; Fouqué & Gieren, 1997). Moffett & Barnes (1987) have used these relations to calculate the angular diameters of over a hundred Cepheids in the Galaxy and the Magellanic Clouds (Gieren, Moffett, & Barnes, 1999; Gieren et al., 2000). In general these methods relate the surface brightness at a given pulsation phase, , in some dereddened magnitude, or , to the angular diameter, , at that phase:
| (1) |
| (2) |
where units for the surface brightness are Watts per meter squared per micron. A relation (e.g., linear) is then sought between the surface brightness as a function of phase to the Cepheid color at that phase:
| (3) |
| (4) |
These versions of the Barnes-Evans relation were most recently calibrated using interferometric angular diameter observations of non-variable late-type giant and supergiants stars (Fouqué & Gieren, 1997). In that work Fouqué and Gieren use the non-variable stellar observations to set the zero-point of the relation between surface brightness (F, F) and three colors: , , . The slope for this relation is derived directly from the Cepheid’s magnitude and linear displacement. Using these slopes and the non-variable stars to supply a zero-point, the full relation between angular diameter, magnitude and color as a function of pulsation phase is found for Cepheid variables. In this paper we use recent interferometric angular diameters of three nearby Cepheids to fully calibrate the Barnes-Evans surface brightness relation.
Section 2 presents the interferometric data. Section 3 explores the agreement between observations of non-variable stars by different interferometers. Section 4 presents the photometric data analysis, including dereddening. Section 5 follows the analysis of Fouqué & Gieren (1997) in order to derive the surface brightness relations. Section 6 repeats this analysis for the single Cepheid, Gem, for which the most accurate angular diameters are available. Section 7 uses these relations to calculate a distance to the nearby Cepheid, Cephei. Section 8 explores the limitations of the current analysis and the role of future, higher-precision interferometric observations of Cepheids.
2 The Data
Interferometric observations have been acquired for three Cepheid variables: Cephei, Aquilae, and Geminorum. These observations have taken place using the optical and infrared interferometers: Grand Interféromètre à 2 Télescopes (GI2T), Navy Prototype Optical Interferometer (NPOI), Palomar Testbed Interferometer (PTI), and Infrared-Optical Telescope Array (IOTA). A total of 59 separate observations of these three Cepheids have been reported in the last four years (Mourard et al., 1997; Nordgren et al., 2000; Lane et al., 2000; Kervella et al., 2001; Armstrong et al., 2001). In each case the reported diameter is a uniform-disk diameter () which assumes the star is a uniformly-bright disk. The diameter used in Equations 1 and 2 is the more physically real limb-darkened diameter (). At the level of precision of these interferometers, as given by the uncertainty in each uniform-disk diameter (), a simple multiplicative limb-darkened conversion factor (LDC) is used to convert uniform-disks to limb-darkened disks. This factor is dependent upon the wavelength of observation and the star’s estimated effective temperature and surface gravity (see Lane et al. (2000) for a representative derivation for the LDC appropriate for PTI observations of Gem). Table 1 lists the uniform-disk angular diameters, their uncertainties and the associated limb-darkened conversion factors. The Julian date and derived pulsation phase for each observation (where phase 0 = maximum light in V) is also given.
3 Nonvariable Giant Star Surface Brightness Relations
For a sample of ten giant stars observed with the IOTA interferometer Fouqué & Gieren (1997) fit relations between surface brightness in and magnitude bands: F and F, and color: , , and . Since 1997 many more stellar angular diameters have been published in the literature. Does the increase in the number of non-variable giants lead to a difference in these relations (thereby changing their Cepheid surface brightness calibration)? To answer this question we use a sample of 57 non-variable giant stars observed at the NPOI (Nordgren et al., 1999; Nordgren, Sudol, & Mozurkewich, 2001) to calculate the same relations between F, F and , , and . Fouqué & Gieren (1997) used an unweighted linear least squares fit, while for this study we use a linear least squares fit weighted by the limb-darkened angular uncertainty. The reason for this weighting is that the angular diameters in this study span a larger range than in Fouqué & Gieren (1997) and therefore there is a larger range of diameter uncertainties. The formal uncertainty in our least squares fit is multiplied by the square-root of the reduced chi-square.
For the 57 NPOI giants we find:
| (5) |
| (6) |
| (7) |
Compared to Fouqué’s and Gieren’s Equations (4) - (6):
For all three cases the new relations are in excellent agreement with the Fouqué and Gieren relations. Interestingly, even though the number of stars is almost six times greater, the root-mean-squares are nearly equal and indicate an intrinsic width to the distribution. Mozurkewich et al. (2001) find a similar scatter which they attribute to a real spread within the class of stars. Both this study and the earlier one therefore start from the same relationships between surface brightness (and hence interferometrically measured angular diameter) and color.
As a representative example, Figure 1 displays F versus for the NPOI sample. The weighted linear least squares fit is given by the solid line while the corresponding non-variable giants relation of Fouqué & Gieren (1997) is shown by the dashed line.
4 The Cepheid Photometric Data
For each Cepheid observation in the literature, (Mourard et al., 1997; Nordgren et al., 2000; Kervella et al., 2001; Lane et al., 2000; Armstrong et al., 2001) the phase is calculated for each diameter measurement using appropriate ephemerides. In order to determine photometry at each of these phases, spline fits are made to the Cepheid photometric data in the literature.
Stellar photometry comes from four sources. Visual photometry is primarily from Moffett & Barnes (1984), with additional data for Gem from Shobbrook (1992). Infrared photometry for Cephei and Aql is from Barnes et al. (1997); infrared photometry for Gem comes from Wisniewski & Johnson (1968). The phases given in Moffett & Barnes (1984) have since been corrected to match the ephemerides in Moffett & Barnes (1985), which are consistent with those of Barnes et al. (1997). Overlapping visual photometry has been used to ensure that the phasing is correct.
The photometry are somewhat irregular in phase coverage. To permit interpolation to values at particular phases, smooth curves were drawn by eye through the raw data, and cubic splines were then fit to these curves. These fit curves result in BVRIJK data at 0.01 phase intervals for each Cepheid.
The photometric curves are dereddened using the standard equations. The (B-V) color excess, E(B-V), for each Cepheid is taken from Fernie (1990). We adopt RV = 3.26 from Cardelli, Clayton, & Mathis (1989), and
| (8) |
| (9) |
| (10) |
from Fouqué & Gieren (1997), to remain consistent with their analysis. This insistence upon consistency with the earlier work is not strictly necessary as that analysis shows the exact reddening law has an affect of less than 1% on the derived distance (Gieren et al., 2000). This level of accuracy in the determined distance is currently smaller than the precision of the method by a factor of two to three.
5 Cepheid Surface Brightness Relations
In the same manner as for the 57 non-variable giant stars, a weighted least squares fit is made to the surface brightness as a function of color for each of the 59 Cepheid observations. The three relations found in this manner are:
| (11) |
| (12) |
| (13) |
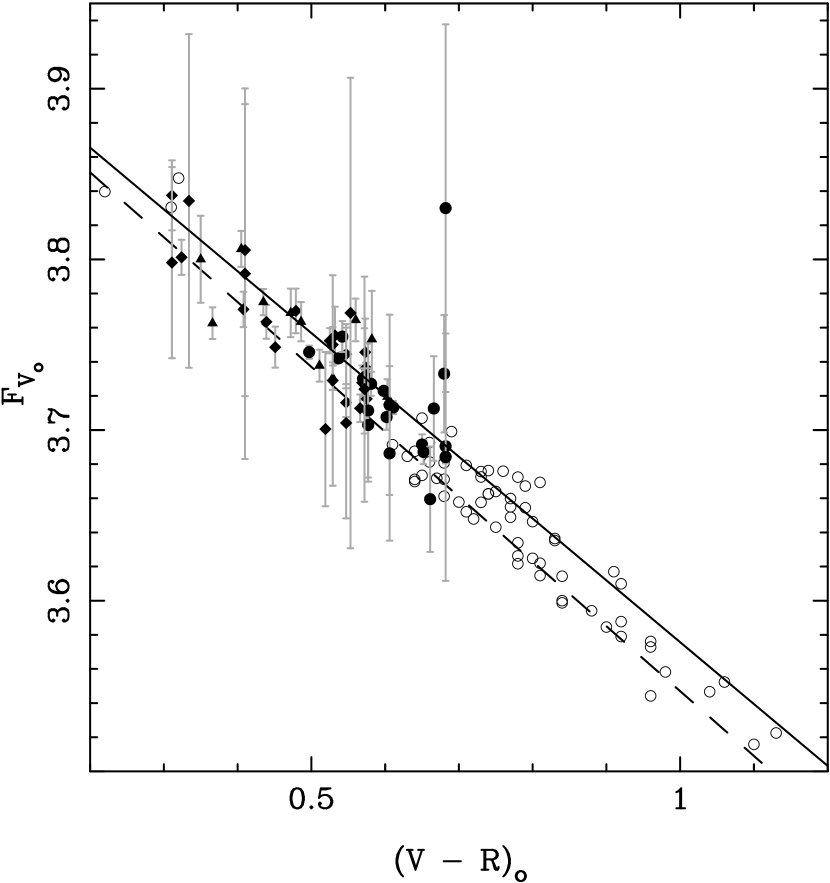
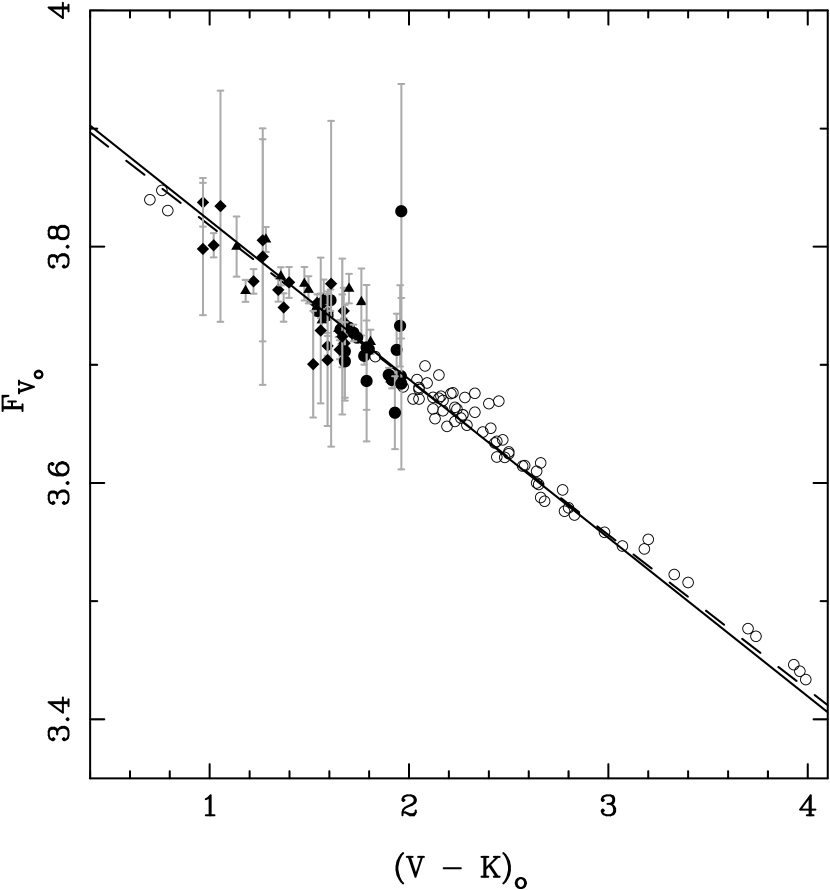
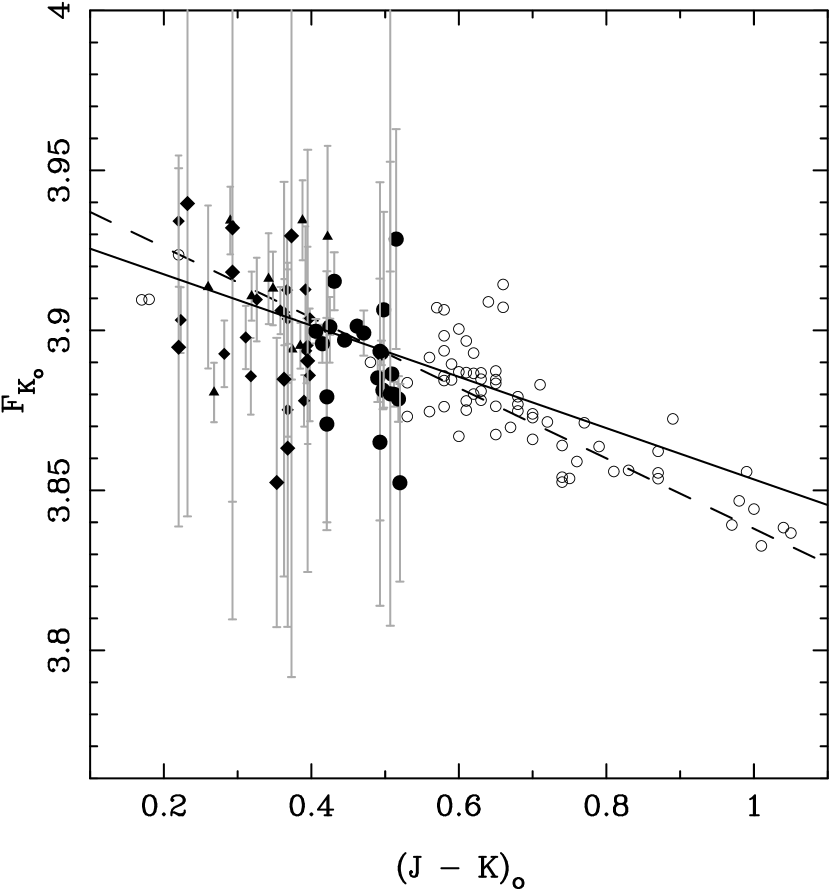
Figures 2 - 4 display F versus , F versus , and F versus respectively for the 59 Cepheid observations. The one Cepheid outlier in each figure is a single observation of Gem from IOTA (solid circle). At IOTA’s baseline and observational wavelength Gem is only marginally resolved, hence the poor precision of the observation (as evidenced by the larger error bar). The solid lines are the weighted linear least squares fits to the Cepheid observations. The dashed lines are the corresponding relations from Fouqué & Gieren (1997) given in their Table 3. The open circles are the non-variable giant stars from the previous section (and Figure 1) which are shown for comparison.
For a star of spectral type A0 where = = = 0, each of the relations should yield a common surface brightness. While they are very similar, within the errors they are marginally unequal. The weighted average of the intercepts for , , and is 3.941 0.004. Forcing this value to be the zero-point for each of the three relations while solving for new slopes yields the final relations:
| (14) |
| (15) |
| (16) |
Using the non-variable stars to arrive at a Cepheid zero-point (while also requiring there to be a common zero-point) Fouqué and Gieren derive for Cepheids (their Equations (26) - (28):
The two sets of relations are consistent within the combined uncertainties at the 2 level (with the relation being the closest in agreement). Figure 5 displays F versus for the 59 Cepheid observations, where the solid line is the weighted linear least squares fit to the Cepheid observations with a common zero-point. The dashed line is the corresponding relation from Fouqué & Gieren (1997) given in their Equation (27).
6 Geminorum
The vast majority of Cepheid observations do not detect the pulsation of the Cepheid. Notice the scatter in points about the best fit lines in Figure 5. It is possible that the lack of precision of the non-PTI Gem observations also hides a lack of accuracy which could skew the relations found in the previous sections. We therefore investigate whether surface brightness relations fit to the PTI observations alone reveal a statistically different result. In addition, since Gieren (1988) report that there is a weak period dependence on the slope for Cepheids, fitting a relation to a single Cepheid will allow for the investigation of this dependence within the data. For the color , this dependence is of the form
| (17) |
which for Gem with P = 10.1507 days, yields .
Using only the highest precision PTI data to recalibrate the surface brightness relations yields (where we have not constrained the relations to a common zero-point):
| (18) |
| (19) |
| (20) |
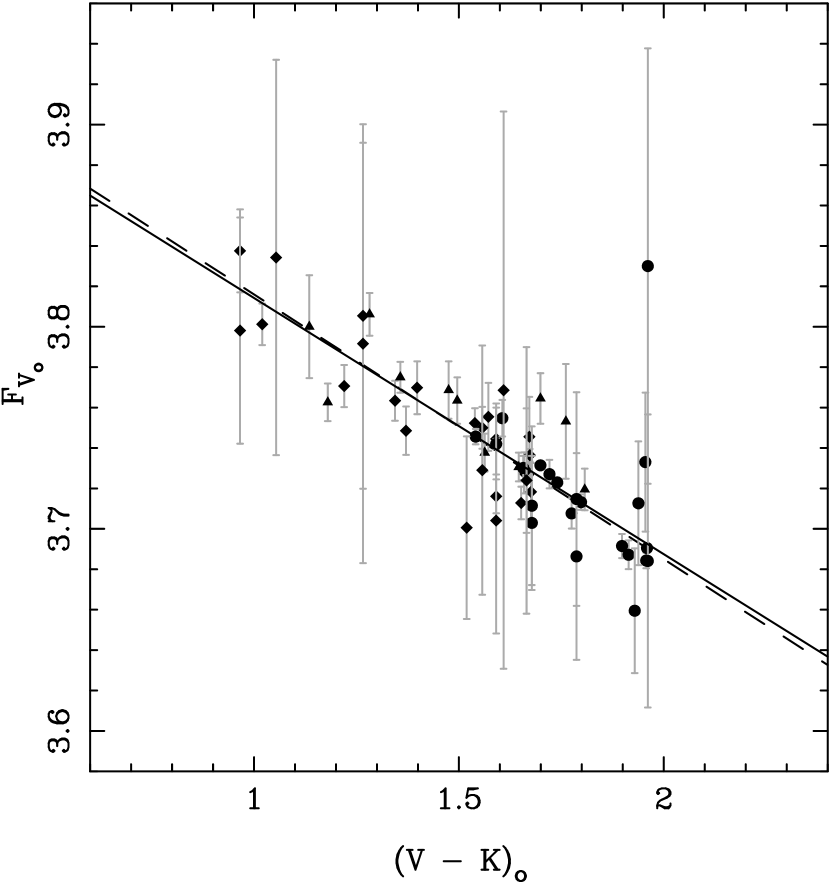
The slope for the relation from the PTI Gem data is consistent with the P = 10.1507 day slope of . It also agrees well with Equation 11 derived from the entire sample of Cepheids. The two IR relations (Equations 19 and 20) are marginally inconsistent with their counterparts from the entire Cepheid sample. One possible reason for the difficulty with the IR relations is the lack of good J and K magnitudes for Gem. The only published J and K magnitudes for this Cepheid are by Wisniewski & Johnson (1968) in the Communications of the Lunar and Planetary Lab. Figure 6 shows F versus for the PTI Gem observations, where the solid line is the weighted linear least squares fit to the Cepheid observations from Equation 19. The dashed line is the corresponding fit to all Cepheids from Equation 15.
Using Equations 14 - 16 the new Cepheid angular diameter relations are:
| (21) |
| (22) |
| (23) |
7 Distance to Cephei
With angular diameters from photometry and linear displacements from radial velocities the distance and mean linear radius of a Cepheid can be calculated. We have chosen to calculate the distance to the nearby Cepheid, Cephei, for which an independent distance is known from trigonometric parallax (Nordgren et al., 2000).
is calculated using 50 V magnitudes from Moffett & Barnes (1984). is calculated using the same 50 V magnitudes plus the interpolated (V-K) color curve which yields 50 values for the K magnitude. These magnitudes plus the interpolated color curves from the previous section yield the angular diameter of Cephei as a function of pulsation phase.
Radial velocity data for Cephei are taken from Butler (1993) and Shane (1958). As described by Butler (1993), the data of Shane (1958) were retarded in phase by 0.117, which corrected the data to the ephemerides of Moffett & Barnes (1985). The Shane data were also increased by a constant 2.379 km/s to match the Butler (1993) values. As with the photometry, smooth curves were drawn through the data and fitted with cubic splines in order to interpolate in phase.
Radial velocities are first converted to pulsation velocities using the projection factor for Cephei, p = 1.31 0.03 (Parsons, 1972). It is important to note that the projection factor has a direct effect on the final distance determination. For a Cepheid of similar period to Cephei (CV Mon with period = 5.378 days) Gieren, Fouqué, & Gomez (1997) use a factor of 1.368, differing from this paper by 4.4%. This difference leads directly to a 4.4% difference in the final distance. However, since this paper is primarily concerned with comparing different surface brightness relation calibrations, the comparison is valid provided the same p-factor is used in both cases (which has been done).
Linear radii displacements are next found by integrating the radial velocities. These displacements are then matched to the angular diameters found using the photometry. These curves were fitted to each other iteratively, because the angular diameters depend weakly on the assumed surface gravity, which in turn depends on the assumed mean linear diameter and mean surface gravity. Level effects in stellar atmospheres would admit a slight phase lag in the linear radii displacements, relative to the angular diameters. In fact the best fit was found with zero phase shift.
Using these angular diameters and linear displacements the distance and mean radius for Cephei is found from the equation:
| (24) |
where is the mean linear diameter in AU, is the linear displacement in AU at a time , is the distance in parsecs and is the angular diameter in milliarcseconds at time . Figures 7 and 8 display angular diameter versus linear displacement and angular diameter as a function of phase for Cephei from the relation in Equation 22.
Table 2 column 2 lists the newely calculated distances to Cephei using angular diameters from Equations 21 - 23. The weighted mean of the three relations is 272 6 pc. Using the three equations from Fouqué & Gieren (1997) the same data yield the distances in column 3. The weighted mean of the three distances in column 3 is 262 5 pc. All but the distance are consistent between the two sets of equations (and that relation is only just outside the mutual errors). The mean distances differ by 4% and are marginally consistent at the one-sigma level. The triginometric parallax distance of Cephei as calculated from the Hipparcos parallax and USNO parallax is 278 pc (Nordgren et al., 2000) which is consistent with both.
As noted earlier, had we used a higher value of p-factor as done by Gieren, Fouqué, & Gomez (1997) the distances we calculated using both surface brightness relations would be 4.4% smaller. Both distances would still be well within the Hipparcos parallax distance.
8 Further Work and Limitations
Over the next year the NPOI will increase its resolution by nearly a factor of two which will add at least two more Cepheids to the sample list and increase the precision of those in the current sample. In the coming year VLTI baselines of up to 202 meters will make it possible to study the pulsation of nine Cepheids covering a wide range of periods. The position of the VLTI in the Southern hemisphere makes it a valuable complement to the NPOI and PTI instruments. The result is that soon there should be many more observations of the quality of the PTI data. Such observations will improve the quality of this analysis. For instance, as in Lane et al. (2000) where accurate and precise observed angular diameters as a function of phase lead to a Cepheid’s distance directly, new observations of Cephei will yield an independent check on the results of the current surface brightness calibration. Other questions to be addressed include whether or not it is possible to detect the period dependence of the slope as found by Gieren (1988).
In addition, newer, better observations are also expected to reveal the limitations of this current analysis. For instance, the linear relation fit to the Cepheid data assumes that the atmosphere is in thermal equilibrium at all stages of the pulsation. While this may be an acceptable approximation for the relatively small, short period Cepheids in this sample, it is almost certainly not the case for longer period Cepheids with extended atmospheres. More precise observations which include those of longer period Cepheids will reveal whether the surface brightness as a function of color deviates from the simple linear fits used here.
9 Conclusions
Direct angular diameter observations of Cepheid variables are used to calibrate the Barnes-Evans Cepheid surface brightness relation. The linear fit to Cepheid surface brightness versus color is in good agreement with expressions in the literature by Fouqué & Gieren (1997) found using interferometric observations of non-variable giant and supergiant stars. Using these relations the distance is calculated to Cephei. The distance from the relation in this paper differs from that derived by the previously published relation by only 4% which is marginally within the combined errors. As much of this disagreement is likely due to the high degree of scatter in the interferometric diameters, it is expected that as interferometers improve, the differences will diminish. Currently, however, both distances are well within the errors of the distance derived directly from trigonometric parallax.
References
- Armstrong et al. (2001) Armstrong, J. T., Nordgren, T. E., Mozurkewich, Germain, M. E., Hajian, A. R., Hindsley, R. B., Hummel, C. A., & Thessin, R. N. 2001, AJ, 121, 476
- Barnes & Evans (1976) Barnes, T. G. & Evans, D. S. 1976, MNRAS, 174, 489
- Barnes et al. (1997) Barnes, T. G., Fernley, J. A., Frueh, M. L, Navas, J. G., Moffett, T. J., & Skillen, I. 1997, PASP, 109, 645
- Butler (1993) Butler, R. P. 1993, ApJ, 415, 323
- Caccin et al. (1981) Caccin, B., Onnembo, A., Russo, G., & Sollazzo, C. 1981, A&A, 97, 104
- Cardelli, Clayton, & Mathis (1989) Cardelli, J. A., Clayton, G. C., & Mathis, J. S., 1989, ApJ, 345, 245
- Fernie (1990) Fernie, J. D., 1990, ApJS, 72, 153
- Fouqué & Gieren (1997) Fouqué, P. & Gieren, W. P. 1997, A&A, 320, 799
- Gieren (1988) Gieren, W. P. 1988, ApJ, 329, 790
- Gieren, Fouqué, & Gomez (1997) Gieren, W. P., Fouqué, P., & Gomez, M. 1997, ApJ, 488, 74
- Gieren, Moffett, & Barnes (1999) Gieren, W. P., Moffett, T. J., & Barnes III, T. G. 1999, ApJ, 512, 553
- Gieren et al. (2000) Gieren, W. P., Storm, J., Fouqué, P., Mennickent, R. E., & Gomez, M. 2000, ApJ, 533, L107
- Kervella et al. (2001) Kervella, P., Coudé du Foresto, V., Perrin, G., Schöller, M., Traub, W. A., & Lacasse, M. G. 2001, A&A, 367, 876
- Lane et al. (2000) Lane, B. F., Kuchner, M. J., Boden, A. F., Creech-Eakman, M., Kulkarni, S. R. 2000, Nature, 407, 485
- Laney & Stobie (1995) Laney, C. D. & Stobie, R. S. 1995, MNRAS, 274, 337
- Moffett & Barnes (1984) Moffett, T. J., & Barnes III, T. G. 1984, ApJS, 55, 389
- Moffett & Barnes (1985) Moffett, T. J, & Barnes III, T. G. 1985, ApJS, 58, 843
- Moffett & Barnes (1987) Moffett, T. J., & Barnes III, T. G. 1987, ApJ, 323, 280
- Mourard et al. (1997) Mourard, D., Bonneau, D., Koechlin, L., Labeyrie, A., Morand, F., Stee, P., Tallon-Bosc, I., & Vakili, F. 1997, A&A, 317, 789
- Mozurkewich et al. (2001) Mozurkewich, D., Elias II, N. M., Hajian, A. R., Johnston, K. J., & Armstrong, J. T. 2001, AJ, submitted
- Nordgren et al. (1999) Nordgren, T. E., Germain, M. E., Benson, J. A., Mozurkewich, D., Sudol, J. J., Elias II, N. M., Hajian, A. R., White, N. M., Hutter, D. J., Johnston, K. J., Gauss, F. S., Armstrong, J. T., Pauls, T. A., & Rickard, L. J 1999, AJ, 118, 3032
- Nordgren et al. (2000) Nordgren, T. E., Armstrong, J. T., Germain, M. E., Hindsley, R. B., Hajian, A. R., Sudol, J. J., & Hummel, C. A. 2000, ApJ, 543, 972
- Nordgren, Sudol, & Mozurkewich (2001) Nordgren, T. E., Sudol, J. J., & Mozurkewich, D. 2001, AJ, 122, 2707
- Parsons (1972) Parsons, S. B. 1972, ApJ, 174, 57
- Shane (1958) Shane, W. W. 1958, ApJ, 127, 573
- Shobbrook (1992) Shobbrook, R. R. 1992, MNRAS, 255, 486
- Welch (1994) Welch, D. L. 1994, AJ, 108, 1421
- Wesselink (1969) Wesselink, A. J. 1969, MNRAS, 144, 297
- Wisniewski & Johnson (1968) Wisniewski, W. Z. & Johnson, H. L. 1968, Comm. Lunar and Planet. Lab., 7, 57
| Cepheid | Obs. | LDC | JD | Phase | ref | |||
|---|---|---|---|---|---|---|---|---|
| (m) | (mas) | (mas) | ||||||
| Cephei | NPOI | 0.740 | 1.044 | 2450788.63 | 0.80 | 1.55 | 0.06 | a |
| 2450994.91 | 0.24 | 1.63 | 0.09 | |||||
| 2450995.93 | 0.42 | 1.42 | 0.11 | |||||
| 2450996.97 | 0.61 | 1.48 | 0.21 | |||||
| 2450997.93 | 0.80 | 1.36 | 0.11 | |||||
| 2450998.93 | 0.98 | 1.27 | 0.12 | |||||
| 2451007.96 | 0.66 | 1.52 | 0.10 | |||||
| 2451008.92 | 0.85 | 1.33 | 0.08 | |||||
| 2451009.96 | 0.03 | 1.48 | 0.07 | |||||
| 2451010.92 | 0.22 | 1.54 | 0.07 | |||||
| 2451011.91 | 0.40 | 1.47 | 0.07 | |||||
| 2451012.90 | 0.59 | 1.50 | 0.07 | |||||
| 2451088.81 | 0.71 | 1.32 | 0.12 | |||||
| 2451089.78 | 0.89 | 1.46 | 0.07 | |||||
| 2451093.76 | 0.64 | 1.41 | 0.02 | |||||
| 2451097.78 | 0.38 | 1.47 | 0.05 | |||||
| 2451098.85 | 0.57 | 1.62 | 0.06 | |||||
| GI2T | 0.669 - 0.675 | 1.045 | 2449566.6 | 0.05 | 1.31††For the GI2T observations, is calculated from the published visibilities, projected baseline, and mean observational wavelength. | 0.59 | b | |
| 2449572.5 | 0.17 | 1.46 | 0.73 | |||||
| 2449642.3 | 0.17 | 1.37 | 0.54 | |||||
| 2449643.3 | 0.36 | 1.97 | 0.41 | |||||
| 2449541.6 | 0.40 | 1.69 | 0.48 | |||||
| 2449569.5 | 0.61 | 1.58 | 0.48 | |||||
| 2449570.5 | 0.79 | 1.26 | 0.80 | |||||
| 2449640.3 | 0.80 | 1.71 | 0.44 | |||||
| 2449571.5 | 0.98 | 1.59 | 0.41 | |||||
| Aquilae | NPOI | 0.740 | 1.048 | 2450638.86 | 0.98 | 1.87 | 0.08 | a |
| 2450640.88 | 0.29 | 1.70 | 0.09 | |||||
| 2450641.86 | 0.39 | 1.85 | 0.08 | |||||
| 2450997.83 | 0.00 | 1.62 | 0.19 | |||||
| 2450998.88 | 0.17 | 1.70 | 0.06 | |||||
| 2451007.88 | 0.43 | 1.83 | 0.06 | |||||
| 2451008.91 | 0.57 | 1.53 | 0.20 | |||||
| 2451009.85 | 0.67 | 1.69 | 0.08 | |||||
| 2451010.84 | 0.81 | 1.39 | 0.08 | |||||
| 2451011.84 | 0.95 | 1.44 | 0.07 | |||||
| 2451012.87 | 0.89 | 1.53 | 0.10 | |||||
| Geminorum | NPOI | 0.740 | 1.046 | 2451098.98 | 0.52 | 1.49 | 0.21 | c |
| 2451229.83 | 0.41 | 1.39 | 0.22 | |||||
| 2451232.72 | 0.70 | 1.54 | 0.05 | |||||
| 2451233.71 | 0.80 | 1.44 | 0.06 | |||||
| PTI | 1.64 | 1.038 | 2451605.73 | 0.45 | 1.679 | 0.014 | d | |
| 2451606.74 | 0.55 | 1.678 | 0.046 | |||||
| 2451607.78 | 0.65 | 1.651 | 0.057 | |||||
| 2451614.69 | 0.33 | 1.800 | 0.059 | |||||
| 2451615.68 | 0.43 | 1.740 | 0.031 | |||||
| 2451617.67 | 0.63 | 1.590 | 0.028 | |||||
| 2451618.64 | 0.72 | 1.538 | 0.007 | |||||
| 2451619.67 | 0.82 | 1.553 | 0.018 | |||||
| 2451620.67 | 0.92 | 1.589 | 0.028 | |||||
| 2451622.7 | 0.12 | 1.677 | 0.046 | |||||
| 2451643.66 | 0.19 | 1.666 | 0.012 | |||||
| IOTA | 2.14 | 1.02 | 2451259.78 | 0.35 | 2.040 | 0.29 | e | |
| 2451262.72 | 0.64 | 1.602 | 0.39 | |||||
| 2451262.76 | 0.64 | 1.826 | 0.43 | |||||
| 2451595.84 | 0.46 | 0.887 | 0.44 | |||||
| 2451595.87 | 0.46 | 1.737 | 0.58 | |||||
| 2451602.73 | 0.14 | 1.826 | 0.33 | |||||
| 2451602.79 | 0.14 | 1.899 | 0.29 |
References. — (a) Armstrong et al. 2001; (b) Mourard et al. 1997; (c) Nordgren et al. 2001; (d) Lane et al. 2000; (e) Kervella et al. 2001.
| Color | d | dFGaaUsing the same photometry as Column 2 but the surface brightness equations of Fouqué & Gieren (1997) |
|---|---|---|
| (pc) | (pc) | |
| (V-R) | 261 17 | 257 18 |
| (V-K) | 269 7 | 254 6 |
| (J-K) | 278 9 | 276 8 |
| Mean | 272 6 | 262 5 |