2002284223[236] \submittedReceived October 2, 2001
Searches for the Shell Swept up by the Stellar Wind from Cyg OB2
keywords:
star clusters and associations, interstellar medium, stellar wind, superbubbles.Abstract – We investigated the kinematics of ionized gas in an extended () region containing the X-ray Superbubble in Cygnus with the aim of finding the shell swept up by a strong wind from Cyg OB2. H observations were carried out with high angular and spectral resolutions using a Fabry–Perot interferometer attached to the 125-cm telescope at the Crimean Observatory of the Sternberg Astronomical Institute. We detected high-velocity gas motions, which could result from the expansion of the hypothetical shell at a velocity of 25–50 km s-1. Given the number of OB stars increased by Knödlseder (2000) by an order of magnitude, Cyg OB2 is shown to possess a wind that is strong enough [ erg s-1] to produce a shell comparable in size to the X-ray Superbubble and to a giant system of optical filaments. Based on our measurements and on X-ray and infrared observations, we discuss possible observational manifestations of the shell swept up by the wind.
1 INTRODUCTION
The studies of Cyg OB2 by Reddish et al. (1966) showed it to be a Galactic association that is unique in compactness and in the density of massive early-type stars. The question of where the shell swept up by the wind from this compact grouping of young stars is has been raised long ago. As such a shell, different authors considered the following: a system of optical filaments, 15∘ in size (Ikhsanov 1960; Dickel et al. 1969); the inner (relative to it) system of filaments, 8–10∘ in size, elongated across the Galactic plane (Bochkarev and Sitnik 1985); the diffuse component of the Cygnus X radio source (Wendker 1970); the Cyg 4 or Cyg 5 gas–dust shells from the list by Brand and Zealey (1975); and the giant X-ray Superbubble in Cygnus (Cash et al. 1980). This list of possibilities is not yet complete.
Recently, the data on the Cyg OB2 stellar population have been radically changed. Having added stars previously hidden due to strong absorption, Knödlseder (2000) increased the number of members and the total mass of the object by an order of magnitude. As a result, the author classified this star grouping as a young globular cluster similar to the numerous blue globular clusters in the Large Magellanic Cloud (LMC), but it is the only one identified in the Galaxy so far. Currently, Cyg OB2 numbers O-type stars, which forces us to significantly (by an order of magnitude; see Section 3) increase the flux of ionizing radiation and the mechanical luminosity of the stellar wind and makes the searches for the swept-up shell around Cyg OB2 even more urgent.
The nature of the X-ray Superbubble in Cygnus and its relationship to Cyg OB2 have been discussed repeatedly. The observations published before 1984 were analyzed in detail by Bochkarev and Sitnik (1985). Uyaniker et al. (2001) carried out new radio continuum observations and comprehensively analyzed currently available observational data for the region in the X-ray and infrared bands and in molecular radio lines. The same conclusion was reached in the two studies: the Cygnus Superbubble is not a physical unity but is the sum of emissions from physically unrelated objects located at distances from 0.5 to 3.5 kpc.
Here, we pose the question from a different angle. There is no doubt that a superposition of the X-ray, optical, infrared, and radio emissions from objects located at different distances along the spiral arm is observed in the Cygnus region. Nevertheless, Cyg OB2 is a compact star grouping that, probably, possesses the strongest stellar wind in the Galaxy whose action has continued for yrs. In that case, where is evidence for the action of this wind on the ambient interstellar gas in the first place? If none of the objects mentioned above can be identified as the shell swept up by the Cyg OB2 wind, then what must be the parameters of the ambient interstellar medium for such a shell to be unobservable?
In attempting to detect the swept-up shell, we investigated the radial-velocity field of the ionized gas in an extended () region using our H observations with a Fabry–Perot interferometer attached to the 125-cm telescope at the Crimean Observatory of the Sternberg Astronomical Institute (SAI).
In Section 1, the X-ray image constructed from the ROSAT archival data is compared with an optical image of the entire region under study. Our interferometric observations are presented in Section 2: we describe the observing and data reduction techniques; construct the radial-velocity distribution of the ionized gas in the region; and reveal the velocities that could be attributable to an expansion of the shell swept up by the wind. In Section 3, based on the possible expansion velocity of the hypothetical shell we found and on currently available optical, X-ray, radio, and infrared observational data, we attempted to find morphological manifestations of this shell. Our conclusions are briefly summarized in the last section.
2 A COMPLETE X-RAY AND OPTICAL IMAGE OF THE REGION UNDER STUDY
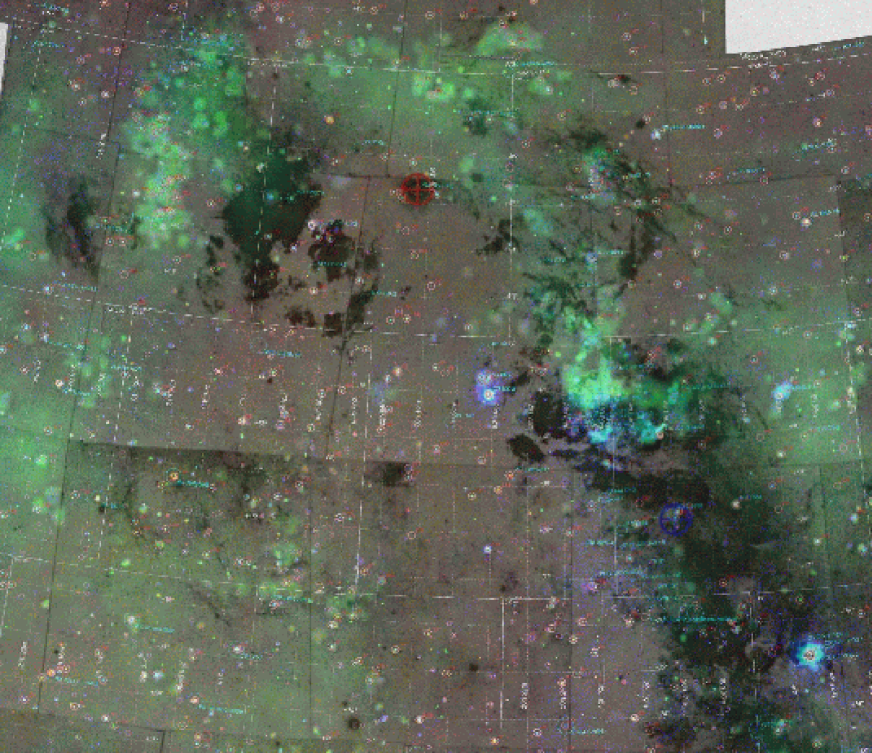
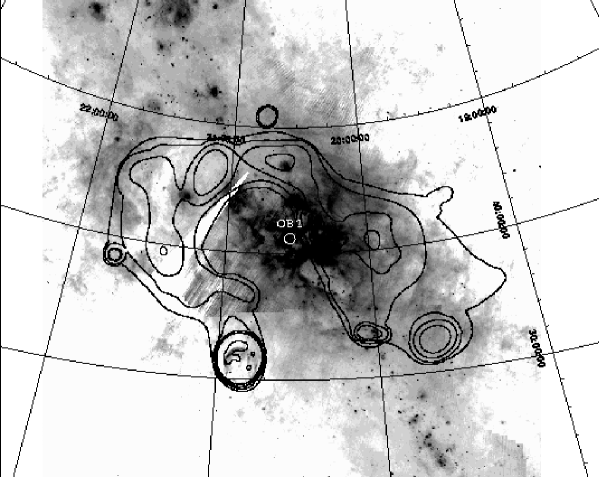
An image of the entire region under study, including the X-ray Superbubble in Cygnus and the giant system of optical nebulae, is shown in Fig. 1.
The high-resolution X-ray brightness distribution was constructed from the ROSAT observational data. For imaging, we used archival data from the ROSAT all-sky survey in three energy bands: 0.11–0.40, 0.40–1.0, and 1.0–2.4 keV. (The charged particle background was removed from these images.) Figure 1 shows the total emission in the three energy bands. Our data reduction revealed the dominance of the 0.4–1.0 keV emission from the Superbubble. The complete X-ray image for the region is a mosaic of 18 separate fields.
Optical emission distribution in the region superimposed on the x-ray is a mosaic map constructed from 19 Palomar Sky Survey red prints. The optical emission is represented by the giant system of diffuse and thin-filament nebulae in the region with , ; , .
As Fig. 1 shows, the giant system of optical filaments and the X-ray Superbubble as a whole closely coincide in the plane of the sky, considering that their emission is produced by plasma with a distinctly different temperature.
3 IONIZED-GAS VELOCITIES IN THE REGION
Observations and Data Reduction
In attempting to identify the shell produced by the Cyg OB2 wind, we analyzed in detail the radial-velocity field by using the H emission of the ionized gas in this most complex region of the Local spiral arm.
We measured the radial velocities in H using a Fabry–Perot interferometer with a focal reducer on the 125-cm telescope at the Crimean Observatory of the SAI.
The observing program for this giant region was initiated in 1991. The detector was an image intensifier before 1994 and an ST-6 -pixel CCD array after 1994.
An interference filter centered on H with a FWHM of 25 Åwas used to pre-monochromatize the emission. The actual spectral resolution of the interferometer corresponded to km s-1; the dispersion region (the radial-velocity range free from an overlapping of adjacent interference orders) was km s-1. The [N II] 6584 Åline was in the middle of this range and was clearly separated from H, whose largest zero-level width did not exceed 200 km s-1 everywhere in the region under study.
The interferometer field of view and angular resolution for observations with the focal reducer at the Cassegrain focus of the 125-cm telescope are 10′ and 3–4′′, respectively.
A gas-filled tube was used as the laboratory H source to calibrate the radial velocities and to allow for the instrumental profile of the interferometer.
The data reduction technique was detailed by Pravdikova (1995). Each line profile was fitted with one or more Gaussians by assuming that the FWHM of each component was larger than the FWHM of the instrumental profile and that the signal-to-noise ratio was . The profile was fitted with a set of Gaussians in those cases where either several peaks, or a clear profile asymmetry, or broad line wings were observed.
In the coarse of our long-term program for studying the region, we obtained more than 1000 interferograms. As a result of their processing, we measured the velocities at maximum and the FWHMs of individual H components approximately at 20 000 positions in the Cygnus region. All these data were used here.
Our observing technique allows us to investigate the extended complex in Cygnus, more than in size, with an angular resolution of 3–4′′, but this requires too much observing time. Therefore, the region was covered with measurements with a nonuniform density. Detailed observations with a multiple overlapping were performed for separate large areas. The velocity field was investigated most extensively in the central and western sectors of the region; in the rest of the region, mostly brighter nebulae (EM pc cm-6) have been investigated so far as a tradeoff. In the areas of weak emission, we carried out mainly search observations with a large step. Only if anomalous velocities or multi-peaked line profiles were found did we study the region in detail.
The velocities and line widths for the extended filaments that form the giant ring system mentioned above were measured with poor spacial covering.
Results of the Interferometric Observations
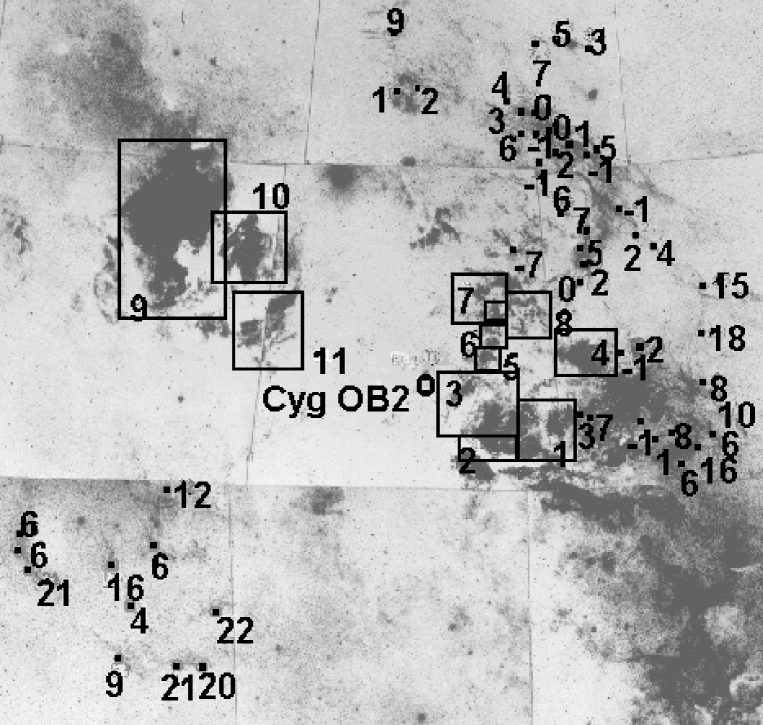
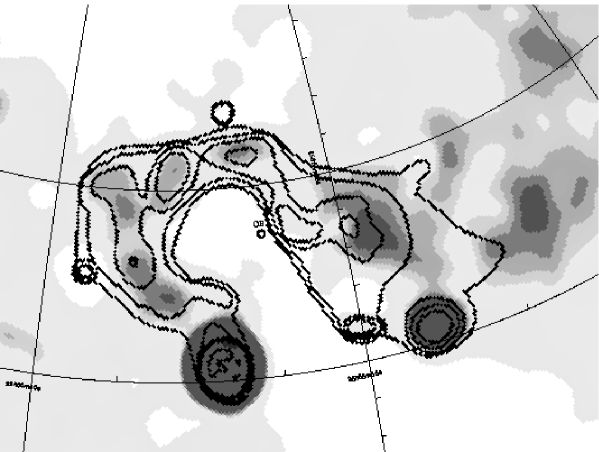
Figure 2 shows a map of optical emission and mark the regions with measured radial velocities.
The small heavy squares indicate the localization of the positions for which individual digital images were obtained with the Fabry–Perot etalon. The square size roughly corresponds to the size of an H interference ring in projection onto the sky. The numbers beside the squares give the radial velocities determined by processing the corresponding interferogram. Since the interference-ring radius is typically , for our purposes, we disregarded the coordinate differences between the radial scans of the interference ring that were used to construct the line profiles. Accordingly, for each position, we averaged from 10–12 to 20–25 velocity measurements for different radial scans of one or two interference rings. The rms error of each velocity measurement varies from interferogram to interferogram within the range 1.5 to 4.5 km s-1. Only for the group of very weak filaments in the southeast of the region does the error exceed these values, ranging from 5 to 9 km -1 for different interferograms. In this way, we present the results of our measurements for those positions at which mostly search observations were carried out.
The results of more detailed observations of the eleven fields for which many interferograms that overlap the field with a large density were obtained are presented in the form of radial-velocity histograms. The rectangles in Fig. 2 mark the boundaries of fields nos. 1–11 for which radial-velocity histograms were constructed in H. The corresponding histograms are shown in Fig. 3.
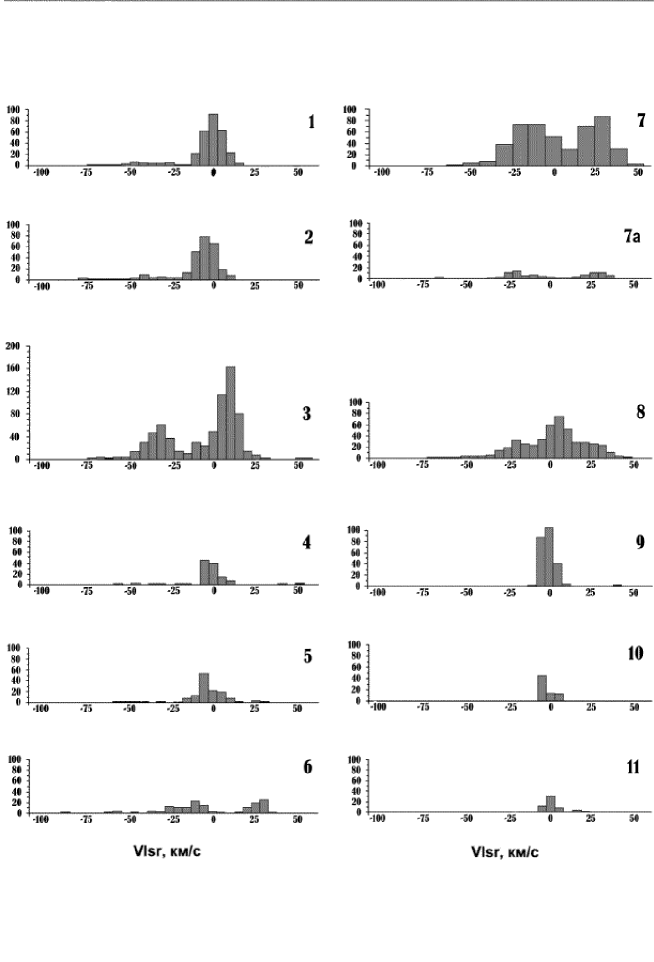
The velocity histograms shown in Fig. 3 were fitted with a set of Gaussians; the fitting results are presented in the table. The columns give, respectively, field numbers and boundary coordinates; mean radial velocities, FWHM and amplitude for each Gaussian of the histogram.
The results of our ionized-gas velocity measurements for the region can be summarized as follows.
The observed H profiles in the Superbubble region in Cygnus consist either of one component, occasionally with a blue or red wing, or of two to three components. In general, the intensity of the weak features observed in the wings does not exceed 15–20 of the intensity of the main component.
Intense blueshifted and redshifted line components are observed toward several areas (fields nos. 3, 6, 7, 7a, and 8). In these fields, the shifted line components are systematically more intense than the main component.
According to the results in Fig. 3 and in the table, the peak velocities of the intense line components vary within the range to km s-1. Weaker features in the line wings at high positive and negative velocities are encountered in the range to km s-1. (Features are also observed at higher positive and negative velocities but at a level below our signal-to-noise ratio .)
| Field | RA(2000):h,m,s | D(2000):∘,’ | V(max) | HFWM | A |
| 1 | 20 18 15 - 20 22 15 | 40 10 - 41 10 | 0.15 0.03 | 13.8 0.1 | 91.4 |
| -44.2 0.6 | 16.4 1.4 | 6.4 | |||
| -26.6 0.5 | 7.8 1.3 | 5.4 | |||
| 2 | 20 22 15 - 20 28 15 | 40 07 - 40 30 | -4.2 0.1 | 13.4 0.3 | 81.8 |
| -38.2 1.6 | 17.8 3.8 | 6.7 | |||
| 3 | 20 25 15 - 20 30 30 | 40 30 - 41 35 | 9.3 0.2 | 11.5 0.3 | 161.7 |
| -31.7 0.3 | 16.6 0.8 | 58.2 | |||
| -5.9 1.2 | 14.3 2.9 | 28.2 | |||
| 4 | 20 15 30 - 20 18 30 | 41 25 - 42 10 | -2.5 0.2 | 8.7 0.6 | 53.2 |
| 5 | 20 25 15 - 20 27 45 | 41 35 - 42 00 | -4.3 0.3 | 8.5 0.7 | 51.8 |
| 6 | 20 24 45 - 20 26 30 | 42 00 - 42 25 | -13.1 1.1 | 23.3 2.5 | 17.1 |
| 27.4 0.5 | 10.2 1.2 | 25.8 | |||
| ? | -55.8 3.7 | 11.0 8.5 | 3.4 | ||
| 7 | 20 24 30 - 20 29 50 | 42 30 - 43 20 | 27.2 1.0 | 20.2 0.6 | 93 |
| -13.5 0.7 | 31.7 1.0 | 79 | |||
| 7a | 20 24 30 - 20 25 45 | 42 30 - 42 50 | 26.7 0.2 | 15.1 0.5 | 11 |
| -9.2 0.9 | 15.0 2.0 | 5.5 | |||
| -22.4 0.2 | 8.5 0.6 | 14.2 | |||
| 7a* | 20 24 30 - 20 25 45 | 42 30 - 42 50 | 26.4 0.4 | 17.3 1.0 | 16 |
| -19.7 0.3 | 15.2 0.5 | 21 | |||
| 8 | 20 20 15 - 20 24 45 | 42 10 - 43 00 | -18.5 0.7 | 23.2 1.7 | 29 |
| 4.3 0.3 | 14.1 0.7 | 71 | |||
| 24.0 0.8 | 18.9 1.8 | 27 | |||
| 9 | 20 54 00 - 20 04 00 | 42 30 - 46 00 | -1.3 0.1 | 9.4 0.2 | 126 |
| 10 | 20 48 00 - 20 55 00 | 43 15 - 44 35 | -3.4 1.1 | 5 3 | 60.4 |
| 11 | 20 46 00 - 20 52 00 | 41 30 - 43 00 | -0.45 0.02 | 7.7 0.03 | 31.3 |
| 16.3 0.2 | 5.5 0.4 | 3.5 |
It is of interest to compare our velocity measurements with the H observations by Reynolds (1983) with a Fabry–Perot spectrometer in the –240∘ band along the Galactic plane at 2∘ intervals. These observations were carried out with a low angular resolution (50′) but with a higher sensitivity than in our measurements and a similar spectral resolution (12 km s-1). Reynolds (1983) noted the presence of weak emission features ( Rayleighs) at high positive velocities forbidden by the differential Galactic rotation and associated them with the expansion of the X-ray Superbubble at a velocity from 20 to 50 km s-1. It seems that in Fig. 4 from the cited paper, two groups of forbidden positive velocities, km s-1 and km s-1, can be identified in the direction . The corresponding features at negative velocities are also seen in the range , and these are also represented by two groups, km s-1 and km s-1.
4 ANALYSIS OF THE OPTICAL, X-RAY, AND INFRARED OBSERVATIONS FOR THE REGION: THE ACTION OF Cyg OB2 ON THE INTERSTELLAR MEDIUM
In this section, using our interferometric observations and X-ray, infrared, and radio studies of the region, we attempt to answer the following questions:
Where is evidence for the action of the Cyg OB2 wind on the interstellar gas? Where is the shell swept up by the wind? Where are observational manifestations of the action of intense ionizing radiation from Cyg OB2 on the ambient gas? What are the parameters of the ambient interstellar medium that make the answers to these trivial questions so equivocal?
We immediately note that, first, the answers are not new but rest on a new line of reasoning, and, second, they require further observational confirmations.
The main difficulty involved in investigating the region is that the kinematic distances in this direction are poorly determined, because the line-of-sight projection of the Galactic rotation velocity changes little with distance. Therefore, the most complex question is whether the various gaseous and stellar components in this densely populated region along the Local spiral arm are physically related.
Kinematic Evidence of the Shell Swept up by the Wind
The problem of revealing kinematic evidence for the existence of a single shell swept up by a strong wind from Cyg OB2 is complicated by the fact that the observed H profile is the sum of emissions from the Local spiral arm up to distances of 3 kpc. Consequently, the velocities can differ because of the different localization of individual nebulae in distance and in the arm cross section. These differences attributable to the differential Galactic rotation and to the passage of spiral density waves lie within the range km s-1 for the sky region in question (Sitnik et al. 2001).
Even if we deal with a physical unity, then, since the hypothetical shell is located in an inhomogeneous dense medium, the line velocity variations over the image may result from the following:
(1) Small-scale gas density fluctuations, which cause a warping of the ionization front and, accordingly, variations in the observed radial velocity;
(2) Gas outflow via the champagne effect when the ionization front collides with dense cloud cores; in the presence of several clouds, gas outflow is observed in both directions.
Since the kinematic effect of these factors does not significantly exceed the speed of sound in an ionized gas either, evidence for the action of the Cyg OB2 wind should be sought by supersonic motions.
The weak features in the line wings observed at high positive and negative velocities are unreliable, because these are often identified at a noise level and may result from incomplete allowance for the radiation from faint stars. The high-velocity motions can also be associated with individual energy sources (the winds from WR and Of stars and blue supergiants or supernova explosions).
Thus, the intense shifted H components that we detected in several central fields may serve as the only reliable kinematic evidence for the existence of a shell. It seems reasonable to attribute these intense high-velocity components to the action of a strong Cyg OB2 wind. We emphasize that individual features at high negative velocities can undoubtedly be produced by the radiation from distant nebulae in the Perseus arm. At the same time, the detected positive velocities reaching km s-1 have no obvious alternative explanation and most likely suggest that there are large-scale motions of ionized gas in the region.
If we deal with a physical unity, then the intense line features at high positive and negative velocities can characterize the receding and approaching sides of the expanding shell, respectively. Our interferometric observations (see Section 2) lead us to conclude that the possible expansion velocity of the hypothetical ionized shell reaches –50 km s-1.
A single-peaked H line is emitted in the thin filaments that form the giant ring system. Its FWHM is 20–35 km s-1 for the group of filaments in the northwest and reaches 45 km s-1 in the southeast (the latter are considerably weaker). The results presented in Fig. 2 suggest that the velocity at the line peak in the northwest varies over the range to km s-1 (the rms error is 3–4 km s-1). In the southeast, the velocity in the region of the weakest filaments varies over a wider range, from 4–6 to 20–22 km s-1, with an rms error of 5–9 km s-1. Reynolds (1983) measured the velocities of some filaments and found km s-1, but these measurements were made with a clearly insufficient angular resolution of 50′ for such thin-filament structures.
Note that several authors (Chaffee and White 1982; Willson 1981; Piependbrink and Wendker 1988; Lockman 1989) observed the velocities of radio line features in the range km s-1 to km s-1 toward the Cygnus X complex by absorption and emission lines. This is generally considered as resulting from the different localization of the emitting and absorbing gas in distance rather than from peculiar motions. Gredel and Munch (1994) identified features in the interstellar C2 absorption lines in the spectra of the Cyg OB2 stars nos. 5 and 12 at velocities reaching km s-1, which strongly suggests high-velocity motions of the molecular clumps in the association region. Interestingly, the two stars, which are 5 pc apart in the plane of the sky, exhibit absorption features at close velocities. In the opinion of the authors, this suggests a layered structure of the absorbing molecular clumps.
Cyg OB2: A New Estimate for the Mechanical Luminosity of the Stellar Wind
Previous studies of Cyg OB2 have revealed an elliptical stellar structure, in size, with members. Three hundred OB stars, five O5 stars, the only northern-sky O3 star, three WR stars, and several O5 If, O4 IIIf, and LBV stars were identified In Cyg OB2; the association includes the most luminous and most massive stars of the Galaxy (Reddish et al. 1966; Torres-Dodgen et al. 1991; Massey and Thompson 1991; Persi et al. 1985). Reddish et al. (1966) first pointed out that Cyg OB2 differs from Galactic OB associations by compactness, large mass, and high star density, which make the object similar to young blue globular clusters in the LMC.
Recently, a qualitatively new step has been made by Knödlseder (2000). He passed from optical to infrared wavelengths, which allowed him to significantly increase the stellar population of the association by adding objects previously hidden due to strong absorption: according to his estimates, for Cyg OB2 stars. According to the new data, Cyg OB2 is spherical in shape. The coordinates of its center are RA and D; , ; the size of the region containing of the stellar population is 90′ (45 pc). In what follows, the distance to Cyg OB2 is assumed to be kpc, as estimated by Massey and Thompson (1991).
The current mass of Cyg OB2 is (4–10), the number of its members with spectral types earlier than F3 reaches , and the number of its OB stars is , including 120 O stars. This mass and star density distinguish Cyg OB2 from other associations so clearly that Knödlseder (2000) reached the following unequivocal conclusion: the object is actually the only Galactic representative of the population of young blue globular clusters, which are so numerous in the LMC. The H–R diagram for Cyg OB2 clearly reveals main-sequence stars up to a mass of 85 M; although the association is compact, star formation in it was, probably, not coeval (Massey and Thompson 1991). The age of Cyg OB2 is yrs, as estimated by Torres-Dodgen et al. (1991); using new data on the stellar population, Knödlseder et al. (2001) obtained yrs.
The wind mechanical luminosity for previously known members of the association was estimated to be L erg s-1 (Abbott et al. 1981). The mass loss rate for the five most luminous stars in Cyg OB2 is (2–10) M yr-1 at a wind velocity of 2000–7500 km s-1 (Persi et al. 1983; Leitherer et al. 1982).
Given the new data on the Cyg OB2 population, the above wind mechanical luminosities should be reestimated. We use a detailed analysis of the changes in wind energy during the evolution of a rich star grouping performed by Leitherer et al. (1992) (see also Comeron and Torra 1994). As follows from the cited paper, at an early stage ( yrs) for normal metallicity, the wind mechanical luminosity is kept approximately constant, being erg s-1 per unit total mass of all the stars with masses in the range 1–120 . The total mass for Cyg OB2 is , which yields erg s-1. This mechanical luminosity is maintained at least for yrs and increases further as WR stars appear.
Possible Manifestations of the Shell Swept up by the Cyg OB2 Wind
The radius and expansion velocity of the shell that the Cyg OB2 wind could produce in a medium with a known initial density over a cluster lifetime yrs give the relations following from the classical theory by Castor et al. (1975) and Weaver et al. (1977):
where is the age, Myr; is the radius, pc; and is the stellar-wind mechanical luminosity, erg s-1.
It follows from these relations that the possible expansion velocity of km s-1 determined from the optical emission can be produced by the Cyg OB2 wind in a medium with a reasonable initial density n cm-3; in this case, the shell radius can reach pc.
The structures of such a size are represented by the giant system of optical filaments and by the X-ray Superbubble, which have been repeatedly discussed in the literature. Below, we briefly consider the main arguments for and against this identification.
The giant ring of optical filaments.
The giant ring of weak optical filaments mentioned by Morgan et al. (1955) and Struve (1957) has EM cm-6pc (Dickel et al. 1969). Ikhsanov (1960) considered this system of filaments as a physical unity that bounds the complex of nebulae ionized by Cyg OB2 stars.
Based on the extinction estimated from the ratio of the H and radio continuum intensities and on the distance dependence of , Kapp-Herr and Wendker (1972) concluded that the filaments constituting the giant shell in the plane of the sky lay at different distances. Unfortunately, this method is unreliable in the Cygnus region, because the absorbing matter is inhomogeneous: we now know that varies between 5m and 20m (Knödlseder 2000) even toward the compact Cyg OB2 grouping located at the same photometric distance of 1700 pc. Besides, in these estimates, the optical emission was averaged over 11′ fields and the radio emission was estimated with a 30′ resolution, which is clearly not enough for such thin filaments.
Our ionized-gas velocity measurements are consistent with the assumption that the giant system of filaments is the shell swept up by the Cyg OB2 wind. We determined the possible expansion velocity, km s-1, from the H emission of the central region, mainly toward the Cygnus X complex. The filaments with measured velocities are mostly located on the Superbubble periphery and their radial velocities must be lower because of the projection effect.
The filaments in the southeast must be studied in more detail, because our observations with poor spacial covering revealed here high positive velocities, 20–22 km s-1. These are the weakest filaments among the objects that we investigated toward Cygnus; the measurement error in the velocity here is larger than that in the remaining region (5–9 km s-1; see Section 3). Besides, it may well be that these filaments do not lie on the shell periphery. As Fig. 1 shows, the system of optical filaments and the X-ray Superbubble as a whole closely coincide in the plane of the sky, but the X-ray region in the southeast goes outside the thin optical filaments by 2–3∘. The high velocities of these filaments may also be attributable to a local energy source.
Note that the ring structure of H I clouds with the same angular size observed in the velocity range to km s-1 (Gosachinskii and Lozinskaya 1997), probably, corresponds, to the system of optical filaments. This is also an argument for a physical unity.
The X-ray Superbubble in Cygnus.
The X-ray Superbubble in Cygnus that was identified by Cash et al. (1980) using HEAO-1 observations with an angular resolution of was considered by the authors as a physical unity associated with Cyg OB2 and with the above system of optical filaments. The size of the Superbubble was estimated to be 450 pc, its X-ray luminosity is erg s-1, and the density of the emitting plasma is cm-3. Different authors explained the formation of a superbubble with such parameters either by sequential explosions of several tens of supernovae in Cyg OB2 (Cash et al. 1980), or by the combined action of the wind from the same association (Abbott et al. 1981), or by a supernova explosion inside the previously formed low-density cavity (Higdon 1981), or by the explosion of a single supermassive star (Blinnikov et al. 1982).
According to the alternative interpretation by Bochkarev and Sitnik (1985) and Uyaniker et al. (2001), the X-ray Superbubble is not a physical unity but is the sum of emissions from supernova remnants, the shells around individual stars and OB associations swept up by the wind, cataclysmic variables, hot stellar coronas, etc. located in the Local spiral arm at distances from 0.5 to 4 kpc. The X-ray shell morphology in the plane of the sky results from absorption of the X-ray emission in a dense layer of clouds at 700–900 pc (the so-called Great Cygnus Rift).
We performed a detailed analysis of the ROSAT observations in an effort to reveal the possible X-ray emission component produced by a strong Cyg OB2 wind. Here, we briefly summarize the main conclusions of our analysis.
The fact that the shell morphology of the Superbubble is mainly explained by absorption may be considered to have been firmly established.
The ROSAT observations confirm the previous conclusion by Bochkarev and Sitnik (1985) that most of the X-ray emission (up to 50–80) is produced by point sources of a different nature. However, their conclusion that the diffuse part of the X-ray emission originates from the cavities swept up by individual OB associations in the Cygnus region is apparently not confirmed. A simple superposition of the association boundaries on the ROSAT X-ray map reveals no one-to-one coincidence and this cannot be explained by absorption [see Fig. 1 in Uyaniker et al. (2001)].
The conclusion by Uyaniker et al. (2001) that individual regions of the Cygnus Superbubble have different radiation spectra and cannot be considered as a physical unity is based on a comparison of the X-ray hardness and the column density of the absorbing matter (H I). The authors pointed out that the bulk of the absorbing matter in the fields with the strongest absorption have high negative velocities, km s-1. This result is of great interest but it requires a further detailed analysis. Indeed, the above effect implies that either the bulk of the matter lies far and cannot absorb the X-ray emission or it is located in the region under consideration and has been affected by a shock wave, which accounts for the observed high negative velocity. (If this is the case, then the velocity of the absorbing neutral hydrogen closely matches our derived expansion velocity of the hypothetical shell.)
In any case, however, the X-ray spectra of different parts of the Superbubble should be compared only after removing the point sources whose contribution is comparable to the diffuse component.
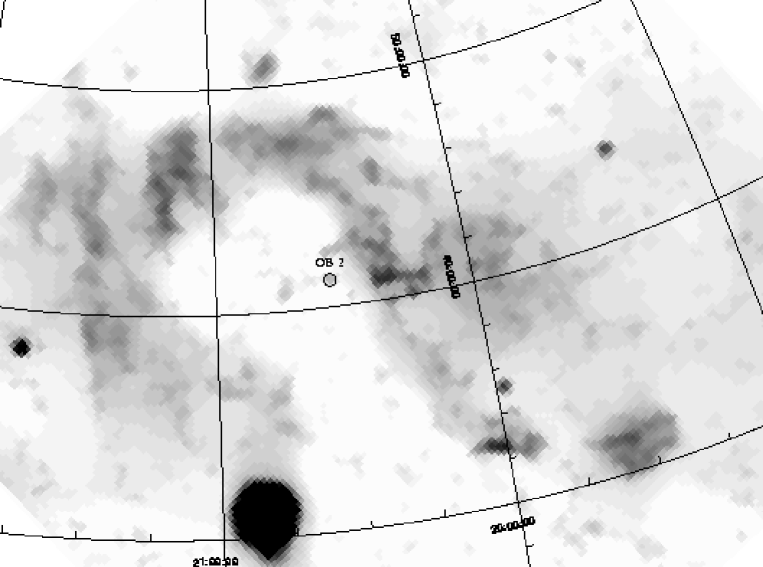
The diffuse X-ray emission from the Superbubble. To identify the diffuse X-ray emission component, we used the ROSAT XRT/PSPC all-sky survey maps cleaned from point sources; the angular resolution is 12′ (Snowden et al. 1997).
The derived intensity distribution of the diffuse emission in the range 0.7–0.9 keV is shown in Fig. 4. The total size of the X-ray region determined from the outermost areas of the Superbubble reaches 15–18∘.
An extended arc-shaped X-ray region, which forms the eastern and southeastern parts of the Superbubble (; ), is clearly seen in the figure. This eastern X-ray arc currently seems to be the most plausible observational manifestation of the part of the shell swept up by the Cyg OB2 wind in a tenuous interstellar medium.
According to Uyaniker et al. (2001), this arc structure (the southern arc in the Galactic coordinate system used in their paper) was produced by the Cyg OB4 wind. This conclusion does not seem justifiable. Indeed, Cyg OB4 is the poorest association in the region; it consists of a mere two OB stars (B9 Iab and B0.5 IV; see Bl ha and Humphreys 1989). Besides, the elongated shape of the X-ray arc reveals no clear morphological relationship to this association.
Figure 5a shows the intensity distribution of the diffuse X-ray emission, as constructed from ROSAT data, superimposed on the distribution of the intensity ratio of infrared emissions in two bands (60/100 mkm), as constructed from IRAS data. Only the brightest X-ray isophotes (confidence level 100) corresponding to 16, 32, 100, 200, and 13000 in units of counts s-1 per square arcminute or to 4, 8, 26, 51, 3300 in units of erg s-1 per square arcminute are shown.
The dust temperature distribution in the intensity ratio of infrared 60/100 mkm emissions (see Fig. 5) reveals an extended () elliptical structure of warmer dust that generally copies the shape of the X-ray Superbubble and surrounds it. An extended arc is also clearly seen here east of the region. This arc of warm dust has the same shape as the X-ray arc, and it also surrounds the latter from outside. Such a region of warm dust can be produced by inelastic collisions of dust grains with hot X-ray plasma, as is the case in supernova remnants.
Figure 5b shows the temperature distribution of the X-ray emitting plasma that we derived from ROSAT data. The temperature map was constructed from calibrations of the temperature and absorption effects on the fluxes in three spectral bands of the PSPC/ROSAT detector (Finoguenov 1997) and superimposed on the intensity distribution of the diffuse X-ray emission. The temperature map was obtained from the so-called spectral hardness, which is defined as the ratio , where is the 0.5–0.9 keV flux and is the 0.9–2 keV flux, and smoothed with a Gaussian with the FWHM pixels. The white spot inside the Superbubble may result from the absorption corresponding to a column density of absorbing atoms cm-2.
A detailed analysis of the distributions of temperature, intensity of the diffuse X-ray emission, and absorbing atoms on the line of sight is beyond the scope of this study. Here, it it only important to note that the X-ray temperature differences over the entire length of the eastern arc are small, mainly from 0.50 to 0.57 keV (except for the compact source). This allows the eastern arc to be considered as a physical entity, which most likely represents the X-ray emission from the part of the shell swept up by the Cyg OB2 wind.
The X-ray emission from the plasma heated by the Cyg OB2 wind, probably, contributes significantly to other parts of the Cygnus Superbubble as well. However, it cannot yet be reliably identified against the background of the total emission along the Local spiral arm. Therefore, we estimate the parameters of the entire X-ray emission as an upper limit on the luminosity and mass of the hot plasma attributable to the Cyg OB2 wind.
The identified diffuse X-ray 0.4–2.1-keV emission from the entire Superbubble corresponds to 275.1 counts s-1. For an equilibrium plasma of solar chemical composition at the temperature keV and a distance of 1.7 kpc, this gives a bolometric luminosity L erg s-1. In this case, most of the luminosity is emitted in the 0.4–2.1 keV band (L erg s-1).
The mass of the X-ray emitting plasma reaches M M⊙, and the electron density is cm-3.
We emphasize once again that this is an upper limit on the luminosity and mass of the hot plasma, which may be attributable to the Cyg OB2 wind. However, even if most of the emission from the X-ray Superbubble is attributable to the Cyg OB2 wind, our new estimate of the wind mechanical luminosity suggests that there are currently no problems with the Superbubble energetics.
The Interstellar Medium Around Cyg OB2: A General Scheme
The last question posed at the beginning of this section seems easiest to answer: the shell swept up by the wind can be hidden in a highly inhomogeneous interstellar medium characterized by dense clouds with even denser compact clumps and a tenuous intercloud medium.
The conclusion of a high local gas density in the Cyg OB2 region follows from an analysis of the interstellar extinction toward this region.
According to Neckel and Klare (1980), the extinction toward Cyg OB2 reaches A at a distance of kpc; in nearby fields, A is reached at a distance of 1–2 kpc. At larger distances, the extinction increases only slightly up to a limiting distance of 3 kpc. According to Ikhsanov (1959), in the extended region bordering Cyg OB2 in the west, north, and south, the extinction monotonically increases to up to a distance of 1.15–1.4 kpc and then sharply increases to at a distance of 2.2–3.5 kpc. The brightness ratio of optical nebulae in the radio continuum and H toward Cyg OB2 gives an extinction (Dickel and Wendker 1978). Thus, the extinction in the entire extended region up to a distance of 3 kpc does not significantly exceed .
At the same time, the extinction derived from photometry of Cyg OB2 stars is A (Knödlseder 2000). Hence, a significant fraction of the absorbing matter (up to of the column density) is local relative to Cyg OB2.
The conclusion of a high local gas density in the Cyg OB2 region can also be drawn from other considerations. The star density at the center of the young globular cluster Cyg OB2 is 40–150 M/pc-3, as estimated by Knödlseder (2000). Since only part of the mass of the parent molecular cloud turns into stars, we obtain a lower limit on the initial atomic hydrogen density in the parent cloud: n cm-3.
The dense matter of the parent molecular cloud left after the main star-formation episode is rapidly removed from the central region of the globular cluster by ionizing radiation and winds from the formed stars. However, the densest gaseous clumps are not swept up by the shock wave but are compressed and remain immersed in a tenuous cavity. Such dense molecular clumps live long enough and can presently be observed in the Cyg OB2 region. They are actually observed: the clumpy structure of the molecular gas composed of separate clumps was revealed by interstellar C2 absorption lines in the spectra of the Cyg OB2 stars nos. 5 and 12 (Gredel and Munch 1994). The characteristic size of the clumps is pc (the most probable size is 1 pc) and their mass is M; the clumps are located in the Cyg OB2 region. Using the size and column density , we obtain the molecular hydrogen density in the clumps, cm-3. (The lower limit at pc is cm-3 for star no. 12 and cm-3 for star no. 5). Such dense clumps are immersed in a low-density gas.
Cygnus as an H II region ionized by Cyg OB2.
The Lyman continuum flux from 120 O-stars of Cyg OB2 alone is phot. s-1 (Knödlseder 2000). In a homogeneous medium with a density of 1, 10, and 100 cm-3, the radius of the corresponding H II region reaches 300, 65, and 15 pc and the emission measure is 300, 6500, and 150 000 cm-6pc, respectively.
Whereas the absence of intense optical emission from this ionized gas can be explained by strong absorption, its intense thermal radio emission must be observed in any case. Using the exclusion method, we find only one possibility: this emission is represented by the Cygnus X complex of radio sources. [This possibility has been repeatedly discussed starting from Veron (1965); see also Landecker 1984]. In any case, the regions of ionized gas with appropriate density and emission measure are observed only in Cygnus X. The bright features of the complex are observed against the background of an extended weaker radio continuum source, 6–7∘ in size, with Cyg OB2 being projected onto its central part (Wendker 1970; Huchmeier and Wendker 1977). This diffuse source was immediately identified by the authors as an H II region ionized by Cyg OB2 (see also Wendker et al. 1991). If the extended source is at the distance of Cyg OB2, then its radius reaches 100 pc, EM cm pc, and the mean electron density is cm-3. EM cm-6pc in the bright H II regions of Cygnus X and reaches – cm-6pc in compact radio clumps; the density is -3 in the bright radio sources and at least an order of magnitude higher in compact clumps (see, e.g., Dickel et al. 1969; Piependbrink and Wendker 1988).
Thus, the parameters of the Cygnus X complex agree with those expected for the H II region ionized by Cyg OB2 stars. The only objection to this identification is the long-standing and popular belief that Cygnus X is not a physical unity but is the sum of emissions from the many sources located at different distances, from 500 pc to 3–4 kpc, along the spiral arm (see, e.g., Wendker 1984; Piependbrink and Wendker 1988; and references therein).
The following two basic methods of distance determination underlie this belief: from the radial velocities of sources and from the extinction . Both are unreliable in the direction of Cygnus (see above).
Therefore, we cannot rule out the possibility that the diffuse component and some of the sources forming the Cygnus X complex are located at the same distance of 1700 pc. Of course, individual features of the complex can lie nearer or farther. In this case, the Cygnus X complex can be a remnant of the parent cloud ionized by Cyg OB2 stars. [This conclusion was also drawn by Landecker (1984) from detailed measurements of the complex in the H166 recombination line.] Separate dense clumps of this cloud became nests for the ongoing star formation and have their own, local ionization sources.
A number of findings argue for the validity of this assumption.
The dust temperature distribution in the region. Figure 5 shows the distribution of the intensity ratio of infrared emissions in two bands (60/100 mkm), as constructed from IRAS data, which reflects the dust temperature distribution in the entire region under study. The highest temperature in a large region containing the Cygnus Superbubble is observed toward the Cygnus X complex. The Cyg OB2 cluster lies at the center of the region of warm dust, and the warmest local spots are directly projected onto Cyg OB2 and surround it. This is evidence of the physical interaction between Cyg OB2 stars and a dense cloud.
The CO distribution in the region. The Cyg OB2 cluster lies within a local region of reduced brightness surrounded by the brightest CO clouds in the direction of Cygnus X. This is clearly shown by the CO isophotal maps integrated over the velocity range to km s-1 and over narrower velocity ranges: –0; 0–5, 5–10, and 10–15 km s-1 [see Leung and Thaddeus (1992) and references therein]. This is consistent with the proposed model, because the parent molecular cloud must be destroyed in close proximity to Cyg OB2.
The H I distribution in the Cygnus X region. Note also the shell structure of H I and CO clouds identified by Gosachinskii et al. (1999) around the Cygnus X complex. Although this extended shell was identified with major reservations, its existence, if confirmed, argues for a single complex. These authors (see also Gosachinskii and Lozinskaya 1997) also pointed out that the coordinates and radial velocities of H II regions, as inferred from the observations by Piependbrink and Wendker(1988) in radio recombination lines, create a semblance of a ring structure, suggesting a large-scale radial motion in Cygnus X in the velocity range to km s-1.
A general scheme for the interaction of Cyg OB2 with the interstellar medium
Currently available optical, X-ray, infrared, and radio observations allow the following general scheme of the region to be considered.
The blue globular cluster Cyg OB2 was formed in a medium with a high initial density and mainly destroyed the parent molecular cloud over its lifetime. The radio emission from the remnants of the parent cloud ionized by Cyg OB2 is represented by the diffuse component and, possibly, by individual sources of the Cygnus X complex. The densest compact clumps of the destroyed molecular cloud are observed in radio lines in absorption.
The high gas velocities that we detected in optical nebulae are attributable to an expansion of the shell swept up by the Cyg OB2 wind. The expansion velocity of the swept-up shell reaches 25–50 km s-1; this shell is bounded by a giant system of thin filaments.
The burst of the Cyg OB2 wind into a low-density intercloud medium is responsible for the formation of an extended region of diffuse X-ray emission. The cluster was apparently formed not at the center but at the edge of a dense cloud. Therefore, the burst of the wind into a low-density medium in the southeastern direction produced the most prominent arc-shaped structure of X-ray and infrared emission. This arc-shaped structure seems to be the most plausible manifestation of the shell swept up by a strong Cyg OB2 wind. That is why Cyg OB2 and the dense ionized cloud (Cygnus X) are located not at the center but on the northwestern boundary of the extended X-ray region (the Cygnus Superbubble).
CONCLUSIONS
Our most conservative conclusions can be formulated as follows:
(1) Our interferometric H observations have revealed high-velocity motions of ionized gas, which may be related to an expansion of the hypothetical shell swept up by the Cyg OB2 wind in a medium with an initial density of 1–10 cm-3. The expansion velocity determined by these motions reaches 25–50 km s-1.
(2) Given the number of OB stars increased by an order of magnitude, Cyg OB2 has the strongest stellar wind among Galactic associations: according to our new estimate, erg s-1. The wind mechanical luminosity over a Cyg OB2 lifetime of yrs is high enough to produce a shell comparable in size to the X-ray Superbubble and to the giant system of optical filaments.
(3) The most plausible manifestations of the shell swept up by the Cyg OB2 wind in a tenuous medium are the following: the giant system of optical filaments; the diffuse component of the X-ray Superbubble in Cygnus, primarily the extended eastern arc that forms it; the extended elliptical region of warm dust, in particular, the eastern arc of warm dust that bounds the arc-shaped X-ray region.
(4) The Cyg OB2 cluster formed in a medium with a high initial density. The remnants of the parent molecular cloud ionized by Cyg OB2 stars are, probably, represented by the diffuse component and, possibly, by individual sources of the Cygnus X complex.
The proposed scheme undoubtedly requires a thorough observational verification. Of greatest interest are searches for high-velocity features of interstellar absorption lines in the entire region; a detailed analysis of the spectrum for the diffuse X-ray emission component of the Superbubble; and a comparison of the column density of the absorbing gas derived from the X-ray spectrum with direct CO line measurements. Such a study is already under way.
ACKNOWLEDGMENTS
This work was supported by the Russian Foundation for Basic Research (project no. 01-02-16118) and the Program “Astronomy” (project no. 1.3.1.2).
REFERENCES
-
1.
D. C. Abbott, J. H. Bieging, and E. Churchwell, Astrophys. J. 250, 645 (1981).
-
2.
C. Blaha and R. Humphreys, Astron. J. 98, 1598 (1989).
-
3.
S. I. Blinnikov, V. S. Imshennik, and V. P. Utrobin, Pis’ma Astron. Zh. 8, 671 (1982) [Sov. Astron. Lett. 8, 361 (1982)].
-
4.
N. G. Bochkarev and T. G. Sitnik, Astrophys. Space Sci. 108, 237 (1985).
-
5.
P. Brand and W. J. Zealey, Astron. Astrophys. 38, 363 (1975).
-
6.
W. Cash, P. Charles, S. Bowyer, et al., Astrophys. J. Lett. 238, 71 (1980).
-
7.
J. Castor, R. McCray, and R. Weaver, Astrophys. J. Lett. 200, 107 (1975).
-
8.
F. H Chaffee and R. E. White, Astrophys. J., Suppl. Ser. 50, 169 (1982).
-
9.
F. Comeron and J. Torra, Astrophys. J. 423, 652 (1994).
-
10.
H. R. Dickel and H. J. Wendker, Astron. Astrophys. 66, 289 (1978)
-
11.
H. H. R. Dickel, H. Wendker, and J. H. Bieritz, Astron. Astrophys. 1, 270 (1969).
-
12.
A. V. Finoguenov, Candidate’s Dissertation (Inst. Kosm. Issled. Ross. Akad. Nauk, Moscow, 1997).
-
13.
I. V. Gosachinskii and T. A. Lozinskaya, Astron. Zh. 74, 201 (1997) [Astron. Lett. 41, 174 (1997)].
-
14.
I. V. Gosachinskii, T. A. Lozinskaya, and V. V. Pravdikova, Astron. Zh. 76, 453 (1999) [Astron. Rep. 43, 391 (1999)].
-
15.
R. Gredel and G. Munch, Astron. Astrophys. 285, 640 (1994).
-
16.
J. C. Higdon, Astrophys. J. 244, 88 (1981).
-
17.
W. K. Huchmeier and H. J. Wendker, Astron. Astrophys. 58, 197 (1977).
-
18.
R. N. Ikhsanov, Izv. Krym. Astrofiz. Obs. 21, 257 (1959).
-
19.
R. R. Ikhsanov, Astron. Zh. 37, 988 (1960) [Sov. Astron. 4, 923 (1960)].
-
20.
A. V. Kapp-Herr and H. J. Wendker, Astron. Astrophys. 20, 313 (1972).
-
21.
J. Knodlseder, Astron. Astrophys. 360, 539 (2000).
-
22.
J. Knodlseder, M. Cervino, D. Schaerer, et al., astro-ph/0104074 (2001).
-
23.
T. L. Landecker, Astron. J. 89, 95 (1984).
-
24.
C. Leitherer, H. Hefele, O. Stahl, and B. Wolf, Astron. Astrophys. 108, 102 (1982).
-
25.
C. Leitherer, C. Roberts, and L. Drissen, Astrophys. J. 401, 594 (1992).
-
26.
E. O. Leung and P. Thaddeus, Astrophys. J., Suppl. Ser. 81, 267 (1992).
-
27.
F. Lockman, Astrophys. J., Suppl. Ser. 70, 469 (1989).
-
28.
P. Massey and A. B. Thompson, Astron. J. 101, 1408 (1991).
-
29.
W. W. Morgan, B. Stromgren, and H. M. Johnson, Astrophys. J. 121, 611 (1955).
-
30.
Th. Neckel and G. Klare, Astron. Astrophys., Suppl. Ser. 42, 251 (1980).
-
31.
P. Persi, M. Ferrari-Toniolo, and G. L. Grasdalen, Astrophys. J. 269, 625 (1983).
-
32.
P. Persi, M. Ferrari-Toniolo, M. Tapia, et al., Astron. Astrophys. 142, 263 (1985).
-
33.
A. Piependbrink and H. J. Wendker, Astron. Astrophys. 191, 313 (1988).
-
34.
V. V. Pravdikova, Pis’ma Astron. Zh. 21, 453 (1995) [Astron. Lett. 21, 403 (1995)].
-
35.
V. L. Reddish, L. Lawrens, and N. M. Pratt, Publ. R. Obs. Edinb. 5, 111 (1966).
-
36.
R. J. Reynolds, Astrophys. J. 268, 698 (1983).
-
37.
E. G. Sitnik, A. M. Mel’nik, and V. V. Pravdikova, Astron. Zh. 78, 40 (2001) [Astron. Rep. 45, 34 (2001)].
-
38.
S. L. Snowden, E. Egger, M. J. Freyberg, et al., Astrophys. J. 485, 125 (1997).
-
39.
O. Struve, Sky Telesc. 16, 118 (1957).
-
40.
A. V. Torres-Dodgen, M. Tapia, and M. Carroll, Mon. Not. R. Astron. Soc. 249, 1 (1991).
-
41.
B. Uyaniker, E. Furst, W. Reich, et al., Astron. Astrophys. 371, 675 (2001).
-
42.
P. Veron, Ann. Astrophys. 28, 391 (1965).
-
43.
R. Weaver, R. McCray, J. Castor, et al., Astrophys. J. 218, 377 (1977).
-
44.
H. J. Wendker, Astron. Astrophys. 4, 378 (1970).
-
45.
H. J. Wendker, Astron. Astrophys., Suppl. Ser. 58, 291 (1984).
-
46.
H. J. Wendker, L. A. Higgs, and T. L. Landecker, Astron. Astrophys. 241, 551 (1991).
-
47.
R. F. Willson, Astrophys. J. 247, 116 (1981).
Translated by V. Astakhov